Method and apparatus of three-dimensional seismic tomography imaging
A tomography, three-dimensional seismic technology, applied in the field of mine exploration, can solve problems such as inaccurate determination
- Summary
- Abstract
- Description
- Claims
- Application Information
AI Technical Summary
Problems solved by technology
Method used
Image

Examples
Embodiment Construction
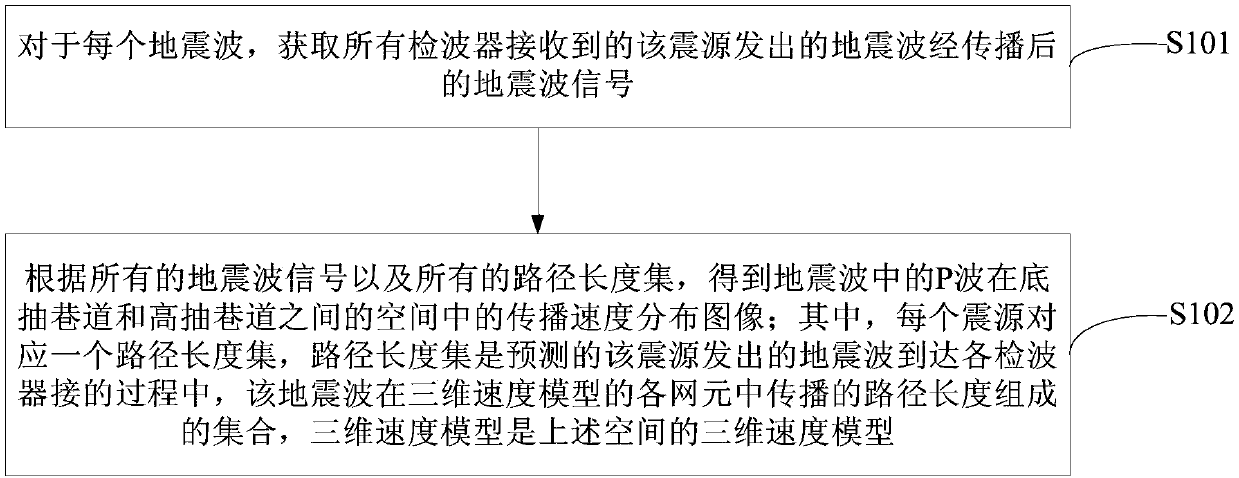
[0049] In order to make the purpose, technical solutions and advantages of the embodiments of the present invention clearer, the technical solutions in the embodiments of the present invention will be clearly and completely described below in conjunction with the drawings in the embodiments of the present invention. Obviously, the described embodiments It is a part of embodiments of the present invention, but not all embodiments. Based on the embodiments of the present invention, all other embodiments obtained by persons of ordinary skill in the art without making creative efforts belong to the protection scope of the present invention.
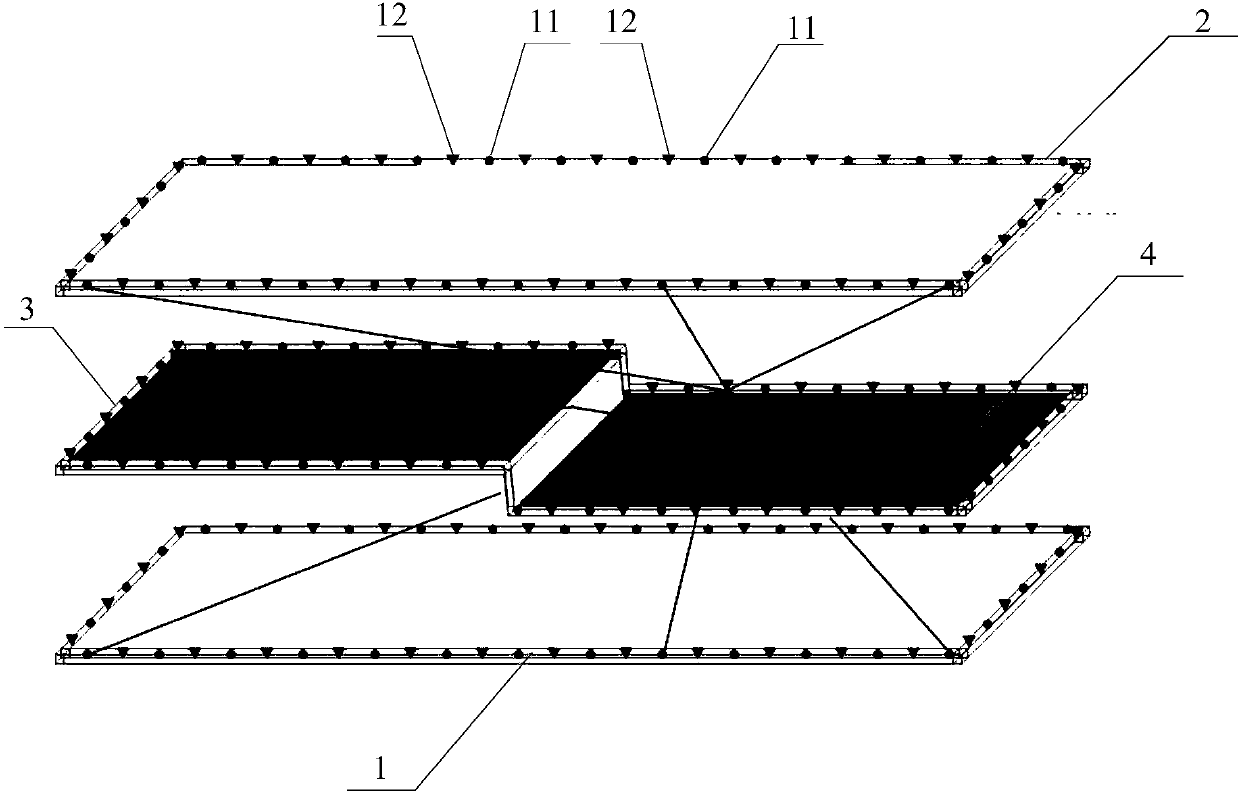
[0050] figure 1 Schematic diagram of the layout of the seismic wave transceiver device provided by the present invention, figure 2 For the flow chart of Embodiment 1 of the method for three-dimensional seismic tomography provided by the present invention, see figure 1 , in the bottom pumping roadway 1 of the coal seam, the high pumping roadw...
PUM
 Abstract
Description
Claims
Application Information
PatSnap Eureka turns technology decisions into work you can execute. Powered by our Innovation Knowledge Graph, it runs expert workflows across engineering, life sciences, materials and intellectual property. Get your review-ready output in minutes.


