Visual display method for production logistics and warning
A technology of logistics and production data, applied in logistics, forecasting, instruments, etc., can solve the problems of lag in production management, lack of visual display and early warning mechanism of production data, etc., and achieve the effect of avoiding lag in management
- Summary
- Abstract
- Description
- Claims
- Application Information
AI Technical Summary
Problems solved by technology
Method used
Image

Examples
Embodiment 1
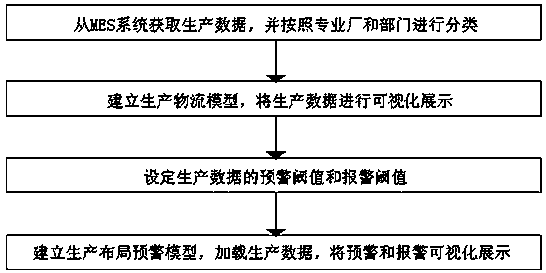
[0050] combined with figure 1 As shown, a visual display method of production logistics and early warning, including:
[0051] Step S100: Obtain production data from the MES system, and classify the production data according to specialized factories and departments;
[0052] Step S200: establishing a production logistics model, and visually displaying production data;
[0053] Step S300: setting an early warning threshold according to the data of the production logistics model;
[0054] Step S400: Establish a production layout early warning model, load the production logistics model data, and visualize the early warning.
[0055] working principle:
[0056] Obtain production data from the MES system of the production control center, and classify according to the specialized factories in the production data, and further classify the production data of different departments in the specialized factory, and the production data screened out by different departments contains The...
Embodiment 2
[0058] On the basis of Example 1, in conjunction with the attached figure 1 As shown, the production data includes logistics handover data, production input data, product output data, material distribution data and material return data, wherein:
[0059] The logistics handover data includes fields: issuing department, receiving department, handover order drawing number, type, quantity, handover time, receiving time and professional factory name;
[0060] Production input data includes fields: new WIP type, new WIP number, new WIP quantity, receiving time, receiving department and professional factory name;
[0061] Product output data includes fields: product name, type, drawing number of handover order; quantity, handover time, receiving time, handover department, receiving department and professional factory name;
[0062] Material delivery data includes fields: delivery material category, delivery material number, delivery material quantity, receiving time, delivery time, ...
Embodiment 3
[0071] On the basis of embodiment 2, in conjunction with the attached figure 1 As shown, the step S200 specifically includes:
[0072] Step S210: Obtain the structural parameters of the production data according to the fields of the production data;
[0073] Step S220: Determine the generated graph model;
[0074] Step S230: Divide the production data into different data blocks to be displayed according to department, category or time;
[0075] Step S240: Determine the chart type according to the data block to be displayed;
[0076] Step S250: Display the data block to be displayed in the area corresponding to the chart type.
[0077] working principle:
[0078] Establish parameters for the fields and field types contained in the production data obtained in step S100, pre-generate a chart model according to the structural parameters, subdivide the production data according to the professional factory, department, and part type, and count the number of parts according to th...
PUM
 Abstract
Description
Claims
Application Information
 - R&D Engineer
- R&D Manager
- IP Professional
- Industry Leading Data Capabilities
- Powerful AI technology
- Patent DNA Extraction
Browse by: Latest US Patents, China's latest patents, Technical Efficacy Thesaurus, Application Domain, Technology Topic.
© 2024 PatSnap. All rights reserved.Legal|Privacy policy|Modern Slavery Act Transparency Statement|Sitemap