Hedging transaction analysis method and device based on wavelet analysis, and storage medium
A technology of wavelet analysis and analysis method, applied in the field of data processing, can solve the problem that the performance of non-stationary time series is not satisfactory, and achieve the effect of accurate market forecasting
- Summary
- Abstract
- Description
- Claims
- Application Information
AI Technical Summary
Problems solved by technology
Method used
Image
Examples
Embodiment 1
[0056] The invention provides a hedging transaction analysis method based on wavelet analysis, which is suitable for execution in computing equipment. This embodiment is suitable for generating alpha trend graphs and / or beta shock graphs based on wavelet analysis of stock market data, and predicting and trading stock prices based on the alpha trend graphs and / or beta shock graphs.
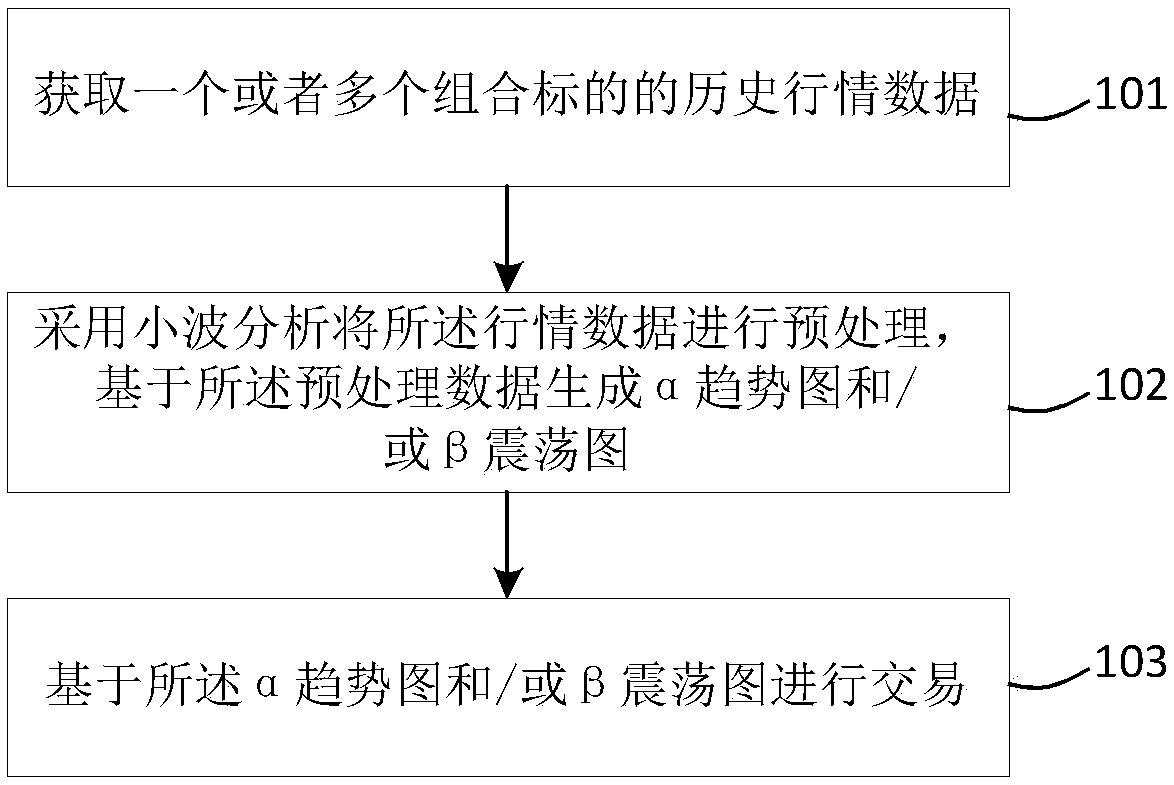
[0057] refer to figure 1 , shows the flow chart of the hedging transaction analysis method based on wavelet analysis of the present invention, including the following steps:
[0058] Step 101, acquiring historical market data of one or more combined targets.
[0059] In this embodiment, the historical time interval for obtaining the market data is preset, and the historical market data of one or more combined targets within the time interval is obtained. The market data includes the highest price, the lowest price, the opening price, the closing price, the average Any group or multiple groups in ...
Embodiment 2
[0081] The present invention also provides a hedging transaction analysis based on wavelet analysis, which is suitable for execution in computing equipment, including the following steps, still refer to figure 1 , shows the flow chart of the hedging transaction analysis method based on wavelet analysis in this embodiment:
[0082] Step 101, acquiring historical market data of one or more combined targets.
[0083] In this embodiment, the extracted market data includes the highest price, the lowest price, the opening price, and the closing price of one or more groups of minute lines, hour lines, daily lines, weekly lines, monthly lines, quarterly lines, and semi-annual lines. One or more of line, year line, etc.
[0084] In a specific embodiment, the closing price data of nearly 160 days is preset and acquired by the user as the analysis object, and the closing price of the target stock on each trading day is extracted as the value at a known moment.
[0085] Because in pract...
Embodiment 3
[0094] This embodiment is another implementation based on the above-mentioned embodiment. In this embodiment, the α trend graph generated by the wavelet decomposition and reconstruction of the above-mentioned embodiment is used to predict the market price of the future cycle, and according to the Predict the market to trade.
[0095] In a specific embodiment, the α value of the next cycle or multiple cycles is predicted by the α trend curve obtained by the wavelet decomposition in the above embodiment for nearly 160 days, and the α value is extrapolated based on the fluctuation range of the β threshold value and the predicted value of α in each cycle The market data of one or more cycles in the future, including one or more groups of opening price, closing price, highest price, lowest price, and average price of one or more cycles in the future; the forecast method includes linear Extrapolation and nonlinear extrapolation methods. In this embodiment, the α trend graph and / or ...
PUM
 Abstract
Description
Claims
Application Information
 - R&D
- Intellectual Property
- Life Sciences
- Materials
- Tech Scout
- Unparalleled Data Quality
- Higher Quality Content
- 60% Fewer Hallucinations
Browse by: Latest US Patents, China's latest patents, Technical Efficacy Thesaurus, Application Domain, Technology Topic, Popular Technical Reports.
© 2025 PatSnap. All rights reserved.Legal|Privacy policy|Modern Slavery Act Transparency Statement|Sitemap|About US| Contact US: help@patsnap.com


