Method and device for constructing visual data tree

A data tree and data technology, applied in the database field, can solve the problem of slow response of data visualization tools, and achieve the effect of improving user experience, efficiency and user experience.

Active Publication Date: 2018-09-11
LENOVO (BEIJING) CO LTD
View PDF7 Cites 4 Cited by
  • Summary
  • Abstract
  • Description
  • Claims
  • Application Information

AI Technical Summary

Problems solved by technology

To solve the problem of slow response between data visualization tools and background data sources

Method used


Image

  • Method and device for constructing visual data tree
  • Method and device for constructing visual data tree
  • Method and device for constructing visual data tree

Examples


Embodiment Construction

[0039] Below, specific embodiments of the present application will be described in detail in conjunction with the accompanying drawings, but it is not intended as a limitation of the present application.

[0040] It should be understood that various modifications may be made to the embodiments disclosed herein. Accordingly, the above description should not be viewed as limiting, but only as exemplifications of embodiments. Those skilled in the art will envision other modifications within the scope and spirit of the application.

[0041] The accompanying drawings, which are incorporated in and constitute a part of this specification, illustrate embodiments of the application and, together with the general description of the application given above and the detailed description of the embodiments given below, serve to explain the embodiments of the application. principle.

[0042] These and other characteristics of the present application will become apparent from the following...


PUM


Abstract

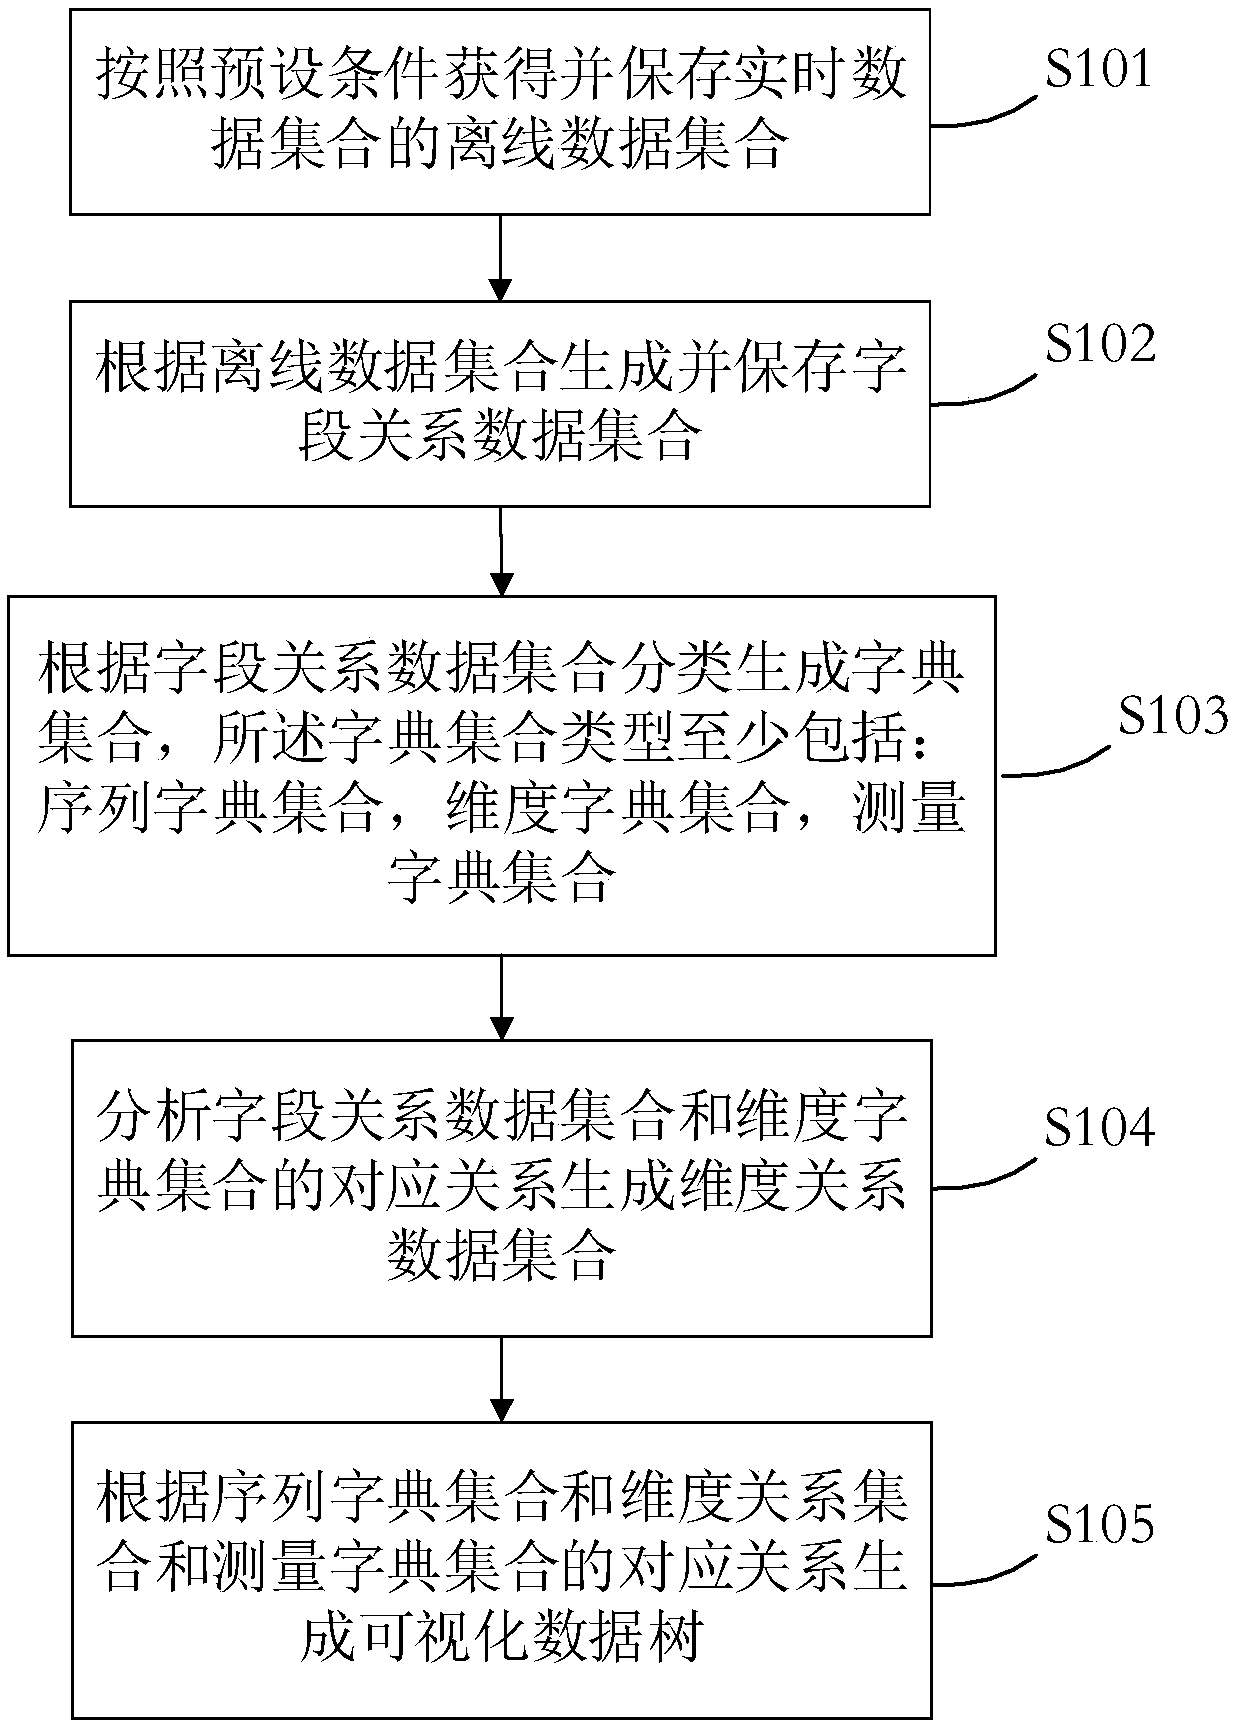
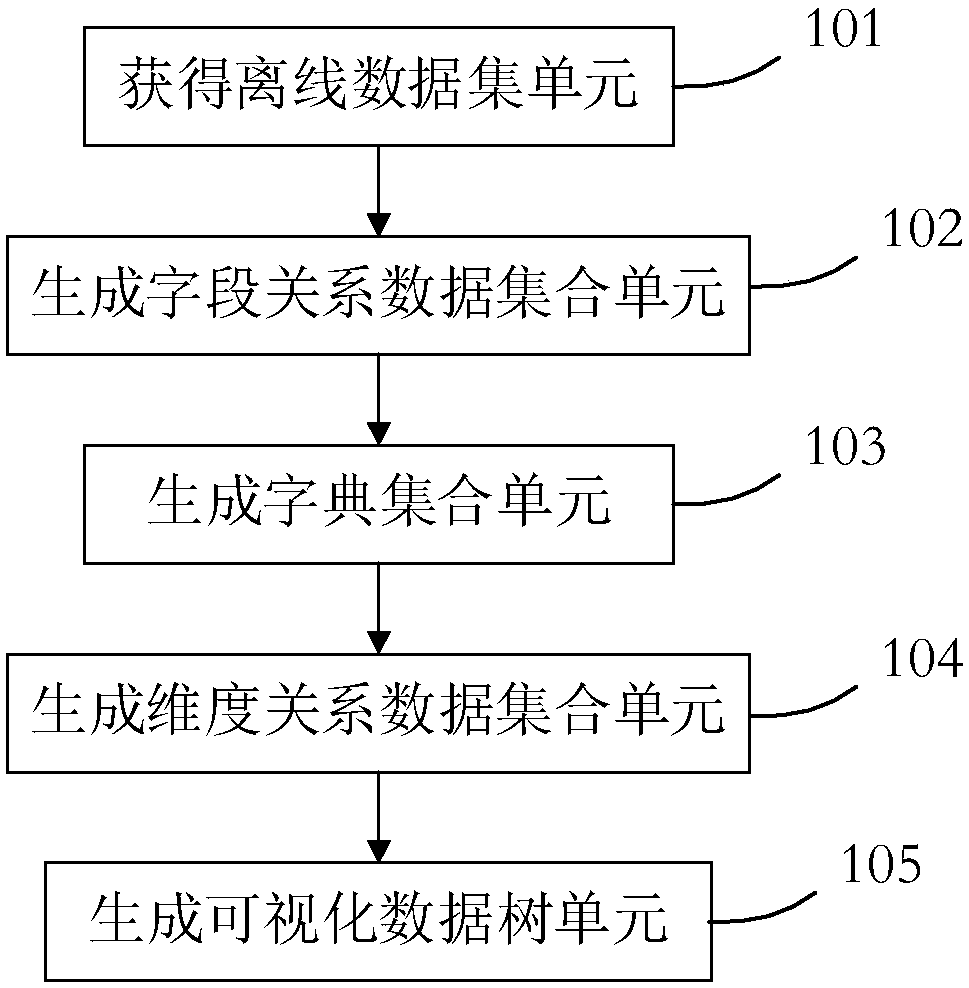
The invention provides a method and device for constructing a visual data tree. The method comprises the steps that off-line data sets of real-time data sets are obtained and stored according to preset conditions; field relationship data sets are generated and stored according to the off-line data sets; dictionary sets are generated and classified according to the field relationship data sets, types of the dictionary sets at least comprise sequence dictionary sets, dimensionality dictionary sets and measuring dictionary sets; a corresponding relationship between the field relationship data sets and the dimensionality dictionary sets is analyzed, and the visual data tree is generated. A multi-dimensional data model is constructed between a data source and a visual tool, pre-calculation is carried out on data, the visual data tree is taken as a data management layer, the efficiency of acquiring data is improved, accessing speed of extracting data required by visualization is especially improved, and user experience of practical using of the visual tool is improved.

Description

technical field [0001] The present application relates to the field of databases, in particular to a method for creating a visualized data tree and a device for creating a visualized data tree. Background technique [0002] Data visualization is the study of the visual representation of data. Among them, the visual representation of this data is defined as: information extracted in a certain summary form, including various attributes and variables of the corresponding information unit. [0003] Data visualization mainly uses graphics, image processing, computer vision, and user interface to visually interpret data through expression, modeling, and the form of three-dimensional, surface, attribute, and animation. Data visualization covers a much broader range of technical approaches than specific technical approaches such as volumetric modeling. [0004] The main purpose of data visualization is to convey and communicate information clearly and effectively by means of graph...

Claims


Application Information

Patent Timeline
IPC IPC(8): G06F17/30
Inventor 胡长建
Owner LENOVO (BEIJING) CO LTD
Why Eureka
Try Eureka