Portable entity statistical chart for financial management case study

A technology of financial management and statistical charts, which is applied in the field of statistical charts, can solve problems such as difficulty in repeated use of statistical charts, inconvenience, poor effect of statistical charts, etc., and achieve the effect of increasing convenience and wide observation range

Pending Publication Date: 2018-10-02
刘凝
View PDF1 Cites 0 Cited by
  • Summary
  • Abstract
  • Description
  • Claims
  • Application Information

AI Technical Summary

Problems solved by technology

[0002] Statistical graphs refer to graphs that use geometric figures or images of specific things and maps to express the quantitative characteristics and quantitative relationships of social and economic phenomena. In order to make the expression of market research data intuitive, vivid, easy to understand, and easy to analyze and compare, you can use Statistical charts are used for market research analysis, forecasting and analysis of the quantitative relationship between phenomena and changes in estrus. Statistical charts play an important role in the compilation and analysis of statistical data and are widely used. They can be used to answer questions about statistical charts in data analysis tests At the same time, it is necessary to examine the intuitive image of the graph and pay attention to checking the data, so as not to be confused by the superficial image. However, most of the statistical graphs in the contemporary era are electronic statistical graphs, which makes it extremely inconvenient to discuss cases.
[0003] The Chinese patent with authorized notification number CN206224852U discloses a multifunctional statistical graph demonstrator, which includes a base, vertically fixed uprights with equal spacing on the upper end of the base, a vertically fixed scale outside one end of the uprights, and a vertically fixed scale on the inside of the uprights. The upper end of the chute is fixed with a beam, and a row of fixed pulleys is fixedly installed on the beam. A moving area is formed between the columns. A dark box is embedded in the base of the moving area. Corrugated plates are installed vertically in the moving area. The left and right sides of the corrugated plates The side is stuck in the chute, the upper end is fixedly connected with the small motor fixedly installed at the rear end of the base through the fixed pulley through the rope, the lower end is folded and installed in the dark box, and a triangular protective cover is fixedly installed between the column and the base. This statistical diagram demonstrates The device has the advantages of semi-automation, saves time and effort, can flexibly adjust the height of the corrugated plate according to specific data, and enhances the flexibility and operability of the present invention. However, when the existing statistical charts are used in many case seminars, Statistical graphs are difficult to reuse, resulting in poor results of statistical graphs

Method used


Image

  • Portable entity statistical chart for financial management case study
  • Portable entity statistical chart for financial management case study
  • Portable entity statistical chart for financial management case study

Examples


Embodiment Construction

[0023] The following will clearly and completely describe the technical solutions in the embodiments of the present invention with reference to the accompanying drawings in the embodiments of the present invention. Obviously, the described embodiments are only some, not all, embodiments of the present invention. Based on the embodiments of the present invention, all other embodiments obtained by persons of ordinary skill in the art without making creative efforts belong to the protection scope of the present invention.

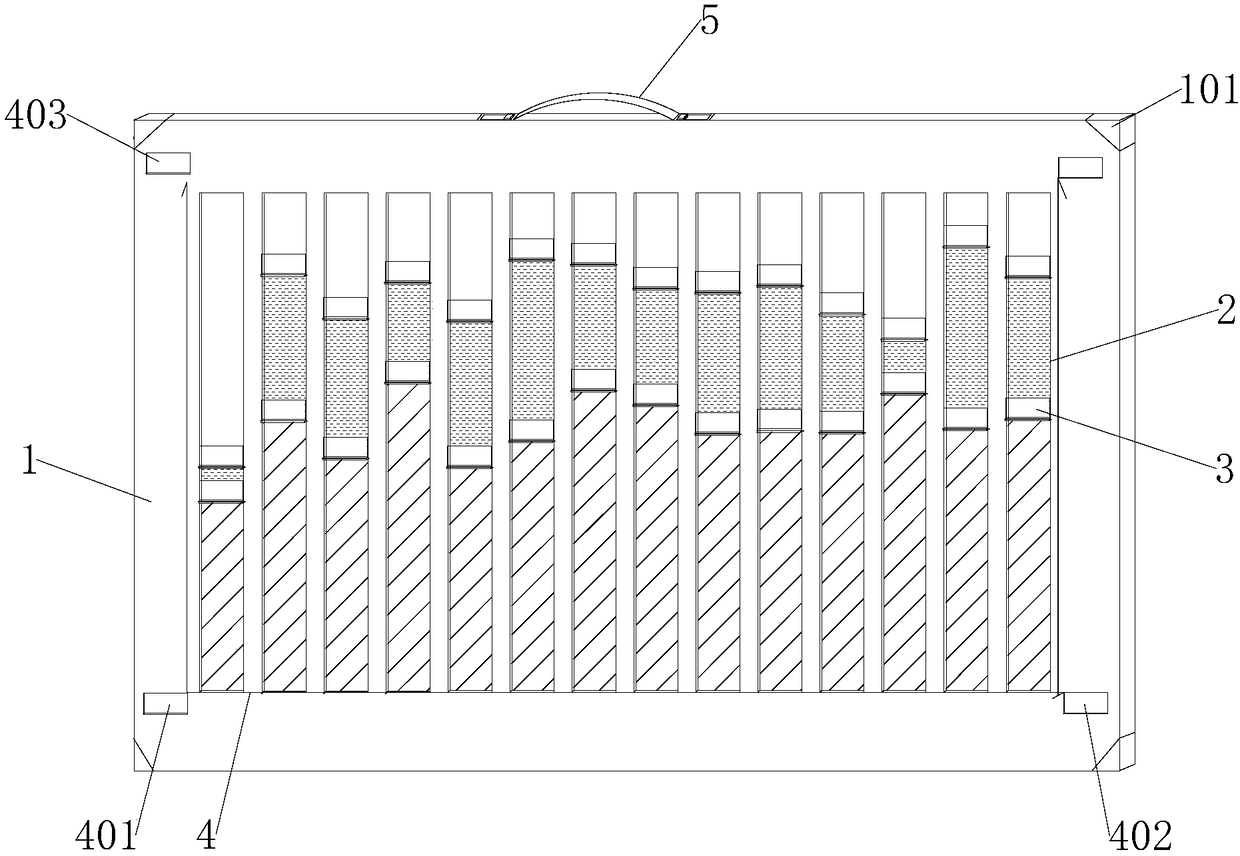
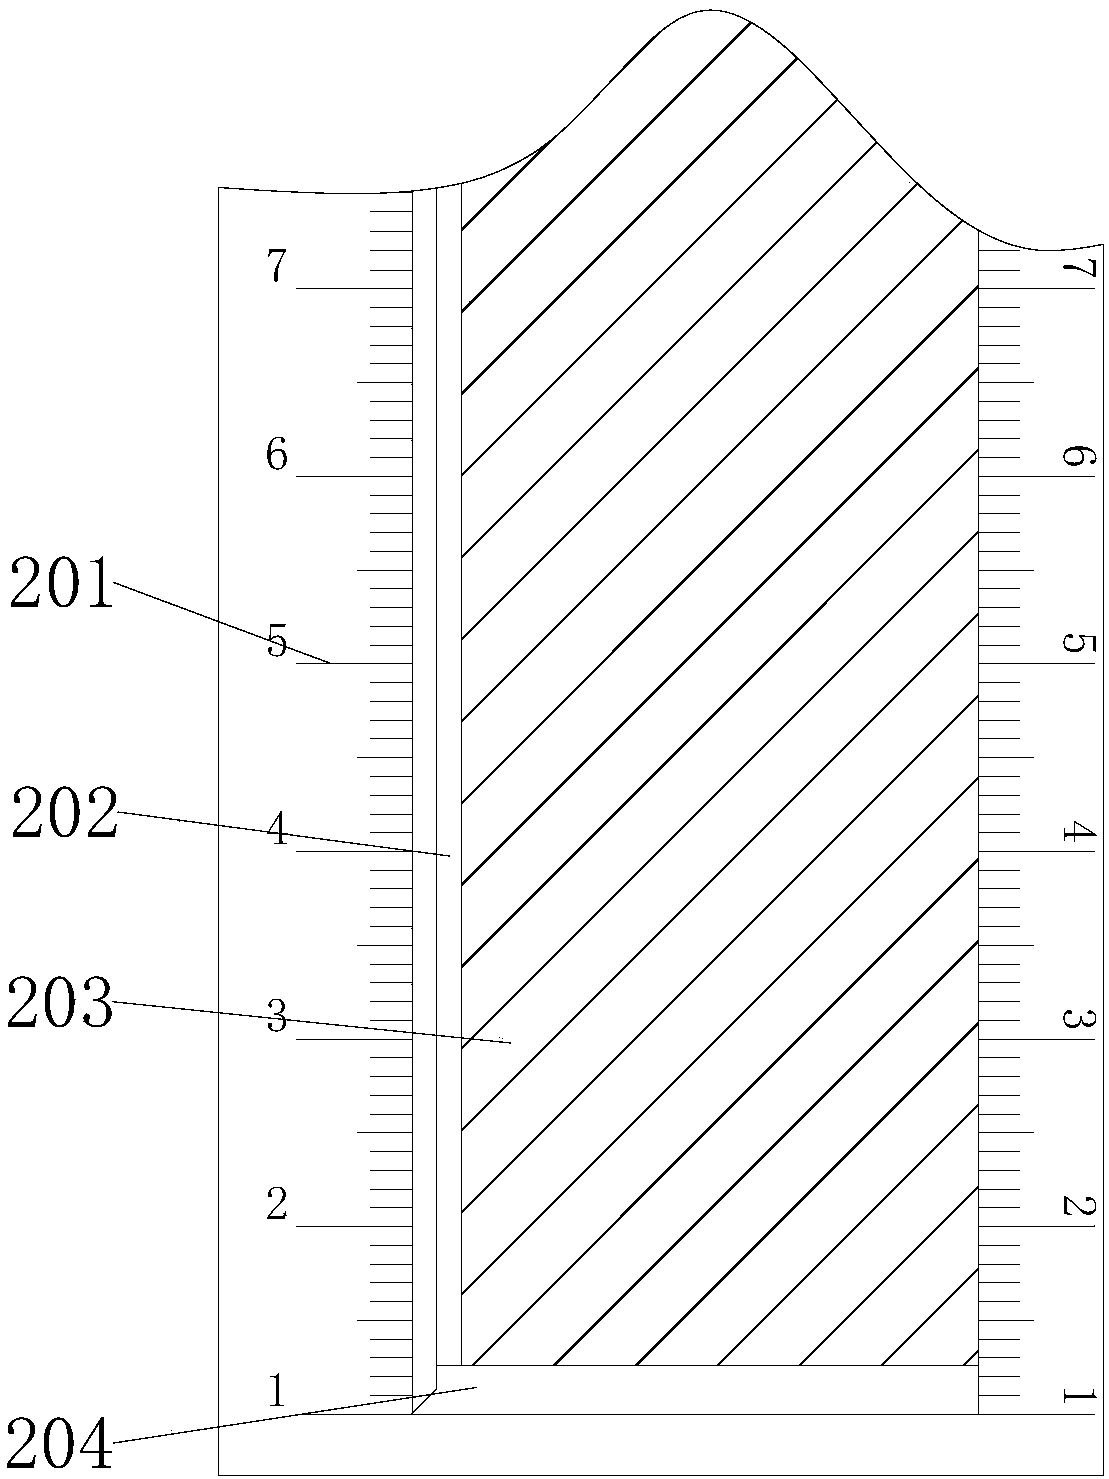
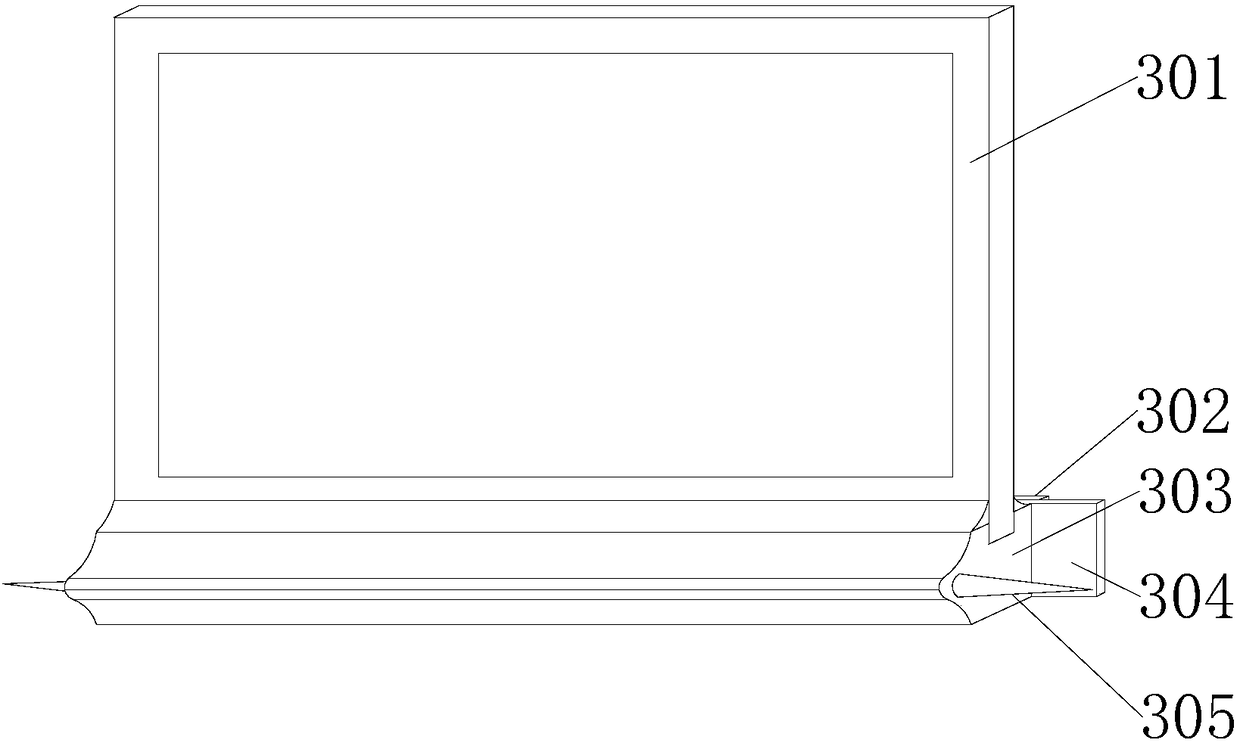
[0024] refer to Figure 1-Figure 4, the present invention provides a technical solution: a portable physical statistical chart for financial management case studies, including a statistical chart main body 1, a shifting device 3 and a rubber pressing plate 302, and the front of the statistical chart main body 1 is fixedly connected with multiple groups Statistical strip 2, multiple sets of statistical strips 2 have a "long rectangular" structure, multiple sets...


PUM


Abstract

The invention discloses a portable entity statistical chart for financial management case study, belongs to the field of statistical graphs. The technical points of the invention comprises: a statistical chart main body, displacement devices and rubber pressure plates; and a front surface of the statistical chart main body is fixedly connected with multiple sets of statistical bars. The portable entity statistical chart for financial management case study adopts a labeling method, a user pastes corresponding labels on outer walls of labeling places, and the problem that the statistical chart is difficult to reuse in multiple case seminars can be solved. The combination of sealed cellophane, color-changing plates and rubber pressure plates can effectively change the color of the color-changing plates to ensure the identification of the statistical chart, thus increasing the convenience of the entity statistical chart. The fastening groove and a portable brace are provided, the fasteninggroove can be hanged in a hook so as to make the observation range of the entity statistical chart wider; and at the same time, the entity statistical chart is convenient to carry, thereby increasingthe convenience of the entity chart.

Description

technical field [0001] The invention relates to the field of statistical graphs, in particular to a portable entity statistical graph used for financial management case studies. Background technique [0002] Statistical graphs refer to graphs that use geometric figures or images of specific things and maps to express the quantitative characteristics and quantitative relationships of social and economic phenomena. In order to make the expression of market research data intuitive, vivid, easy to understand, and easy to analyze and compare, you can use Statistical charts are used for market research analysis, forecasting and analysis of the quantitative relationship between phenomena and changes in estrus. Statistical charts play an important role in the compilation and analysis of statistical data and are widely used. They can be used to answer questions about statistical charts in data analysis tests At the same time, it is necessary to examine the intuitive image of the grap...

Claims


Application Information

Patent Timeline
Patent Type & Authority Applications(China)
IPC IPC(8): G09B29/00
CPCG09B29/00
Inventor 刘凝
Owner 刘凝
Why Eureka
Try Eureka