Method for detecting underground pipe gallery
An underground pipe gallery and detection method technology, applied in the field of engineering geophysical exploration, can solve the problems of being easily affected by surrounding human activities, high-density electrical methods being easily affected by the underground environment, poor detection effect, etc.
- Summary
- Abstract
- Description
- Claims
- Application Information
AI Technical Summary
Problems solved by technology
Method used
Image

Examples
Embodiment Construction
[0041] Below in conjunction with accompanying drawing and specific embodiment the present invention is described in further detail:
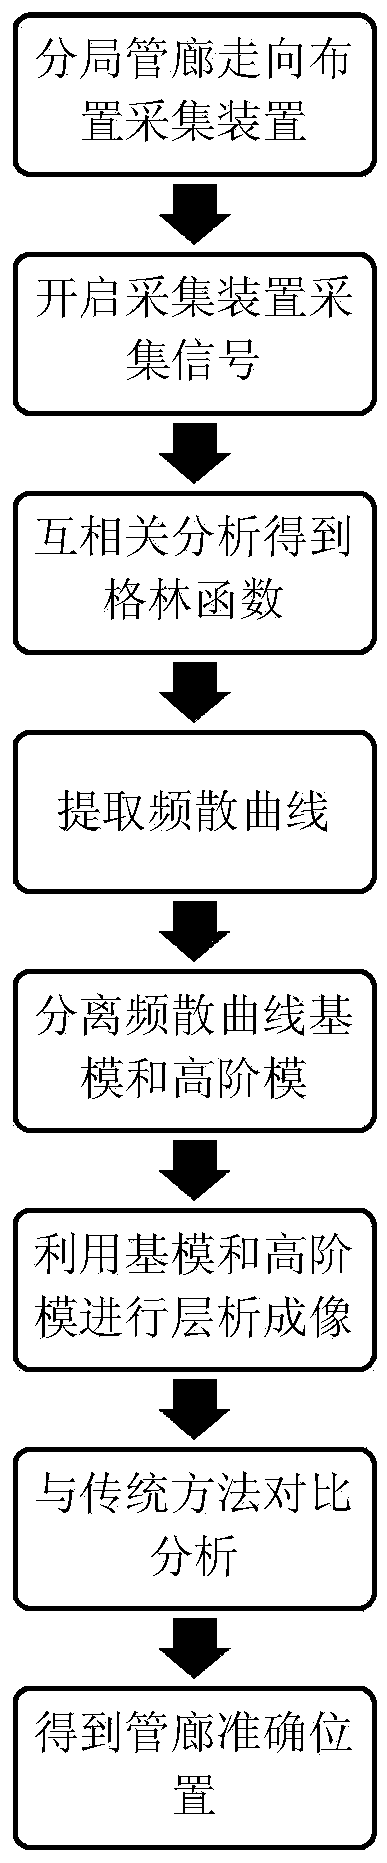
[0042] A method for detecting urban underground utility corridors, such as Figure 1~5 As shown, it includes the following steps:
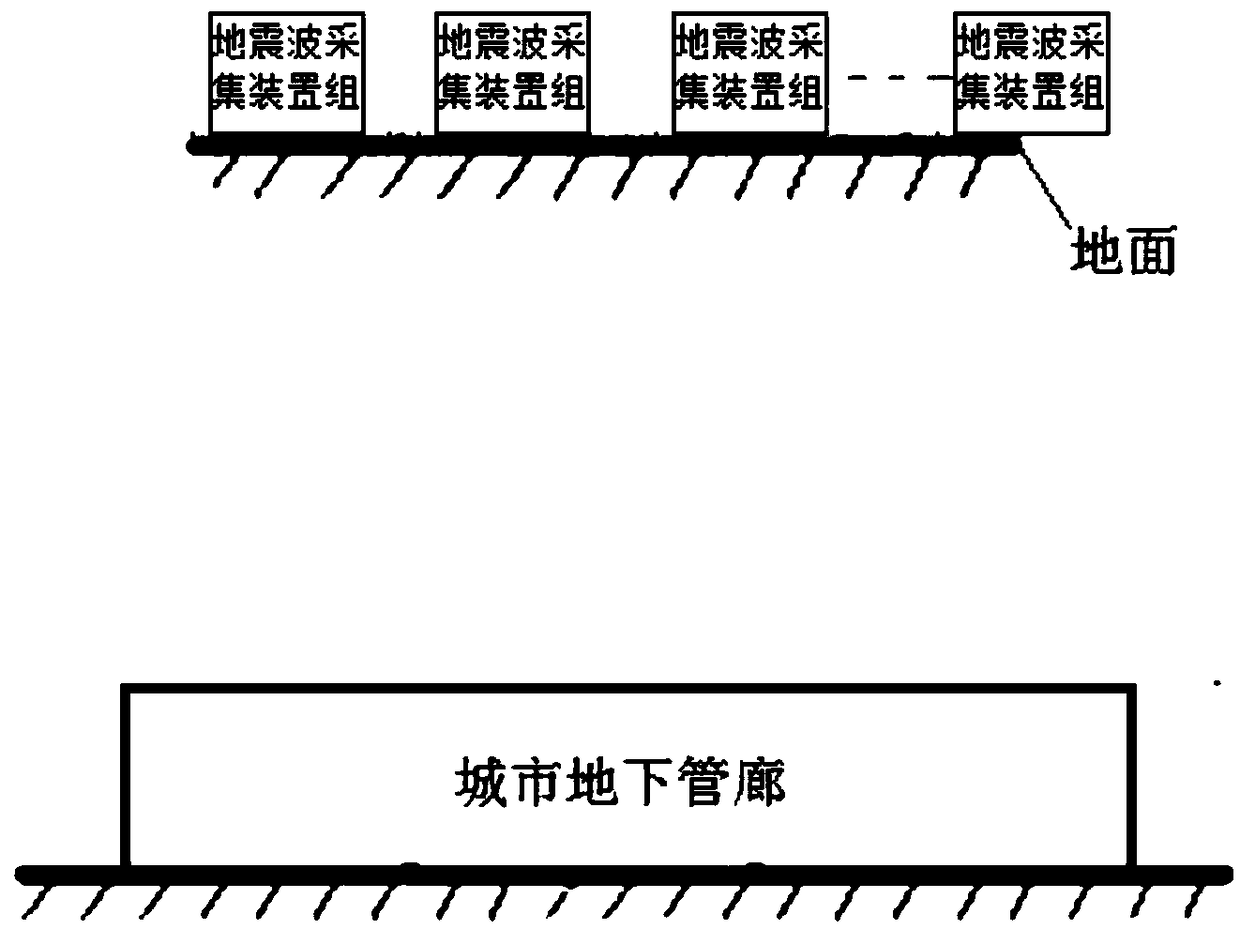
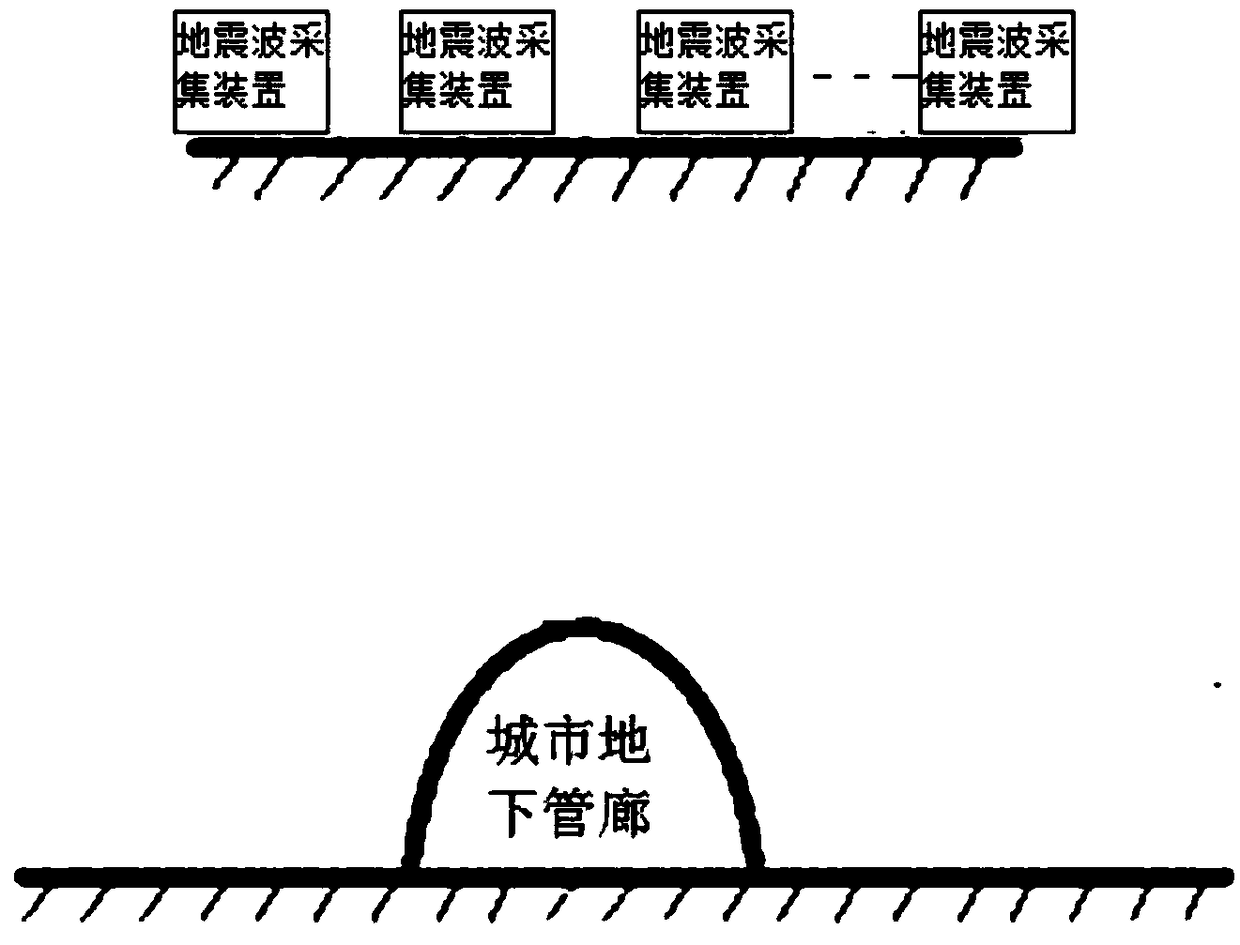
[0043] Step 1: According to the existing urban underground pipe gallery information, determine the trend direction of the urban underground pipe gallery to be detected, and arrange multiple seismic wave acquisition device groups evenly along the direction of the pipe gallery on the ground above the area to be detected in the urban underground pipe gallery, The setting position of each seismic wave acquisition device group is regarded as a collection area, and multiple seismic wave acquisition devices in each seismic wave acquisition device group are evenly arranged on the ground along the vertical direction of the pipe corridor, and each seismic wave acquisition device in the seismic wave acquisition device group T...
PUM
 Abstract
Description
Claims
Application Information
 - Generate Ideas
- Intellectual Property
- Life Sciences
- Materials
- Tech Scout
- Unparalleled Data Quality
- Higher Quality Content
- 60% Fewer Hallucinations
Browse by: Latest US Patents, China's latest patents, Technical Efficacy Thesaurus, Application Domain, Technology Topic, Popular Technical Reports.
© 2025 PatSnap. All rights reserved.Legal|Privacy policy|Modern Slavery Act Transparency Statement|Sitemap|About US| Contact US: help@patsnap.com