
A method for traceability analysis of product quality characteristic errors based on multi-source perception

An analysis method and product quality technology, which is applied in the field of product quality characteristic error traceability analysis based on multi-source perception, can solve the problems that human subjective factors account for a large proportion, cannot scientifically and effectively reflect the relationship between processes, and the source of error is difficult, etc. Achieve the effect of reducing the influence of human subjective factors

Active Publication Date: 2020-12-01
电科北方半导体科技(山东)有限公司
View PDF5 Cites 0 Cited by
  • Summary
  • Abstract
  • Description
  • Claims
  • Application Information

AI Technical Summary

Problems solved by technology

In the prior art, the use of T 2 When the control chart monitors the actual processing process, it often occurs that the individual processes are monitored without loss of control, but the entire process is monitored but the phenomenon of loss of control occurs, which makes it difficult to locate the error source accurately; and in actual situations, The causal relationship network between processing procedures is mostly established based on process specification documents, expert evaluation, etc. Human subjective factors account for a large proportion, and the established network relationship often cannot scientifically and effectively reflect the relationship between processes

Method used


Image

  • A method for traceability analysis of product quality characteristic errors based on multi-source perception
  • A method for traceability analysis of product quality characteristic errors based on multi-source perception
  • A method for traceability analysis of product quality characteristic errors based on multi-source perception

Examples


specific Embodiment

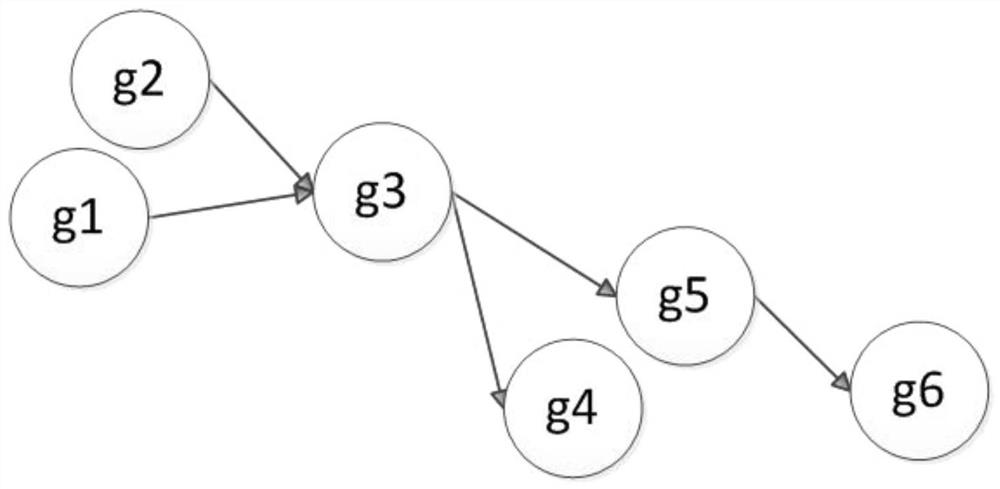
[0087] Taking part of the processing process of xx thin-walled cylinder as an example, since the processing process of thin-walled cylinder is a complicated multi-process process, this case intercepts six consecutive processes in the processing process of thin-walled cylinder, namely rough turning of the end face, rough turning of the outer circle, Rough turning inner circle, rough milling square hole, rough milling round hole and rough milling elongated hole, here use g respectively 1 , g 2 ,...,g 6 Express, and use external sensors to collect acceleration signals and sound pressure signals in three directions in real time. Take the probability of committing Type I error α=0.05. Using historical data, the absolute value matrix of the correlation coefficient ρ among the six processes is obtained as shown in the following table:

[0088] Table 1 Correlation coefficient table between processes

[0089]

[0090] According to the constraint of |ρ|≥0.6, the causal relationsh...


PUM


Abstract

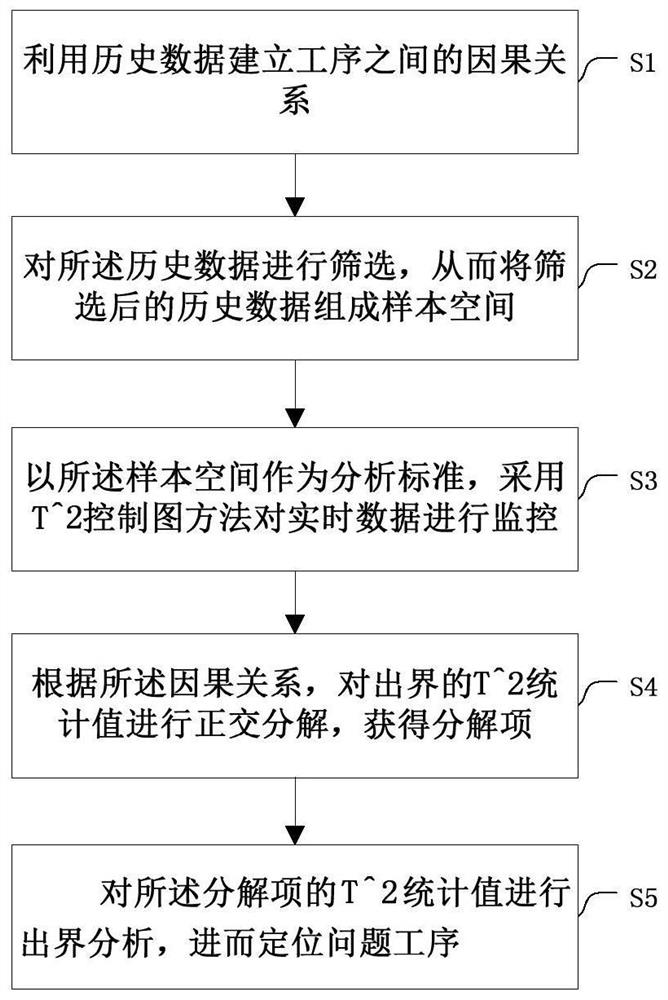
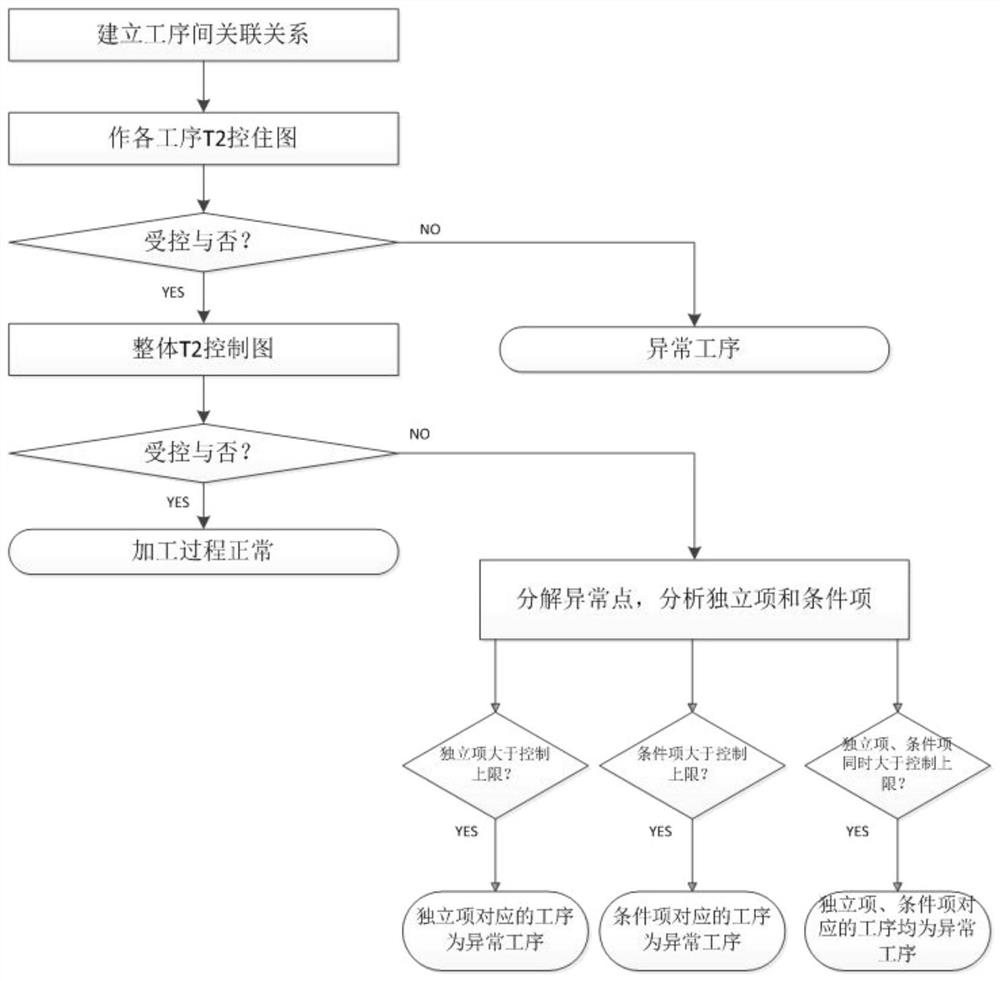
The invention relates to a product quality characteristic error traceability analysis method based on multi-source perception, which comprises the following steps of establishing causal relationship between processes by using historical data; screening the historical data so as to compose the screened historical data into a sample space; taking the sample space as the analysis standard, and monitoring the real-time data by a T2 control chart method; performing the orthogonal decomposition on the outbound T2 value according to the causality to obtain decomposition terms; carrying out the out-of-bounds analysis on the T2 statistic value of the decomposition term, and locating the problem procedure. The method of the invention utilizes a large amount of multiple historical data to complete the analysis of the correlation relation between the processes, and reduces the influence brought by the subjective factors. The out-of-bounds T2 value is decomposed according to the relationship directed graph obtained from the analysis process of the relationship between processes, so as to determine the problem process, achieve the accurate grasp of the process, and then achieve the purpose of problem traceability.

Description

technical field [0001] This method involves the fields of process analysis, model static and / or dynamic analysis, and in particular relates to a method for traceability analysis of product quality characteristic errors based on multi-source perception, which is used for traceability of process problems. Background technique [0002] The concept of statistical process control (Statistical Process Control) originated in the 1920s, with the control chart proposed by Dr. Shewhart of the United States as the main symbol. Since this concept was put forward, it has been widely used in industry and service industry. With the help of mathematical statistics knowledge, it analyzes and monitors the fluctuations in the production process, and proposes preventive measures, so that the production process is in a controlled state that is only affected by random factors. Control charts are the most important tools in statistical process control. According to different purposes, they can be...

Claims


Application Information

Patent Timeline
Patent Type & Authority Patents(China)
IPC IPC(8): G06Q10/06
CPCG06Q10/06395
Inventor 戴伟吴孟遥王美清
Owner 电科北方半导体科技(山东)有限公司
Learn More