Visual analysis method and system for trajectory data based on big data environment

A trajectory data and analysis method technology, applied in the field of visual analysis of trajectory data, can solve the problems of unfavorable overall analysis and finding abnormal points, and achieve the effect of high precision and improved accuracy

Inactive Publication Date: 2019-03-15
WUHAN UNIV OF TECH
View PDF0 Cites 1 Cited by
  • Summary
  • Abstract
  • Description
  • Claims
  • Application Information

AI Technical Summary

Problems solved by technology

[0003] Traditional visual display tools include reports or simple charts. Data is mostly expressed through charts from a one-dimensional perspective. There is no visual expression from the fusion of features from multiple dimensions, which is not conducive to overall analysis and finding outliers

Method used


Image

  • Visual analysis method and system for trajectory data based on big data environment
  • Visual analysis method and system for trajectory data based on big data environment

Examples


Embodiment

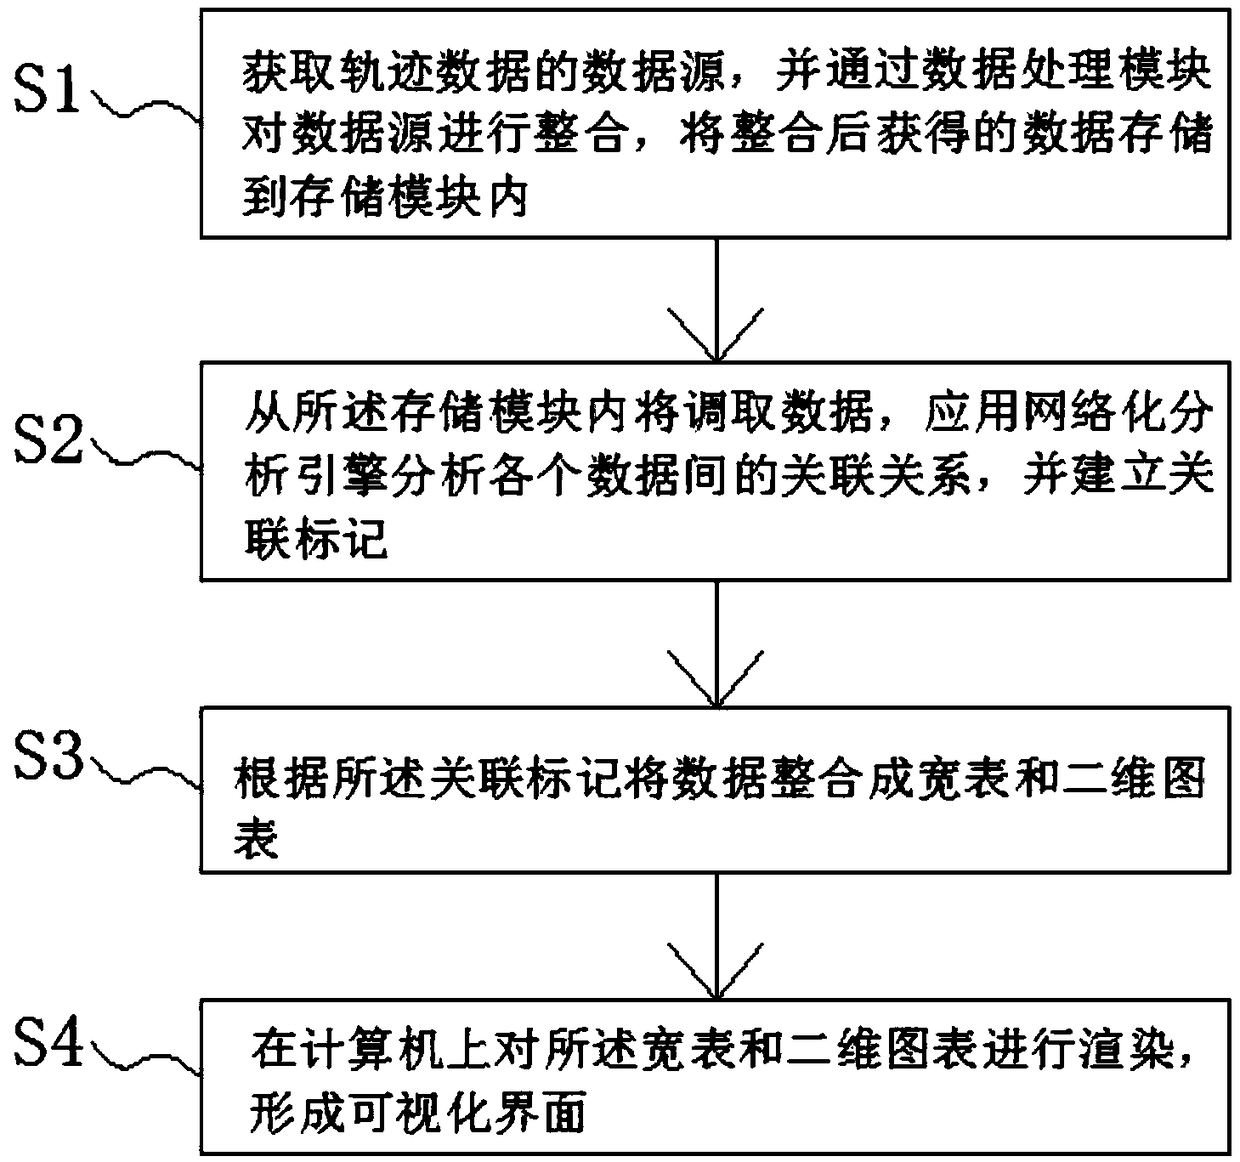
[0028] The visual analysis method of trajectory data based on big data environment includes the following steps:

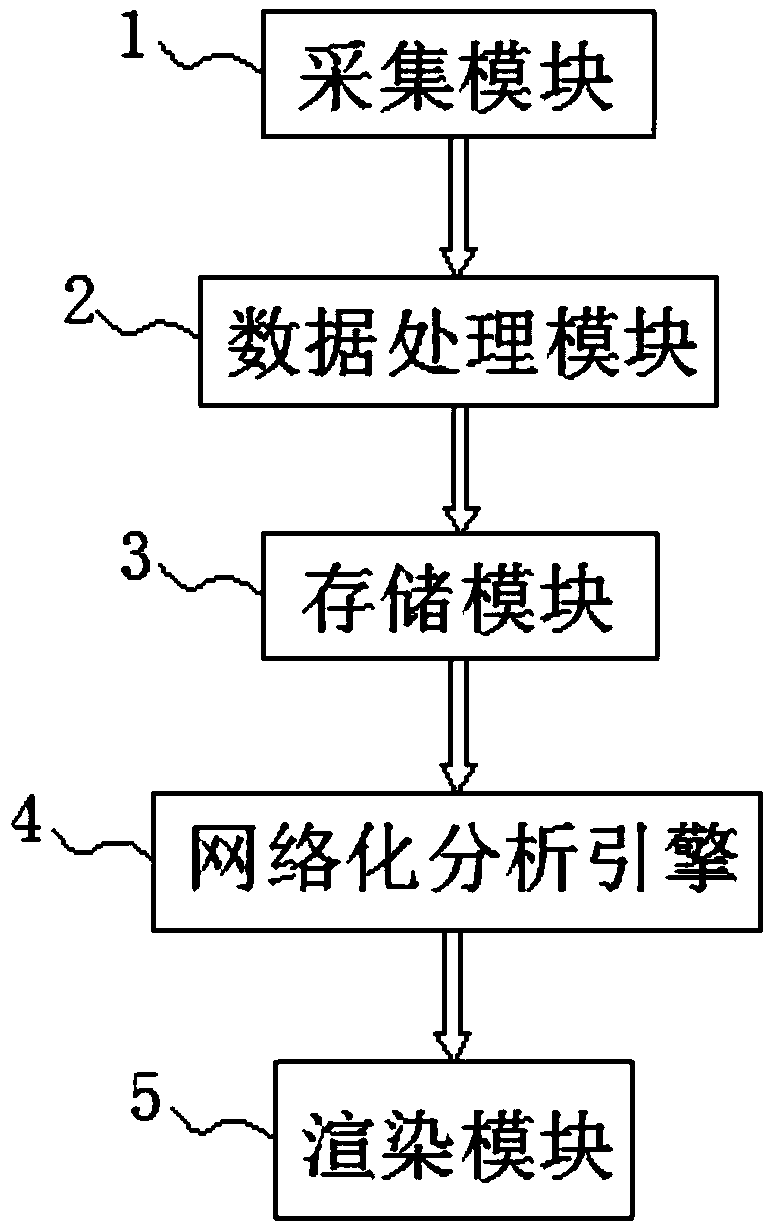
[0029] S1. Obtain the data source of the trajectory data, integrate the data source through the data processing module 2, and store the data obtained after the integration in the storage module 3;

[0030] S2. The data will be retrieved from the storage module 3, the network analysis engine 4 is applied to analyze the association relationship between the various data, and the association mark is established;

[0031] S3. Integrate data into a wide table and a two-dimensional chart according to the associated mark;

[0032] S4. Render the wide table and the two-dimensional chart on the computer to form a visual interface.

[0033] In the step S1, the data source is data information obtained by sampling the movement process of one or more moving objects by the acquisition module 1, and the data information includes the position of the sampling point, the sampling time and the...


PUM


Abstract

The invention discloses a visualization analysis method for trajectory data based on a big data environment, in particular comprising the following steps: S1, acquiring a data source of the trajectorydata, integrating the data source through a data processing module, and storing the integrated data into a storage module; S2, retrieving the data from the storage module, applying a network analysisengine to analyze the association relationship among the data, and establishing an association mark; 3, integrate that data into a wide table and a two-dimensional chart according to the associationmark; S4, rendering the wide table and the two-dimensional chart on the computer to form a visual interface. The invention combs the massive and complex data, starts from different analysis themes, and displays them in a concise, efficient and intuitive manner. The data processing module performs multistage filtering and multistage amplification on the data collected by the acquisition module, sothat the precision of data information reception is high and the accuracy is improved.

Description

Technical field [0001] The invention belongs to the technical field of visual analysis of trajectory data, and specifically relates to a visual analysis method of trajectory data based on a big data environment. The invention also relates to a visual analysis system of trajectory data based on a big data environment. Background technique [0002] Big data is an innovative force. For generating massive amounts of data, how to make these massive amounts of data easier to understand, analyze problems from these data, and transform massive amounts of complex data into visual graphics is the most effective way ; [0003] Traditional visual display tools include reports or simple charts. Data is mostly expressed through charts from a one-dimensional perspective. There is no visual expression from the feature integration of multiple dimensions, which is not conducive to overall analysis and discovery of abnormal points. [0004] To this end, we propose a visual analysis method and system f...

Claims


Application Information

Patent Timeline
Patent Type & Authority Applications(China)
IPC IPC(8): G06F16/904G06K17/00
CPCG06K17/0029
Inventor 白扬房和佳孙宏韬李淑圣张蕊
Owner WUHAN UNIV OF TECH
Why Eureka
Try Eureka