Dynamic nonlinear PLS soft sensor modeling method based on Gaussian process regression
A technology of Gaussian process regression and modeling method, which is applied in the field of soft measurement of effluent indicators in the wastewater treatment process to achieve the effect of model prediction ability
- Summary
- Abstract
- Description
- Claims
- Application Information
AI Technical Summary
Benefits of technology
Problems solved by technology
Method used
Image
Examples
Embodiment 1
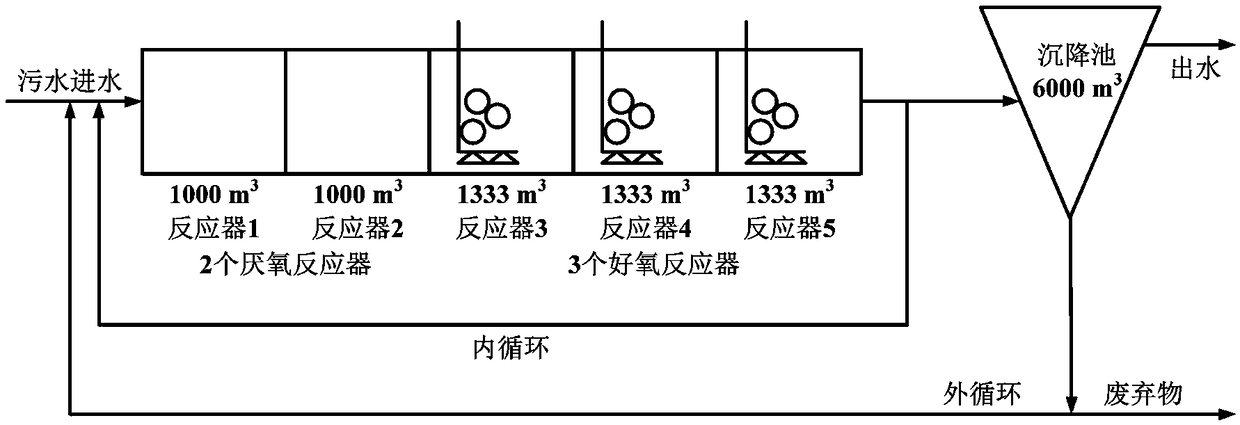
[0190] Taking the wastewater treatment simulation benchmark model 1 (Benchmark Simulation Model 1, BSM1) as an example, the wastewater treatment process is as follows: image 3 As shown, it includes 2 anaerobic reactions, 3 aerobic reactions, 1 settling tank, 1 internal circulation and 1 external circulation.
[0191] The types of data input to the simulation platform correspond to three different weather conditions: dry weather, rainy weather, and stormy weather. Each weather condition corresponds to 14 days of data input, and the data is sampled every 15 minutes on average. This implementation case uses data under dry weather, including 8 input variables and 2 output variables. The input variables include influent ammonia concentration (S NHin ), inflow flow (Q in ), the nitrate concentration in the second reactor (S NO2 ), the fourth reactor total suspended solids concentration (T SS4 ), dissolved oxygen in the third and fourth reactors (S O3 and S O4 ), the oxygen co...
Embodiment 2
[0210] Taking the nutrient removal process of a wastewater treatment plant as an example, such as Figure 6 As shown, the wastewater treatment process includes four reaction processes including denitrification, anaerobic reaction, anaerobic reaction and aerobic reaction, two precipitators before and after, a sludge thickening tank and a dehydration system. The wastewater treatment data used for soft-sensing modeling contains 6 input variables and 1 output variable, and the input variables include the influent flow rate (F in ), total suspended solids in water (TSS in ), biochemical oxygen demand (BOD in ), influent chemical oxygen demand (COD in ), total nitrogen in the water (TN in ) and total phosphorus (TP in ) content, the output variable is the effluent chemical oxygen demand (COD eff ). The sampling of the data comes from the daily average of each variable, and the total number of samples is 346.
[0211] The above algorithm is simulated by MATLAB and combined wit...
PUM
 Abstract
Description
Claims
Application Information
 - R&D
- Intellectual Property
- Life Sciences
- Materials
- Tech Scout
- Unparalleled Data Quality
- Higher Quality Content
- 60% Fewer Hallucinations
Browse by: Latest US Patents, China's latest patents, Technical Efficacy Thesaurus, Application Domain, Technology Topic, Popular Technical Reports.
© 2025 PatSnap. All rights reserved.Legal|Privacy policy|Modern Slavery Act Transparency Statement|Sitemap|About US| Contact US: help@patsnap.com


