Method and a device for generating a data chart by utilizing JavaScript

A data chart and chart technology, applied in image data processing, 3D image processing, creating/generating source code, etc., can solve problems such as image rendering operations cannot be executed normally, and achieve the effect of reducing pressure and data traffic consumption.

Inactive Publication Date: 2019-05-10
天津数观科技有限公司
View PDF3 Cites 0 Cited by
  • Summary
  • Abstract
  • Description
  • Claims
  • Application Information

AI Technical Summary

Problems solved by technology

[0003] In existing applications, image rendering is usually done on the server side. When the network is normal, there is no problem. If the user's environment does not have network, the image rendering operation cannot be performed normally at all.

Method used


Image

  • Method and a device for generating a data chart by utilizing JavaScript
  • Method and a device for generating a data chart by utilizing JavaScript

Examples


Embodiment Construction

[0017] Below, the structure and working principle of the present invention will be further described in conjunction with the accompanying drawings.

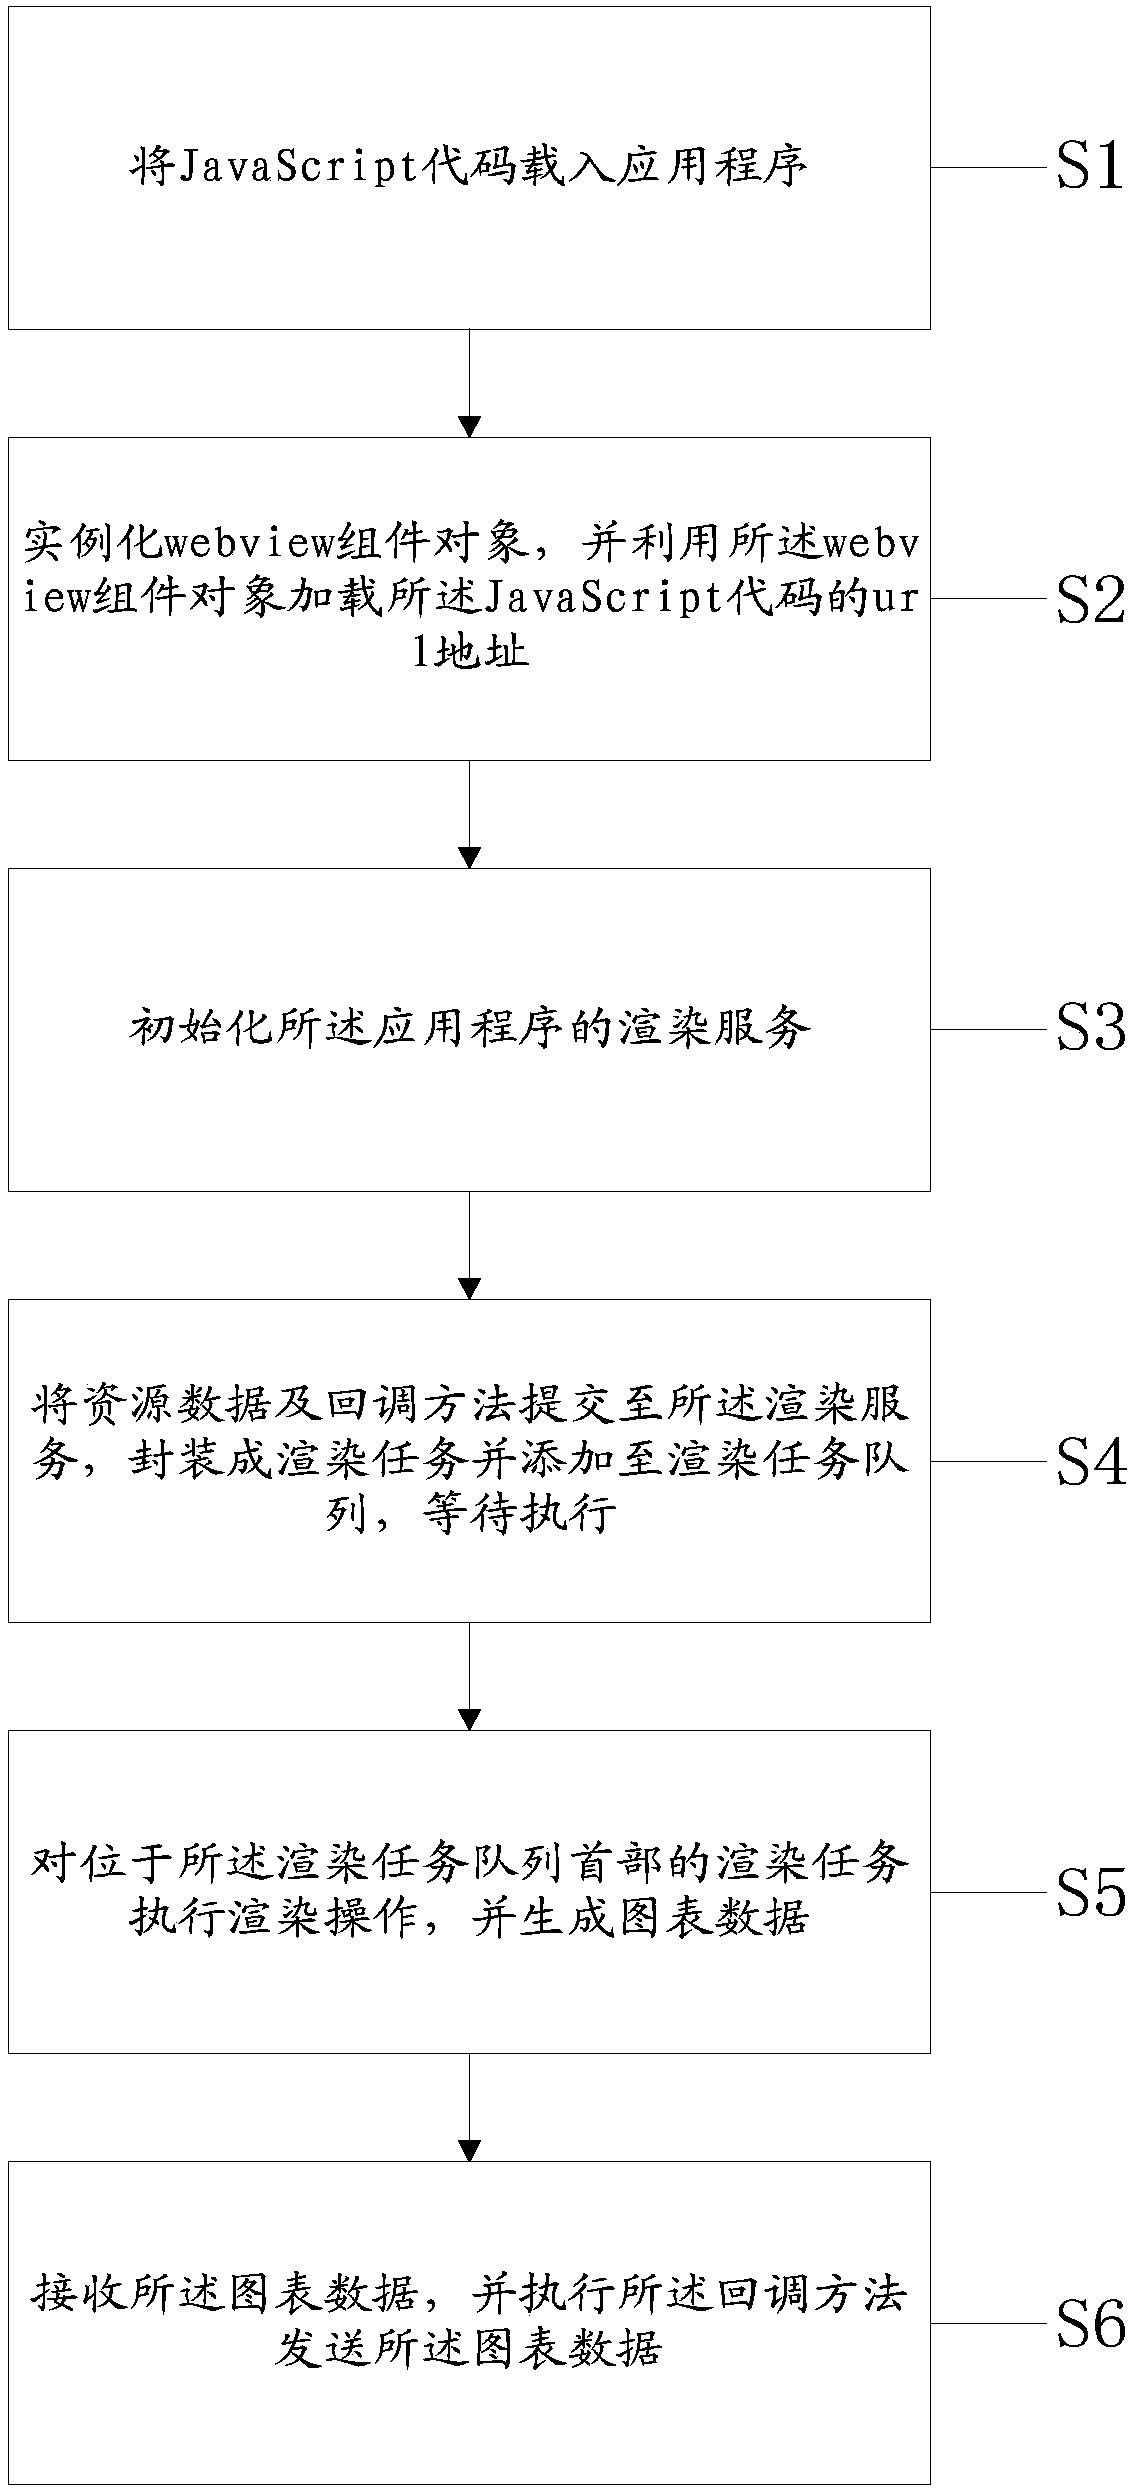
[0018] Such as figure 1 as shown, figure 1 It is a schematic flow chart of a method for generating data graphs using JavaScript according to the present invention, and the method for generating data graphs using JavaScript specifically includes the following steps:

[0019] Step one S1, JavaScript code is loaded into application program; In preferred embodiment of the present invention, described application program is the application program based on IOS operating system; Meanwhile, described application program is also not limited to IOS operating system, can realize Cross-platform, supports any platform that supports Javascript code running, including windows, Android, etc.; usually, in actual operation, Javascript code and resource data will be embedded in native code, and the execution allows related resources to be loaded ...


PUM


Abstract

The invention discloses a method and a device for generating a data chart by utilizing JavaScript. The method comprises the following steps: step 1, loading a JavaScript code into an application program; step 2, instantiating a webview component object, and loading the url address of the JavaScript code by using the webview component object; step 3, initializing a rendering service of the application program; 4, submitting the resource data and the callback method to the rendering service, packaging the resource data and the callback method into rendering tasks, adding the rendering tasks to arendering task queue, and waiting for execution; fifthly, rendering operation is executed on the rendering task located at the head of the rendering task queue, and chart data are generated; and 6, receiving the chart data, and executing the callback method to send the chart data. The method and the device for generating the data chart by using the JavaScript have the characteristics of cross platform and high compatibility, and can normally render pictures in a network-free environment.

Description

technical field [0001] The invention relates to the field of generating data graphs, in particular to a method and device for generating data graphs using JavaScript. Background technique [0002] At present, in the application of data visualization, it usually spans multiple platforms, browsers, apps, etc., in order to ensure that the data charts generated in the application are consistent with the browser platform in terms of format and style, and at the same time improve code reuse. , reduce the development cycle and cost, take advantage of the high support for Javascript in the application, embed (or download through the network) the Javascript chart rendering engine in the application, and call the relevant functions provided by the Javascript rendering engine through the Navtive code of the application, Generate pictures of data charts, and support the customization of the picture format, which requires the corresponding Javascript library to support. [0003] In exis...

Claims


Application Information

Patent Timeline
IPC IPC(8): G06F8/34G06T15/20
Inventor 赵文浩
Owner 天津数观科技有限公司
Why Eureka
Try Eureka