A soil detection result graph display and automatic interpretation method

A soil detection and soil technology, applied in soil material testing, material inspection products, digital data information retrieval, etc., can solve the problem that non-professionals cannot understand

Active Publication Date: 2019-05-10
GUANGXI ZHUANG AUTONOMOUS REGION ACAD OF AGRI SCI
View PDF3 Cites 0 Cited by
  • Summary
  • Abstract
  • Description
  • Claims
  • Application Information

AI Technical Summary

Problems solved by technology

[0003] At present, the results of soil testing in my country are fed back to users in the form of digital reports. After users get the results of soil testing, they need to find professionals to explain the results of soil testing. Professionals often have a strong subjective willingness to explain, so take The same soil test result will be interpreted differently by different professionals. Non-professionals often cannot understand the soil test results, and will not use the soil test results to guide fertilization

Method used


Image

  • A soil detection result graph display and automatic interpretation method
  • A soil detection result graph display and automatic interpretation method
  • A soil detection result graph display and automatic interpretation method

Examples


Embodiment Construction

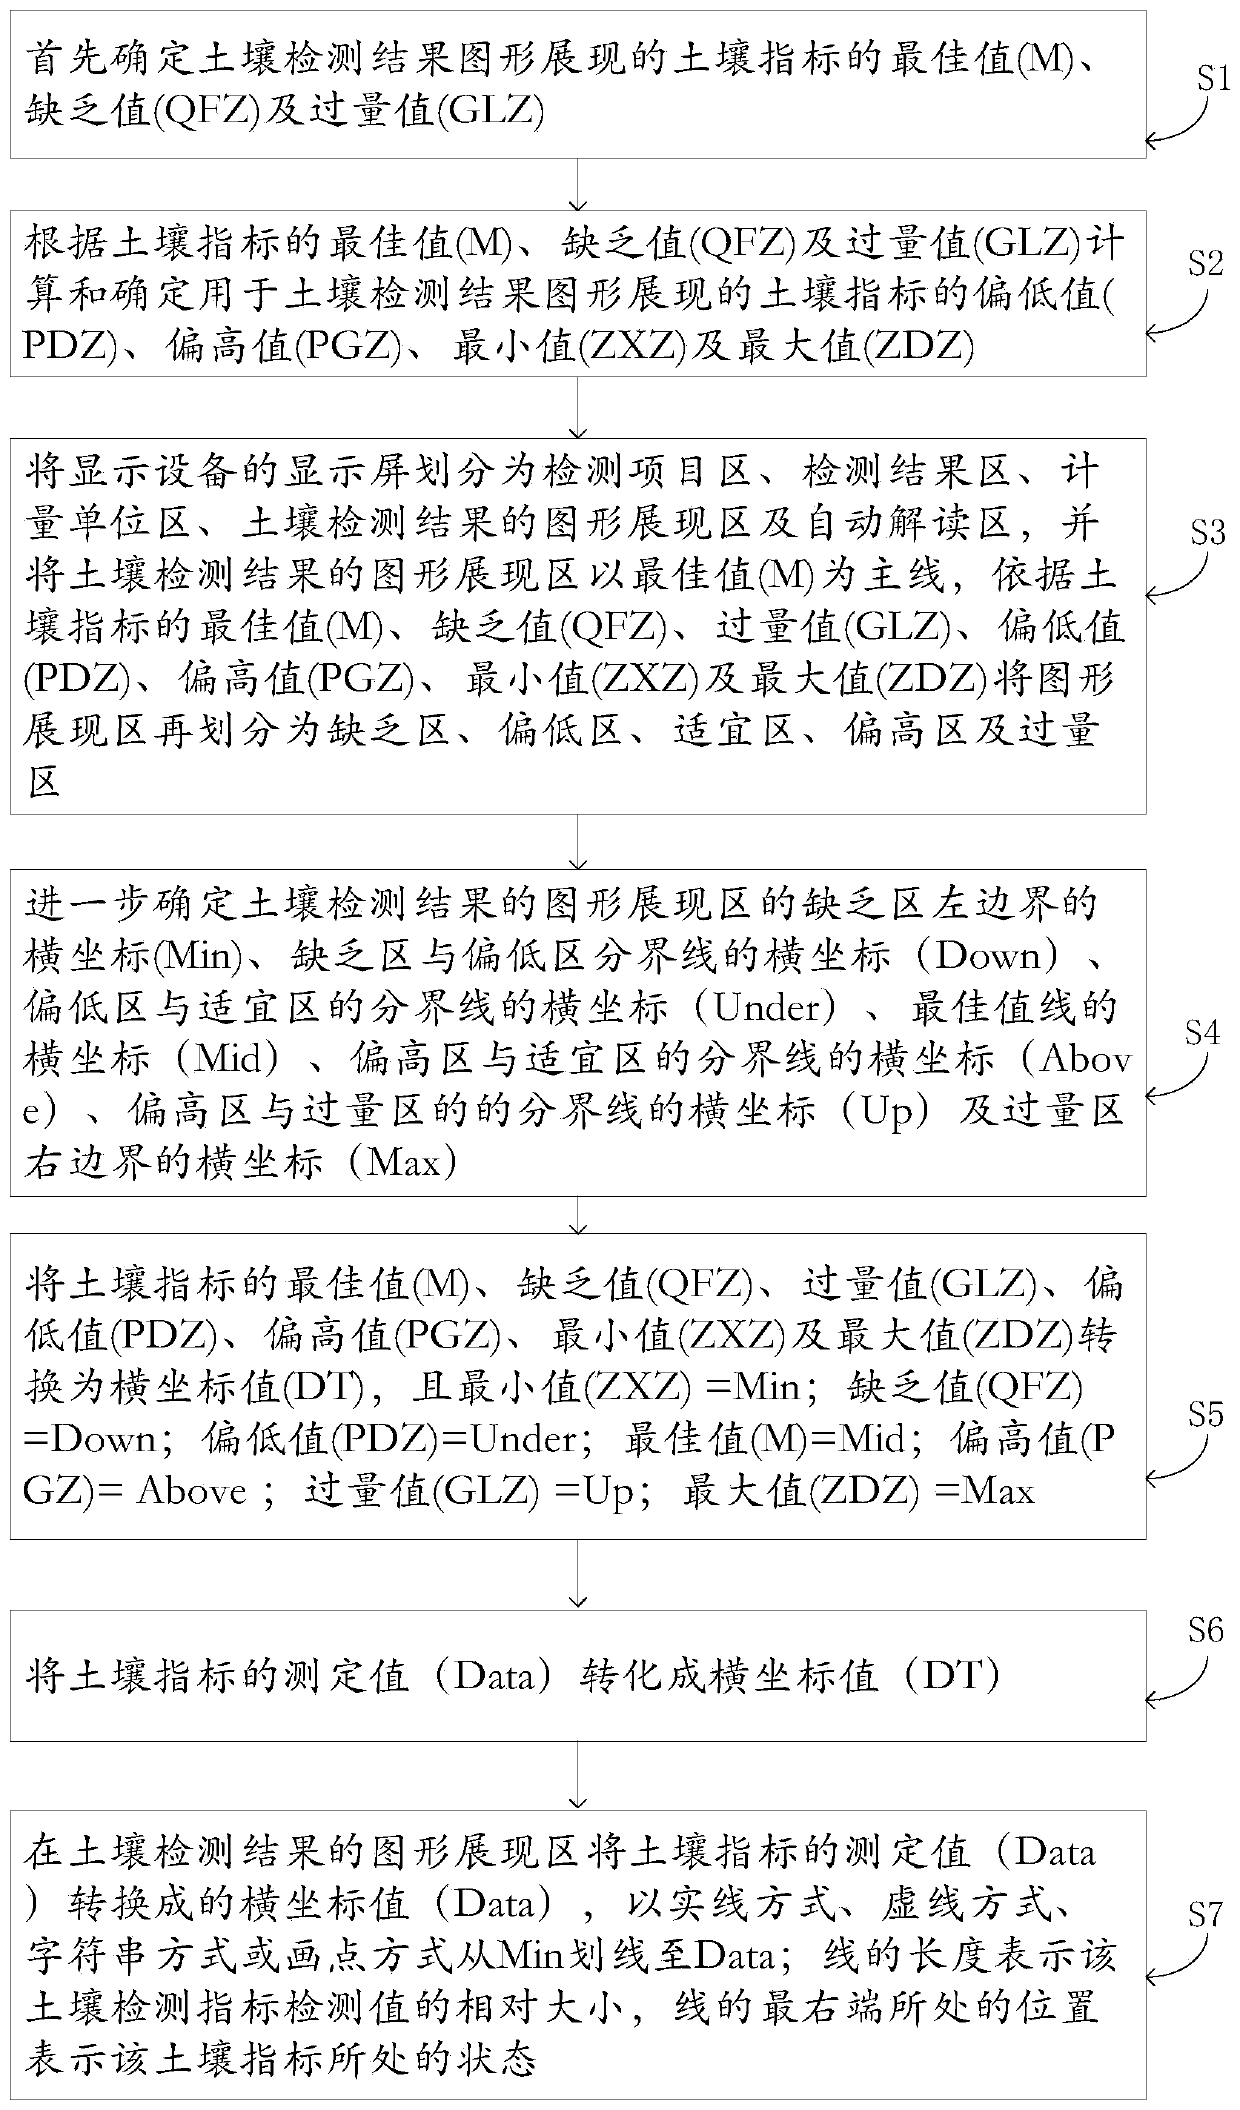
[0071] Figure 1-6 It shows a graphical presentation method of a soil detection result provided by the present invention, and the graphical presentation method includes the following steps:

[0072] Step S1: First determine the optimum value (M), deficient value (QFZ) and excess value (GLZ) of the soil index displayed by the soil test result graph; the optimum value (M) of the soil index means that the soil index is in the most favorable state. An optimal ideal value for crop production and avoiding nutrient waste and environmental hazards; the deficiency value (QFZ) of soil indicators means that when it is less than this value, the soil indicators are in a state of deficiency in the soil, which will affect the growth and development of crops; The excessive value (GLZ) of the soil index means that when it is greater than this value, the soil index is in an excessive or excessive state in the soil, which will affect the growth and development of crops or cause environmental haz...


PUM


Abstract

The invention is applicable to the field of soil detection results, and provides a graph display and automatic interpretation method for a soil detection result, and the graph display and automatic interpretation method comprises the following steps: firstly, determining an optimal value (M), a lack value (QFZ) and an excess value (GLZ) of a soil index; calculating and determining a lower value (PDZ), a higher value (PGZ), a minimum value (ZXZ) and a maximum value (ZDZ) of the soil index; Partitioning and drawing according to an optimal value (M), a lack value (QFZ), an excess value (GLZ), a low value (PDZ), a high value (PGZ), a minimum value (ZXZ) and a maximum value (ZDZ) of the soil index; and finally, an automatic interpretation model is constructed, and the soil detection result is automatically interpreted, so that the technical problems that the soil detection result is fed back to a user in a digital report form, non-professionals cannot understand the soil detection result, and the soil detection result cannot be used for guiding fertilization are solved.

Description

technical field [0001] The invention belongs to the field of soil testing results, and in particular relates to a method for graphic presentation and automatic interpretation of soil testing results. Background technique [0002] Soil testing is a very important task in modern agricultural production. The soil indicators tested mainly include soil pH, organic matter, soil effective nutrient content, etc. Through soil testing, we can know the data related to soil properties, which are very important for agricultural production. is crucial. The nutrients in the soil are essential nutrients for plant growth. Too little or too much nutrients will affect the growth of crops. Reasonable soil nutrient content is very important for the growth of crops. Soil nutrient testing can help us understand the nutrient status of the soil, and Guide fertilization work. [0003] At present, the results of soil testing in my country are fed back to users in the form of digital reports. After u...

Claims


Application Information

Patent Timeline
Patent Type & Authority Applications(China)
IPC IPC(8): G06F16/9038G01N33/24
Inventor 谢如林
Owner GUANGXI ZHUANG AUTONOMOUS REGION ACAD OF AGRI SCI
Why Eureka
Try Eureka