Electric Power Graphics Display Method

A power graphics and graphics technology, applied in vision/graphics programming, data processing applications, creation/generation of source code, etc., can solve the problem that graphics cannot be rendered by browsers, etc., to achieve the effect of easy observation and analysis

Active Publication Date: 2022-02-22
JIANGSU WISCOM TECHNOLOGY CO LTD
View PDF11 Cites 0 Cited by
  • Summary
  • Abstract
  • Description
  • Claims
  • Application Information

AI Technical Summary

Problems solved by technology

At present, the scheduling graphics of major manufacturers, especially NARI Technology System, are all based on CIM / G files, and the graphics rendering technologies of each manufacturer are all based on QT technology. Developed as a C / S model, QT has cross-platform, object-oriented, Support vector, rich API and other advantages, but as a B / S mode development, the graphics developed by QT cannot be rendered by the browser, even if ActiveX technology is used, it only supports the browser of the IE browser kernel, for power systems with high security levels , there are almost no WINDOWS servers in the production field, so the problem of rendering CIM / G files based on QT technology is exposed

Method used


Image

  • Electric Power Graphics Display Method

Examples


Embodiment Construction

[0017] In order to make the above objects, features and advantages of the present invention more comprehensible, the present invention will be further described in detail below in conjunction with the accompanying drawings and specific embodiments.

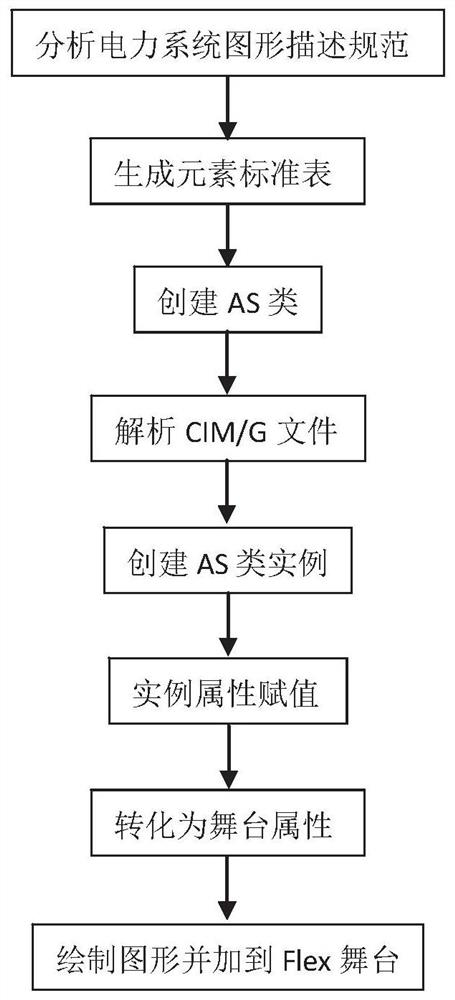
[0018] like figure 1 As shown, the present invention provides a method for displaying power graphics, including:

[0019] Step S1, detecting whether the operating environment of Flex is satisfied, that is, detecting whether the browser to be operated has a Flash Player plug-in installed;

[0020] Step S2, using the Flex to load and read the CIM / G file, and convert the loaded data into the AS (ActionScript) class in the Flex for storage;

[0021] Step S3, according to the basic drawing elements and grid graphic elements described in the power system graphic description specification, generate a corresponding element standard table, which includes: element name, element attribute and attribute description;

[0022] Step S4, accord...


PUM


Abstract

The invention provides a method for displaying power graphics. Aiming at the urgency of rendering power graphics on the WEB, the present invention proposes a CIM / G power graphics display method and application system based on Flex technology, which can realize desktop application Rendering can also implement WEB-based rendering. The present invention provides a CIM / G power graphic display method based on Flex technology. The method uses the Flex platform to analyze the CIM / G file, and clearly and accurately converts the equipment, equipment attributes and connection relationships between the equipment in the grid CIM / G. Graphically displayed for easy observation and analysis.

Description

technical field [0001] The invention relates to a power graphic display method. Background technique [0002] CIM / G is a new type of graphics developed on the basis of IEC 61970-453 CIM-based graphics exchange for the inability of the SVG-based public graphics exchange format to directly express the integration of power system graphics and models. graphics description language. G language expresses the relevant information of power equipment and power grid in a graphical way, supports efficient access to power graphics and model-related data, and supports the exchange of power graphics and model-related data between different systems. At present, the scheduling graphics of major manufacturers, especially NARI Technology System, are all based on CIM / G files, and the graphics rendering technologies of each manufacturer are all based on QT technology. Developed as a C / S model, QT has cross-platform, object-oriented, Supports vector, rich API and other advantages, but as a B / S...

Claims


Application Information

Patent Timeline
Patent Type & Authority Patents(China)
IPC IPC(8): G06F8/34G06T11/20G06Q50/06
Inventor 莫宇凌万水
Owner JIANGSU WISCOM TECHNOLOGY CO LTD
Why Eureka
Try Eureka