Automatic visualization method of web data based on subgraph isomorphism

A sub-graph isomorphism and data technology, applied in structured data browsing, structured data retrieval, database indexing, etc., can solve problems such as the inability to fully reflect automatic visualization

Active Publication Date: 2021-04-06
ZHEJIANG UNIV OF TECH
View PDF8 Cites 0 Cited by
  • Summary
  • Abstract
  • Description
  • Claims
  • Application Information

AI Technical Summary

Problems solved by technology

Although the existing visualization system simplifies the operation of data visualization to varying degrees, it still requires user participation and guidance, especially for complex data that needs to be manually arranged to ensure a better visualization effect; without the support of matching algorithms, the results of the graph are limited Within the scope of manual settings, the advantages of automatic visualization cannot be fully reflected

Method used


Image

  • Automatic visualization method of web data based on subgraph isomorphism
  • Automatic visualization method of web data based on subgraph isomorphism
  • Automatic visualization method of web data based on subgraph isomorphism

Examples


example

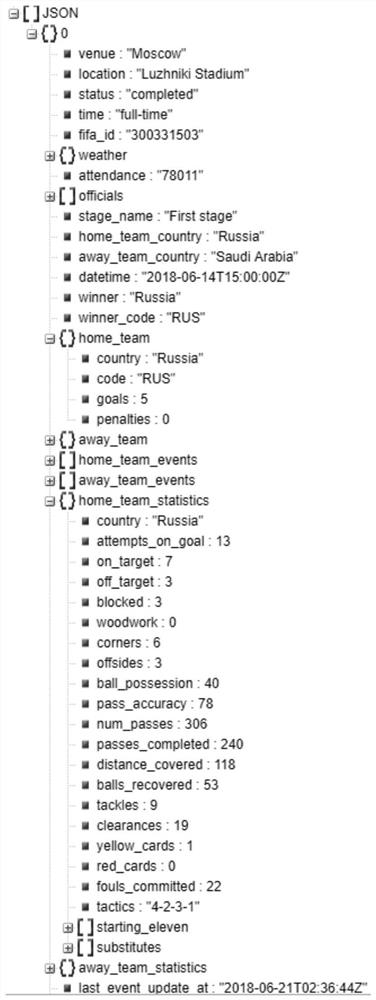
[0248] Example: figure 2 Shows the JSON data structure diagram returned by the 2018 World Cup REST API. The supplier of the World Cup inJSON API is Software For Good, which is a sports API. Its publishing homepage is http: / / worldcup.sfg.io, and the document homepage URL is https: / / github.com / estiens / world_cup_json . The JSON data structure shown shows the first game information of the 2018 World Cup. fifa_id marks the ID of the game, weather includes the weather information of the game area on the day of the game, attendance indicates the number of spectators in the game, and officials includes the game The staff list of the game, home_team and away_team introduce the information of the two opposing teams in the game, home_team_events and away_team_events include the judgment and penalty events of the opposing teams in the game, home_team_statistics and away_team_statistics include the game against the team in the game Data statistics.

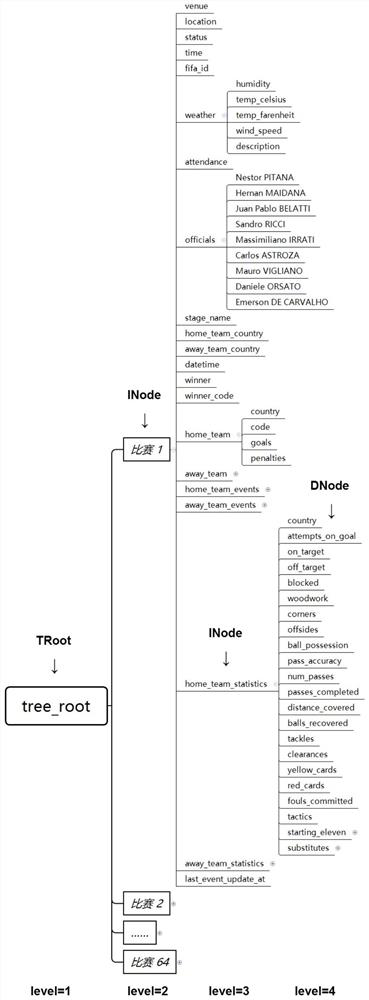
[0249] image 3 It is a tree...


PUM


Abstract

An automatic web data visualization method based on subgraph isomorphism, including the following steps: the first step: constructing the architecture of the service data visualization modeling and matching method; the second step: defining the metadata tree MDT; the third step: reading For the JSON data returned by the called REST API, the JSON data set ds is used as the input of the modeling algorithm to model the tree structure of ds; the fourth step: retain the basic data structure information by pruning; the fifth Step 1: Classify the visual graphics; Step 6: First use the dimension reduction method to perform dimension reduction operation on MDT, generate meta-structure tree MST, and then perform matching query, call the matching method based on subgraph isomorphism to find the relationship between MST and VT Matching fragments of each StructModel, and perform data mapping based on Mapping information to generate visual graphics. The invention automatically matches the models to realize the automatic visualization of data.

Description

technical field [0001] The invention relates to an automatic web data visualization method based on subgraph isomorphism. Background technique [0002] The REST (Representational State Transfer) architectural style was released at the international conference ICSE in 2000. It is an abstract model of Web architecture and is used to guide the redesign and definition of Hypertext Transfer Protocol and Uniform Resource Identifier. It is still possible to understand the working methods and principles of the World Wide Web based on the application of this architectural style, which is of great significance for the understanding and development of large-scale software architecture. Dr. Roy T. Fielding's papers proposing the REST architectural style have been cited more than 7,000 times in Google Scholar, and papers published in ICSE / TOIT have been cited more than 2,000 times. [0003] The popularity of REST services has led to the emergence of a large number of lightweight data se...

Claims


Application Information

Patent Timeline
Patent Type & Authority Patents(China)
IPC IPC(8): G06F16/21G06F16/22G06F16/26
CPCG06F16/212G06F16/2246G06F16/26
Inventor 陆佳炜高燕煦赵伟程振波徐俊肖刚
Owner ZHEJIANG UNIV OF TECH
Why Eureka
Try Eureka