Fractional order synchronous extraction generalized S transformation time-frequency decomposition and reconstruction method
A technology of synchronous extraction and time-frequency decomposition, which is applied in the direction of complex mathematical operations to achieve the effect of time-frequency energy concentration and time-frequency resolution improvement
- Summary
- Abstract
- Description
- Claims
- Application Information
AI Technical Summary
Problems solved by technology
Method used
Image
Examples
Embodiment 1
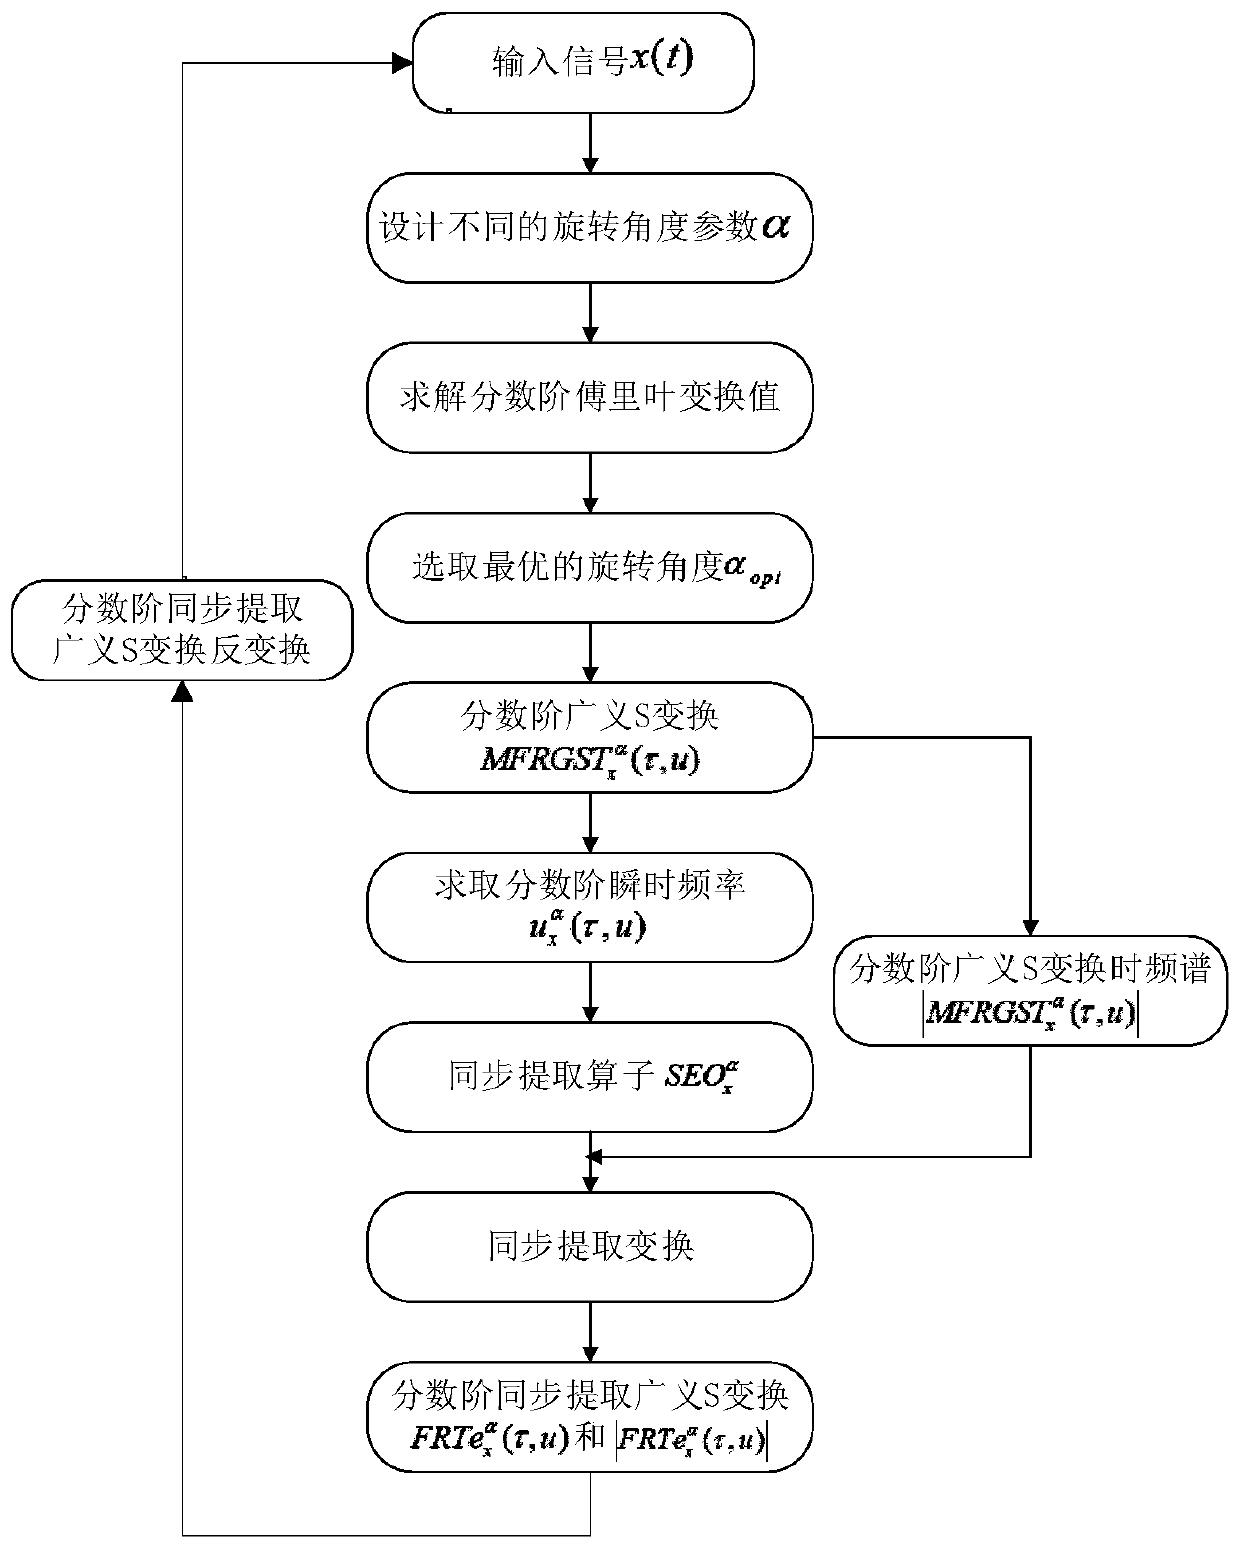
[0052] Embodiment 1: see figure 1 , a fractional-order synchronous extraction generalized S-transform time-frequency decomposition and reconstruction method, comprising the following steps:
[0053] (1) Input the original one-dimensional signal x(t) to be analyzed;
[0054] (2) Perform fractional Fourier transform spectrum analysis on the one-dimensional signal x(t) with different rotation angles α, and determine the concentration degree of signal energy according to the size of the spectral coefficients, and select the corresponding time when the signal energy concentration is the strongest The rotation angle of , which is regarded as the optimal rotation angle αo pt ;
[0055] Described step (2) is specifically:
[0056] Select the optimal rotation angle α according to the following formula opt
[0057]
[0058] In the formula, t is time, u is fractional frequency, K α (t,u) is the transform kernel of fractional Fourier transform, and its expression is:
[0059] ...
Embodiment 2
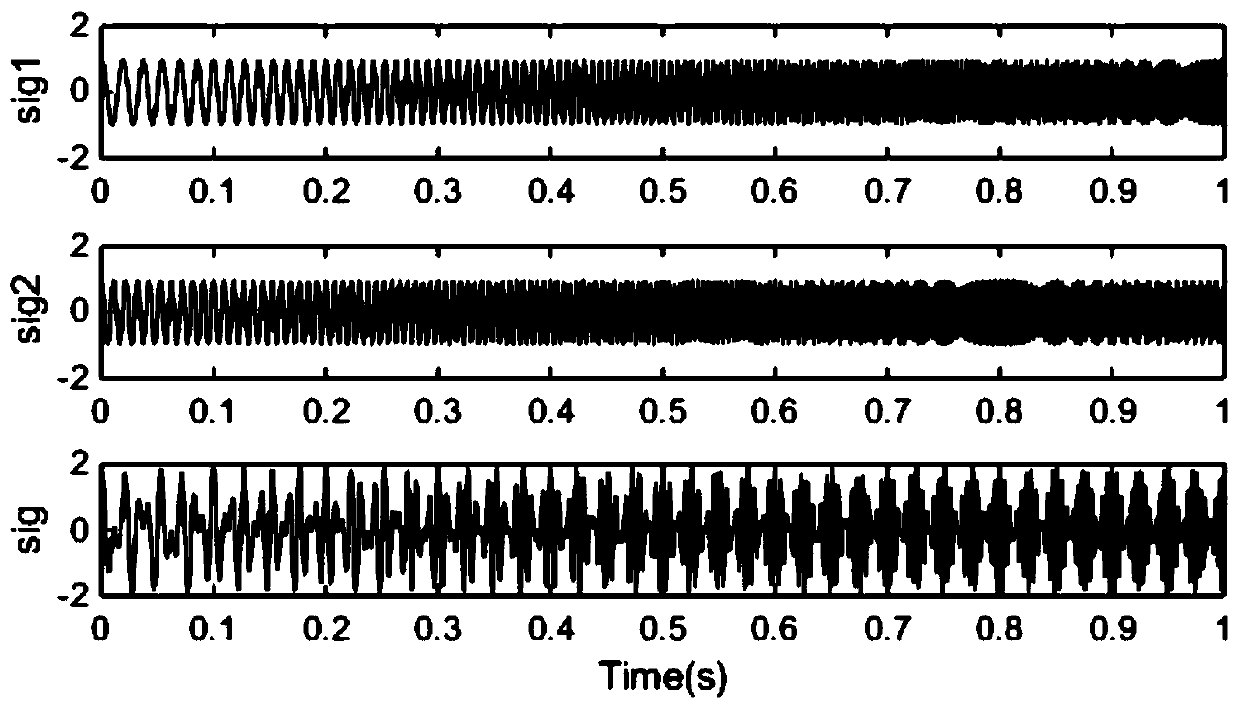
[0080] (1) Input the original one-dimensional signal x(t) to be analyzed. In this embodiment, the one-dimensional signal x(t) is figure 2 Shown is the composite signal sig of two linear signals sig1 and sig2.
[0081] Steps (2)-(7) are the same as in Example 1.
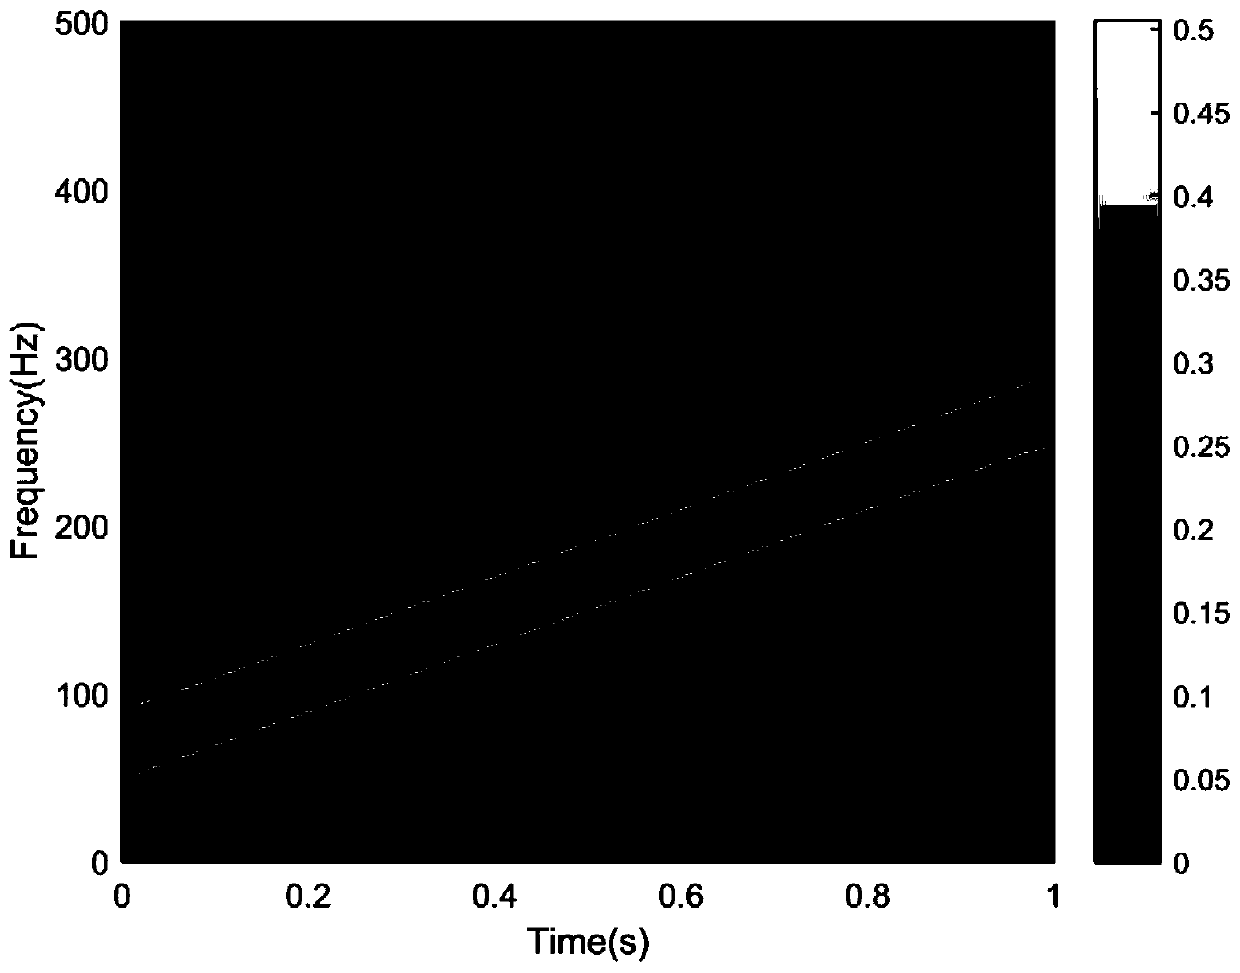
[0082] The present embodiment also includes between steps (6) and (7), and also includes a step of: performing a modulo operation on the result in step (6) to obtain the final fractional order synchronously extracting the generalized S-transform time spectrum At this time, the time-spectrum diagram after this step is processed is as follows image 3 . from image 3 It can be seen that after being processed by the method of the present invention, the time spectrum of the two linear sub-signals can be correctly presented, the frequency increases linearly with time, the frequency resolution is high, and the energy is concentrated.
Embodiment 3
[0084] (1) Input the original one-dimensional signal x(t) to be analyzed. In this embodiment, the one-dimensional signal x(t) is Figure 4 Shown is the composite signal sig of two nonlinear signals sig1 and sig2.
[0085] Steps (2)-(7) are the same as in Example 1.
[0086] The present embodiment also includes between steps (6) and (7), and also includes a step of: performing a modulo operation on the result in step (6) to obtain the final fractional order synchronously extracting the generalized S-transform time spectrum At this time, the time-spectrum diagram after this step is processed is as follows Figure 5 . from Figure 5 It can be seen that the processed time-spectrum has two curves, corresponding to the time-spectrum of two nonlinear signals, the frequency changes in a curve with time, the frequency resolution is high, and the energy is concentrated.
PUM
 Abstract
Description
Claims
Application Information
 - R&D
- Intellectual Property
- Life Sciences
- Materials
- Tech Scout
- Unparalleled Data Quality
- Higher Quality Content
- 60% Fewer Hallucinations
Browse by: Latest US Patents, China's latest patents, Technical Efficacy Thesaurus, Application Domain, Technology Topic, Popular Technical Reports.
© 2025 PatSnap. All rights reserved.Legal|Privacy policy|Modern Slavery Act Transparency Statement|Sitemap|About US| Contact US: help@patsnap.com


