Supercharge Your Innovation With Domain-Expert AI Agents!

Method for realizing interactive time axis with thumbnail based on LiveChart

A technology of time axis and thumbnail, which is applied in the direction of visual data mining, data processing input/output process, special data processing application, etc., to achieve the effect of strengthening data visualization function and zooming display range

Pending Publication Date: 2020-01-17
ELECTRIC POWER RESEARCH INSTITUTE, CHINA SOUTHERN POWER GRID CO LTD +1
View PDF2 Cites 1 Cited by
  • Summary
  • Abstract
  • Description
  • Claims
  • Application Information

AI Technical Summary

Problems solved by technology

[0004] LiveCharts is a visual chart library of Microsoft WPF development platform, which can realize many data visualization functions; however, although LiveCharts provides the API of the underlying mouse operation, it does not provide a basic development framework for the time axis with thumbnails

Method used


Image

  • Method for realizing interactive time axis with thumbnail based on LiveChart
  • Method for realizing interactive time axis with thumbnail based on LiveChart
  • Method for realizing interactive time axis with thumbnail based on LiveChart

Examples


Embodiment Construction

[0034] In order to facilitate the understanding of the present invention, the present invention will be described more fully below with reference to the associated drawings. A preferred embodiment of the invention is shown in the drawings. However, the present invention can be embodied in many different forms and is not limited to the embodiments described herein. Rather, these embodiments are provided so that the disclosure of the present invention will be thorough and complete.

[0035] Unless otherwise defined, all technical and scientific terms used herein have the same meaning as commonly understood by one of ordinary skill in the technical field of the invention. The terms used herein in the description of the present invention are for the purpose of describing specific embodiments only, and are not intended to limit the present invention. As used herein, the term "and / or" includes any and all combinations of one or more of the associated listed items.

[0036] Such a...


PUM


Abstract

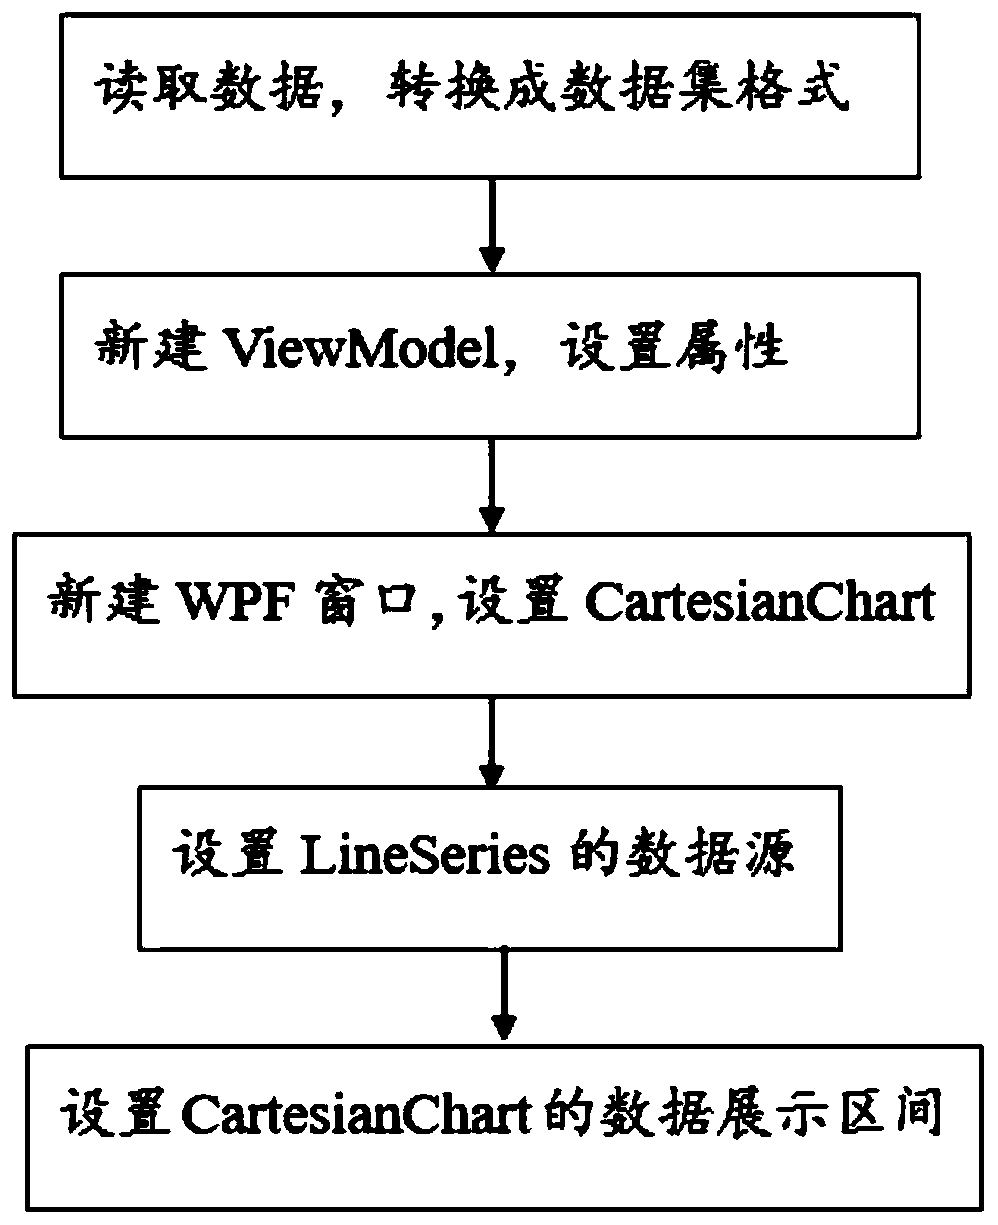
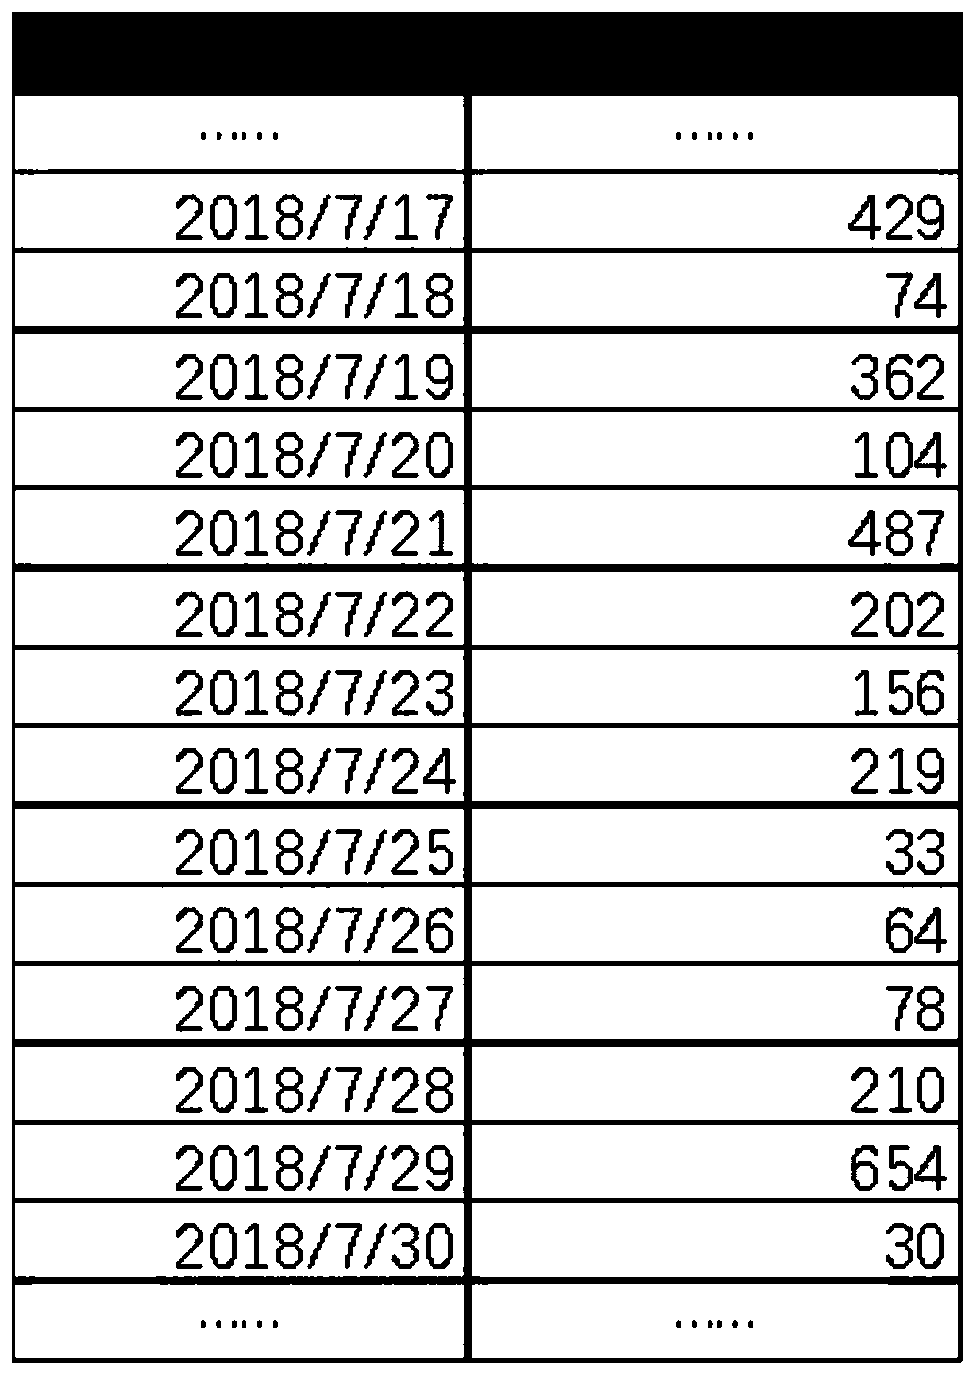
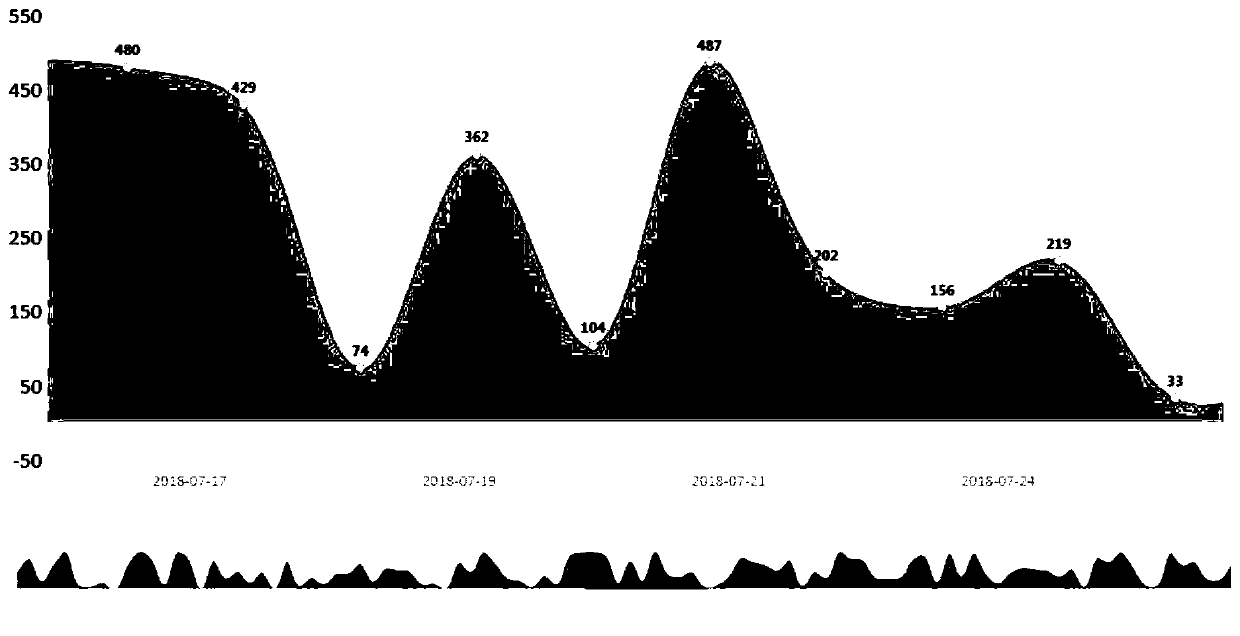
The invention discloses a method for realizing an interactive time axis with a thumbnail based on LiveChart. The method comprises steps of utilizing WPF basic technology to access a data source and acquire data; sorting the data into a data set format; building a ViewModel newly; setting ChartValues to provide a bindable data source; setting two starting and ending time point attributes corresponding to a time period when the main graph needs to display data, newly establishing a WPF window, introducing Cartesian Chart, binding Chart Values, and setting a corresponding data display interval for the Cartesian Chart. The interactive time axis application can be quickly generated, when the time axis is dragged, the first chart can roll left and right along with the rolling wheel, and when themiddle sliding wheel of the mouse is rolled, the display range can be dynamically zoomed.

Description

technical field [0001] The invention relates to the technical field of Net WPF development, in particular to a method for realizing an interactive time axis with thumbnails based on LiveChart. Background technique [0002] Data visualization is a scientific and technological research on the visual representation of data, mainly by means of graphical means to convey and communicate information clearly and effectively. [0003] At present, the visualization of big data is not only satisfied with the simple static display of data, but more and more inclined to the visualization that can be interactively operated. The time axis is a very efficient visual expression method, which can not only display the data intuitively Or major events, etc., can also extend the data display within a limited fixed screen range through mouse dragging, scroll wheel and other operations. [0004] LiveCharts is a visual chart library of Microsoft WPF development platform, which can realize many dat...

Claims


Application Information

Patent Timeline
IPC IPC(8): G06F16/26G06F16/2458G06F3/0484
CPCG06F16/26G06F16/2474G06F3/0484
Inventor 郑楷洪肖勇赵云钱斌周密
Owner ELECTRIC POWER RESEARCH INSTITUTE, CHINA SOUTHERN POWER GRID CO LTD
Features
  • R&D
  • Intellectual Property
  • Life Sciences
  • Materials
  • Tech Scout
  • Unparalleled Data Quality
  • Higher Quality Content
  • 60% Fewer Hallucinations
Learn More