Massive time series data visualization method for transient analysis of power system

A time series, power system technology, applied in electrical digital data processing, visual data mining, data processing applications, etc., can solve the problems of visual confusion, difficult to distinguish, analysis troubles, etc., to reduce time complexity and ensure smoothness Sex, occlusion removal and visual clutter effects

Pending Publication Date: 2020-02-14
ZHEJIANG UNIV
View PDF3 Cites 3 Cited by
  • Summary
  • Abstract
  • Description
  • Claims
  • Application Information

AI Technical Summary

Problems solved by technology

[0003] Analyzing transient time series data with the help of curve reading room tools will mainly cause two problems: first, due to the limitation of human brain memory, the number of curves that can be observed simultaneously visually is limited; second, relying on the experience of domain experts to monitor and analyze key components misjudgment or misjudgment
[0004] Simple and direct visualization of massive curves usual

Method used


Image

  • Massive time series data visualization method for transient analysis of power system
  • Massive time series data visualization method for transient analysis of power system
  • Massive time series data visualization method for transient analysis of power system

Examples


Embodiment Construction

[0045] The present invention will be described in detail below in conjunction with the embodiments and accompanying drawings, but the present invention is not limited thereto.

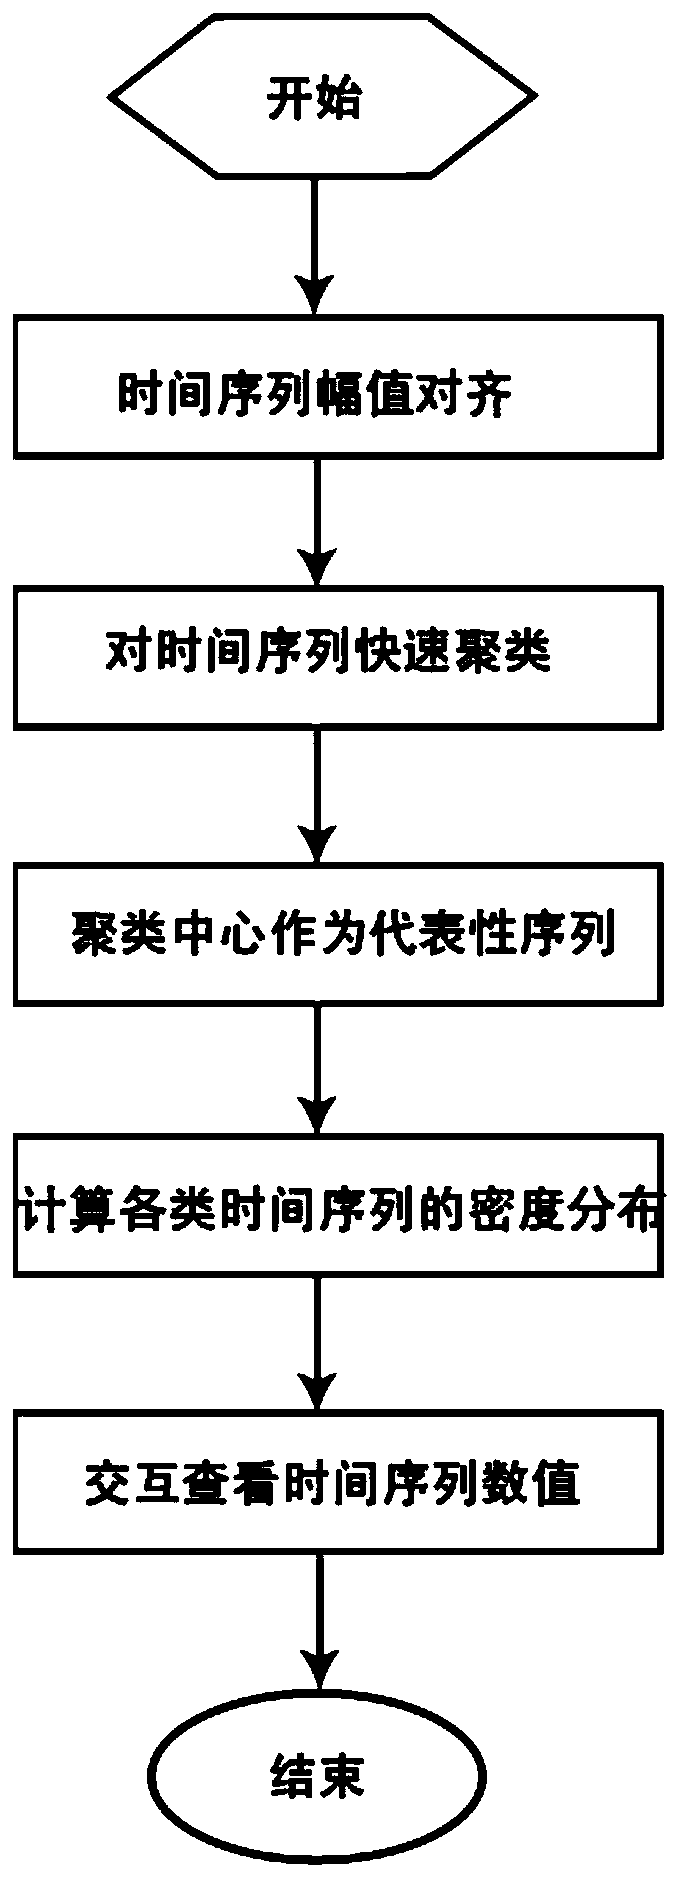
[0046] Such as figure 2 As shown, a schematic diagram of the main flow of an embodiment of the method for visualizing massive time series data oriented to power system transient analysis provided by the present invention is shown. In this embodiment, the method includes the steps of:

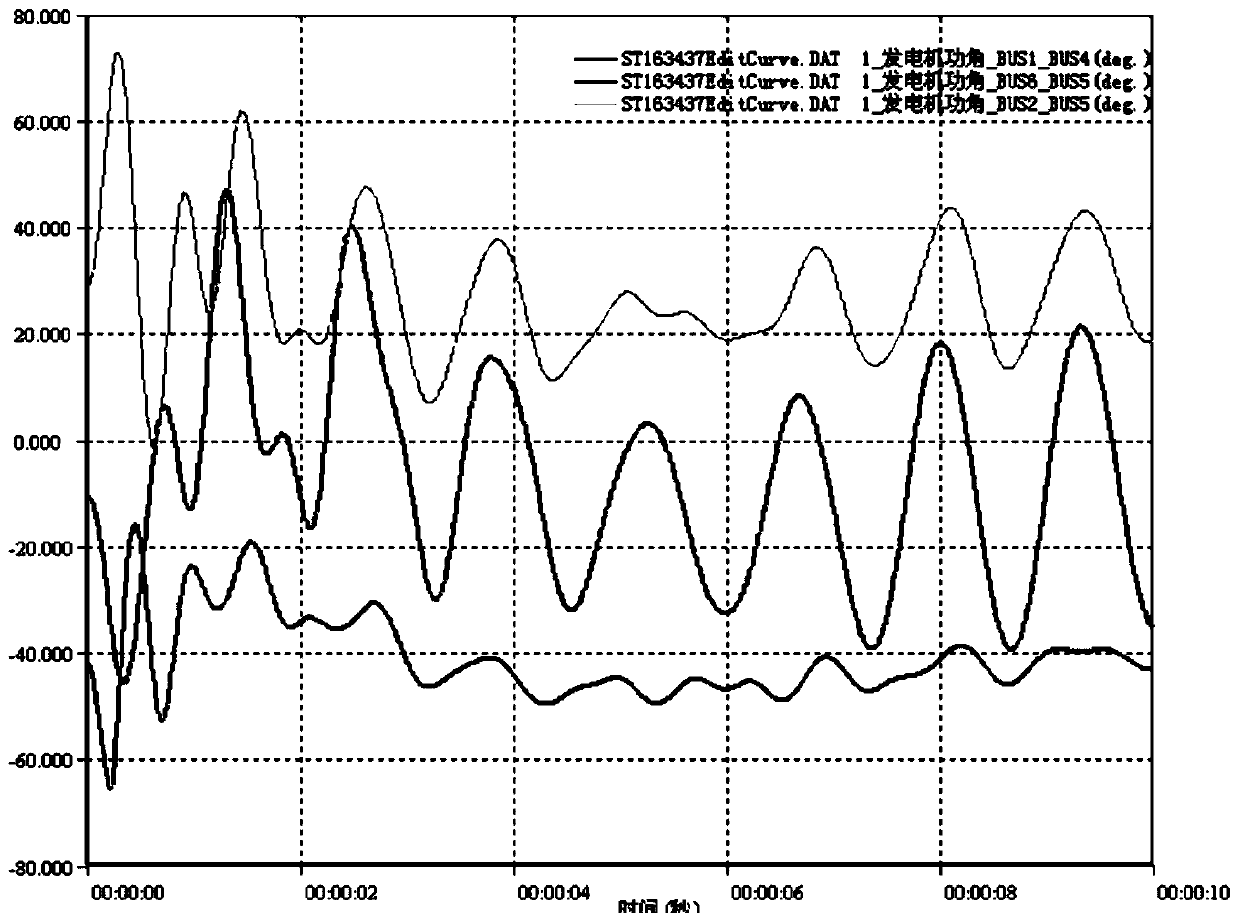
[0047] Step 1, read the time series and align the data according to its amplitude, and transform the time series to 0 as the initial value.

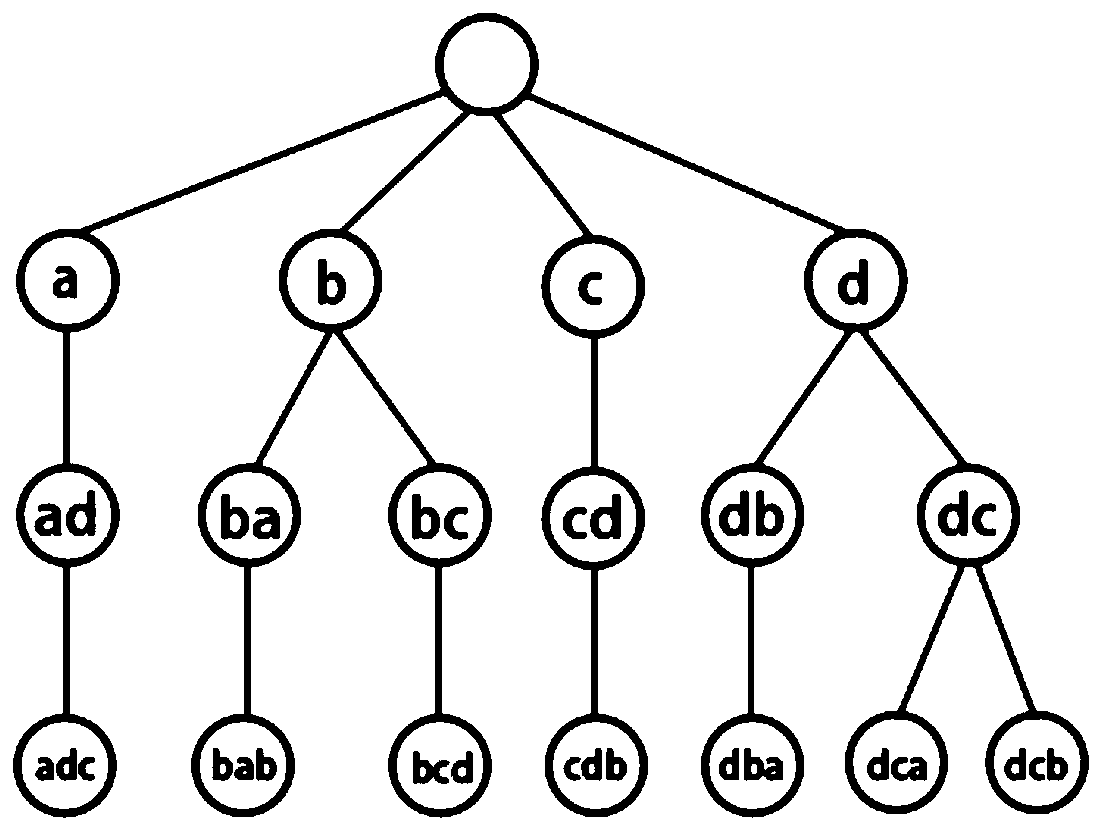
[0048] Step 2, based on the approximate clustering algorithm of the Trie tree, find out the representative curve

[0049] Step 2.1, according to the value range of the time series [x min ,x max ] Set m subspaces, the length of each subspace is (x max -x min ) / m.

[0050] In step 2.2, the value of each time series is quantified into the number of the segmented interval, and ...


PUM


Abstract

The invention discloses a massive curve visualization method for transient analysis of a power system. The method comprises the following steps: firstly, reading time series data involved in transientstability analysis of the power system and performing amplitude alignment on the time series data; converting the time series into a character string by adopting an approximate calculation method, indexing according to a Trie tree, and performing quick clustering by querying the Trie tree; wherein the clustering center is used as time series representativeness and is drawn into a curve; then, calculating the overall density distribution of the time series through a kernel density estimation algorithm by means of the parallel capacity of the GPU; providing interaction tools to classify viewingor select regions of interest to view time series values. According to the method, the density value is mapped to the color space to be visualized through the kernel density estimation method according to the density distribution of the curves in the screen space, and shielding between the curves and visual disorder are eliminated. For thousands of curves, the whole visualization process can be completed within tens of milliseconds, and the fluency of interaction is ensured.

Description

technical field [0001] The invention relates to the field of power system transient analysis, in particular to a massive time series data visualization method for power system transient analysis. Background technique [0002] The power system transient analysis process can be summarized as an iterative process of "controlling parameters, performing calculations, monitoring and analyzing key components, and readjusting parameters". The current transient analysis mainly uses the function of the curve reading room to open multiple monitoring windows at the same time, and place several (<10) monitoring curves side by side in each monitoring window. figure 1 Shows the time series visualization views placed side by side in the PSASP curve reading room, usually only a maximum of 8 time series curves are displayed in a curve window. [0003] Analyzing transient time series data with the help of curve reading room tools will mainly cause two problems: first, due to the limitation...

Claims


Application Information

Patent Timeline
IPC IPC(8): G06F16/2458G06F16/26G06K9/62G06Q50/06
CPCG06F16/2462G06F16/2474G06F16/26G06Q50/06G06F18/2321Y04S10/50
Inventor 郑文庭汪飞
Owner ZHEJIANG UNIV
Why Eureka
Try Eureka