
Implementation method of cloud center tenant dimension topological graph

A topology map and topology technology, applied in the field of data display, can solve problems such as the inability to visually display the relationship between tenants and resources, the poor display effect of topology nodes, and the inability to visually view alarm resources or tenants, etc., to achieve accurate display and avoid display chaotic effect

Active Publication Date: 2020-02-25
SHANDONG LANGCHAO YUNTOU INFORMATION TECH CO LTD
View PDF5 Cites 7 Cited by
  • Summary
  • Abstract
  • Description
  • Claims
  • Application Information

AI Technical Summary

Problems solved by technology

[0002] Check which tenants are in the cloud center, which departments these tenants belong to, and which resources these tenants own, what are the relationships between the types of resources involved, what impact the direct or indirect relationships have on resources or tenants, and the current management system Most of them use lists to display tenant lists, resource lists, alarm lists, etc. This method cannot visually display the relationship between tenants and resources, let alone visually view the resources or tenants affected by alarms
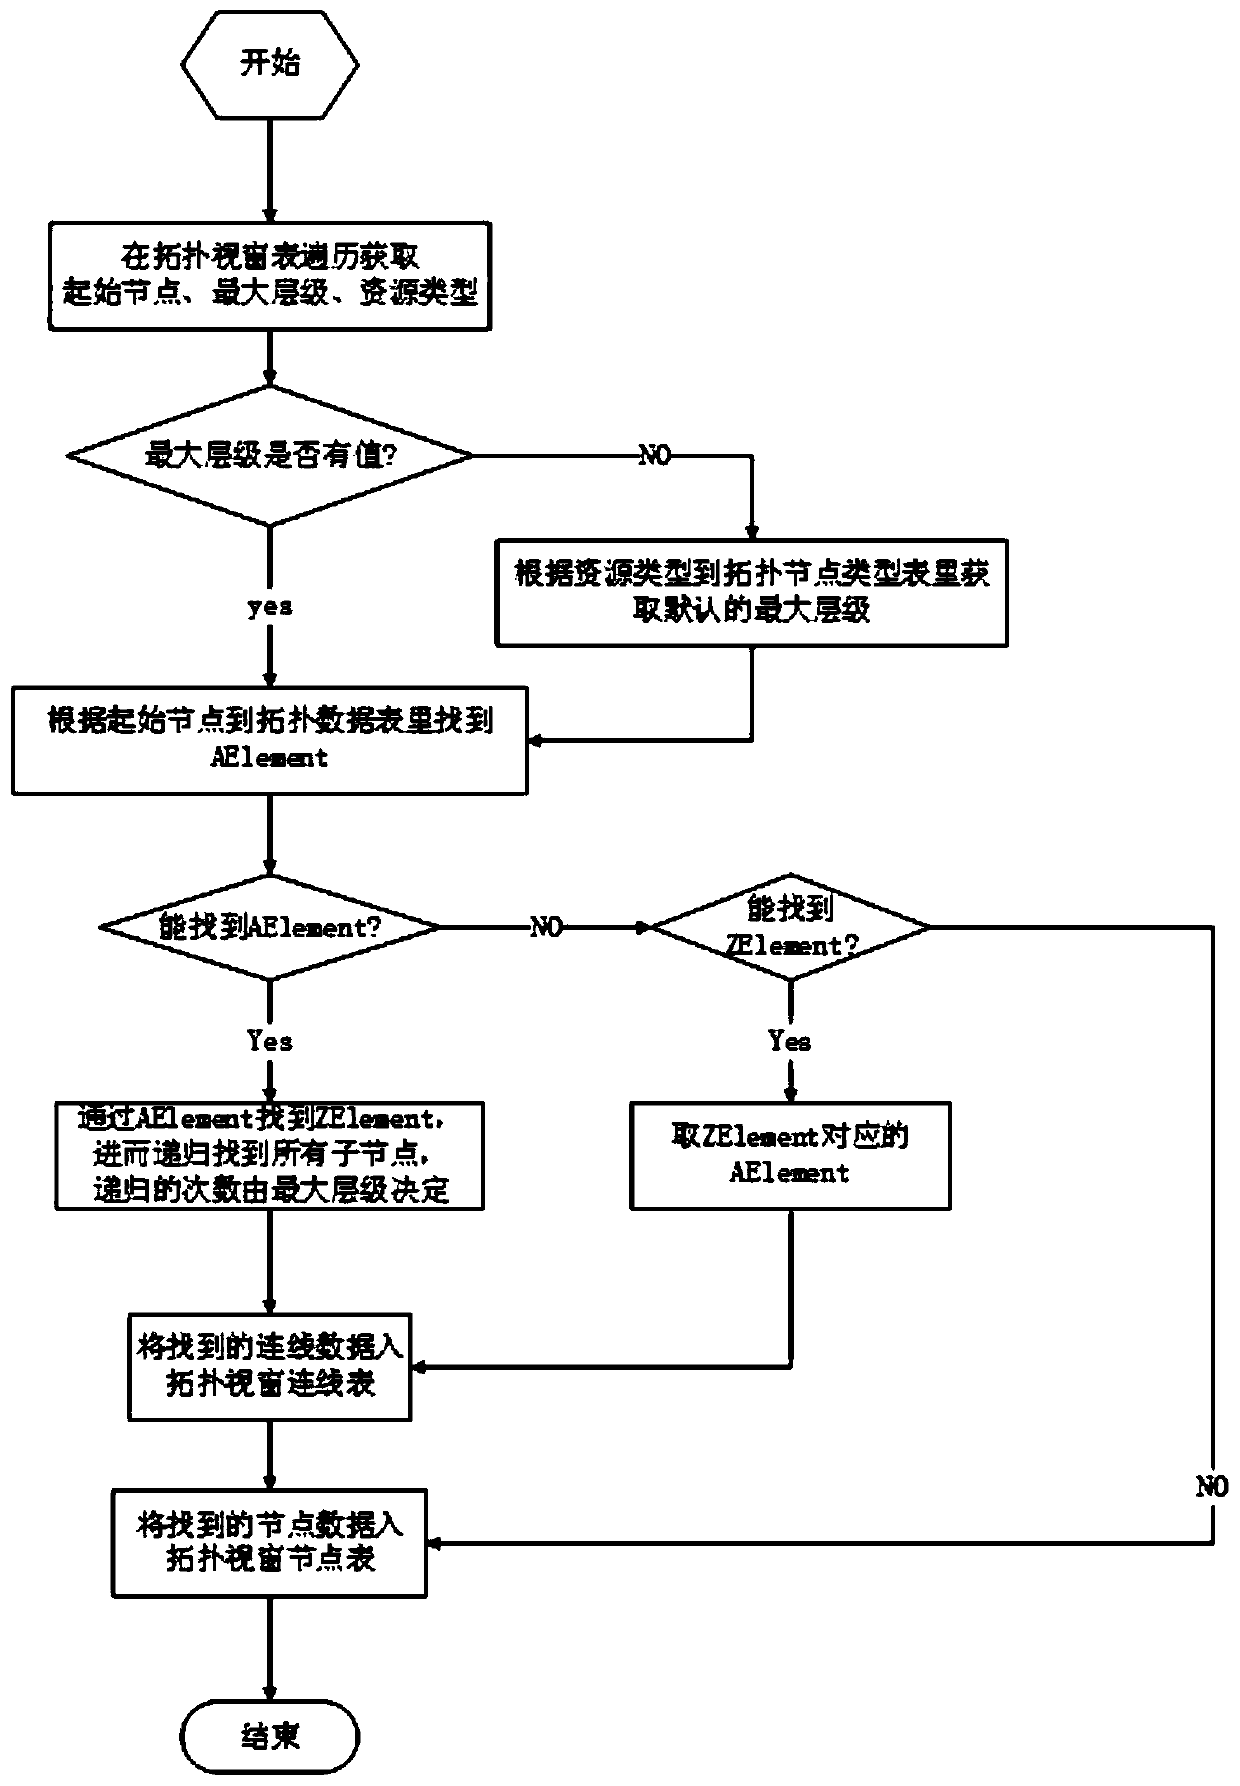
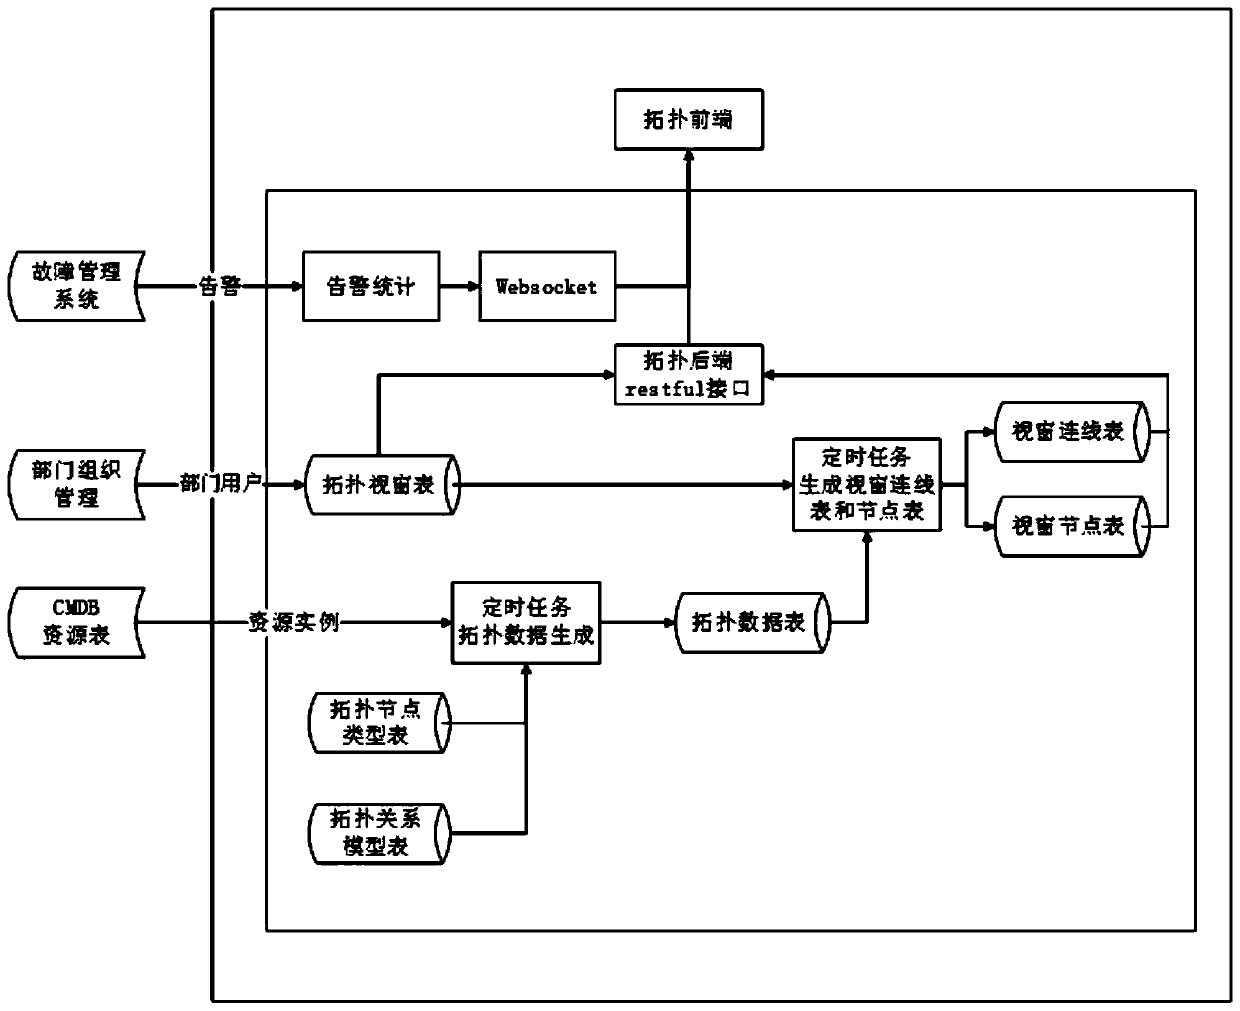
[0003] In order to solve the problem that too many topological nodes have poor display effect due to the large number of resources of cloud center tenants, the present invention discloses a method for realizing the dimensional topological map of cloud center tenants. According to the topology node data and the tenants and resources in the topology relationship, and the relationship between resources and resources to obtain configuration data, use the corresponding relationship between windows and topology nodes to gradually generate topology data with hierarchical relationships through configuration data and resource data, use topology data to generate corresponding topology diagrams, and display them; use The method of the present invention decomposes an overall topological map into several local topological maps, and each topological map can be configured with a maximum number of layers to display, so that the operation and maintenance personnel can view the topology more clearly, greatly improving the operation and maintenance efficiency, and being able to Understand the ownership relationship between tenants and resources in the cloud center as a whole, and check which associated resources or tenants are affected by alarms in real time

Method used


Image

  • Implementation method of cloud center tenant dimension topological graph
  • Implementation method of cloud center tenant dimension topological graph

Examples


Embodiment Construction

[0036] The present invention provides a method for implementing a cloud center tenant dimension topology map, which acquires configuration data according to topology node data, tenants and resources in topology relationships, and association relationships between resources and resources,

[0037] Through the configuration data and resource data, the corresponding relationship between the window and the topology node is used to gradually generate the topology data with a hierarchical relationship.

[0038] Use the topology data to generate the corresponding topology map and display it.

[0039] At the same time, an implementation tool for a cloud center tenant dimension topology map corresponding to the above method is provided, including a data module, a generation module and a display module,

[0040] The data module obtains configuration data according to the topology node data, tenants and resources in the topology relationship, and the association relationship between reso...


PUM


Abstract

The invention discloses an implementation method of a cloud center tenant dimension topological graph in the technical field of data display. The method comprise the following steps of acquiring configuration data according to the configuration data and the association relationship between the resources, gradually generating topological data with a hierarchical relationship through the configuration data and the resource data by utilizing the corresponding relationship between the windows and the topological nodes, generating a corresponding topological graph by utilizing the topological data,and displaying the topological graph. The association relationship of tenant dimensions, including the association relationship between tenants and resources to which the tenants belong and the association relationship between the resources, is displayed in the form of the topological graph, so that operation and maintenance personnel can master the resource attribution situation of the cloud center more visually; the local topological graph can be displayed in a layered mode in the form of the window, the maximum display hierarchy of the window can be defined, display disorder caused by toomany topological nodes is avoided, and therefore operation and maintenance personnel can check topology more clearly.

Description

technical field [0001] The invention discloses a method for realizing a cloud center tenant dimension topology map, and relates to the technical field of data display. Background technique [0002] Check which tenants are in the cloud center, which department they belong to, and what resources these tenants have, what relationships are involved in the types of resources involved, what impact does the direct or indirect relationship have on resources or tenants, and the current management system Most of the tenant lists, resource lists, alarm lists, etc. are displayed in the form of lists. This method cannot visually display the relationship between tenants and resources, and it is also impossible to intuitively view the resources or tenants affected by the alarm. [0003] In order to solve the problem that the number of resources of cloud center tenants is large, resulting in too many topology nodes and poor display effect, the invention discloses a method for implementing a...

Claims


Application Information

Patent Timeline
IPC IPC(8): H04L12/24
CPCH04L41/12H04L41/22H04L41/0803
Inventor 杨继伟宋喆魏金雷
Owner SHANDONG LANGCHAO YUNTOU INFORMATION TECH CO LTD
Learn More