Power distribution network load space-time characteristic visual analysis method

An analysis method and technology of load characteristics, applied in the field of visualization of the spatiotemporal characteristics of distribution network loads, can solve the problems of distribution transformers being flooded, unable to meet the power supply needs of important customers, and the lack of reliability assessment of the power grid.

Active Publication Date: 2020-06-12
NR ELECTRIC CO LTD +1
View PDF2 Cites 7 Cited by
  • Summary
  • Abstract
  • Description
  • Claims
  • Application Information

AI Technical Summary

Problems solved by technology

[0003] (1) The distribution network equipment lacks effective and reliable status assessment and risk assessment, such as frequent power outages in some urban villages, distribution transformers damaged by floods, and line overloads;
[0004] (2) Lack of reliability assessment, fault diagnosis and weak point location capabilities for the power grid;
[0005] (3) The user evaluation is not in place, and there are problems such as long average customer power outage time, failure to meet the power supply needs of important customers, and insufficient communication with customers;
[0006] (4) It is impossible to evaluate the comprehensive operation status of the entire distribution network, so that it is impossible to provide comprehensive guidance for the business

Method used


Image

  • Power distribution network load space-time characteristic visual analysis method
  • Power distribution network load space-time characteristic visual analysis method
  • Power distribution network load space-time characteristic visual analysis method

Examples


Embodiment Construction

[0028] The technical solutions and beneficial effects of the present invention will be described in detail below in conjunction with the accompanying drawings.

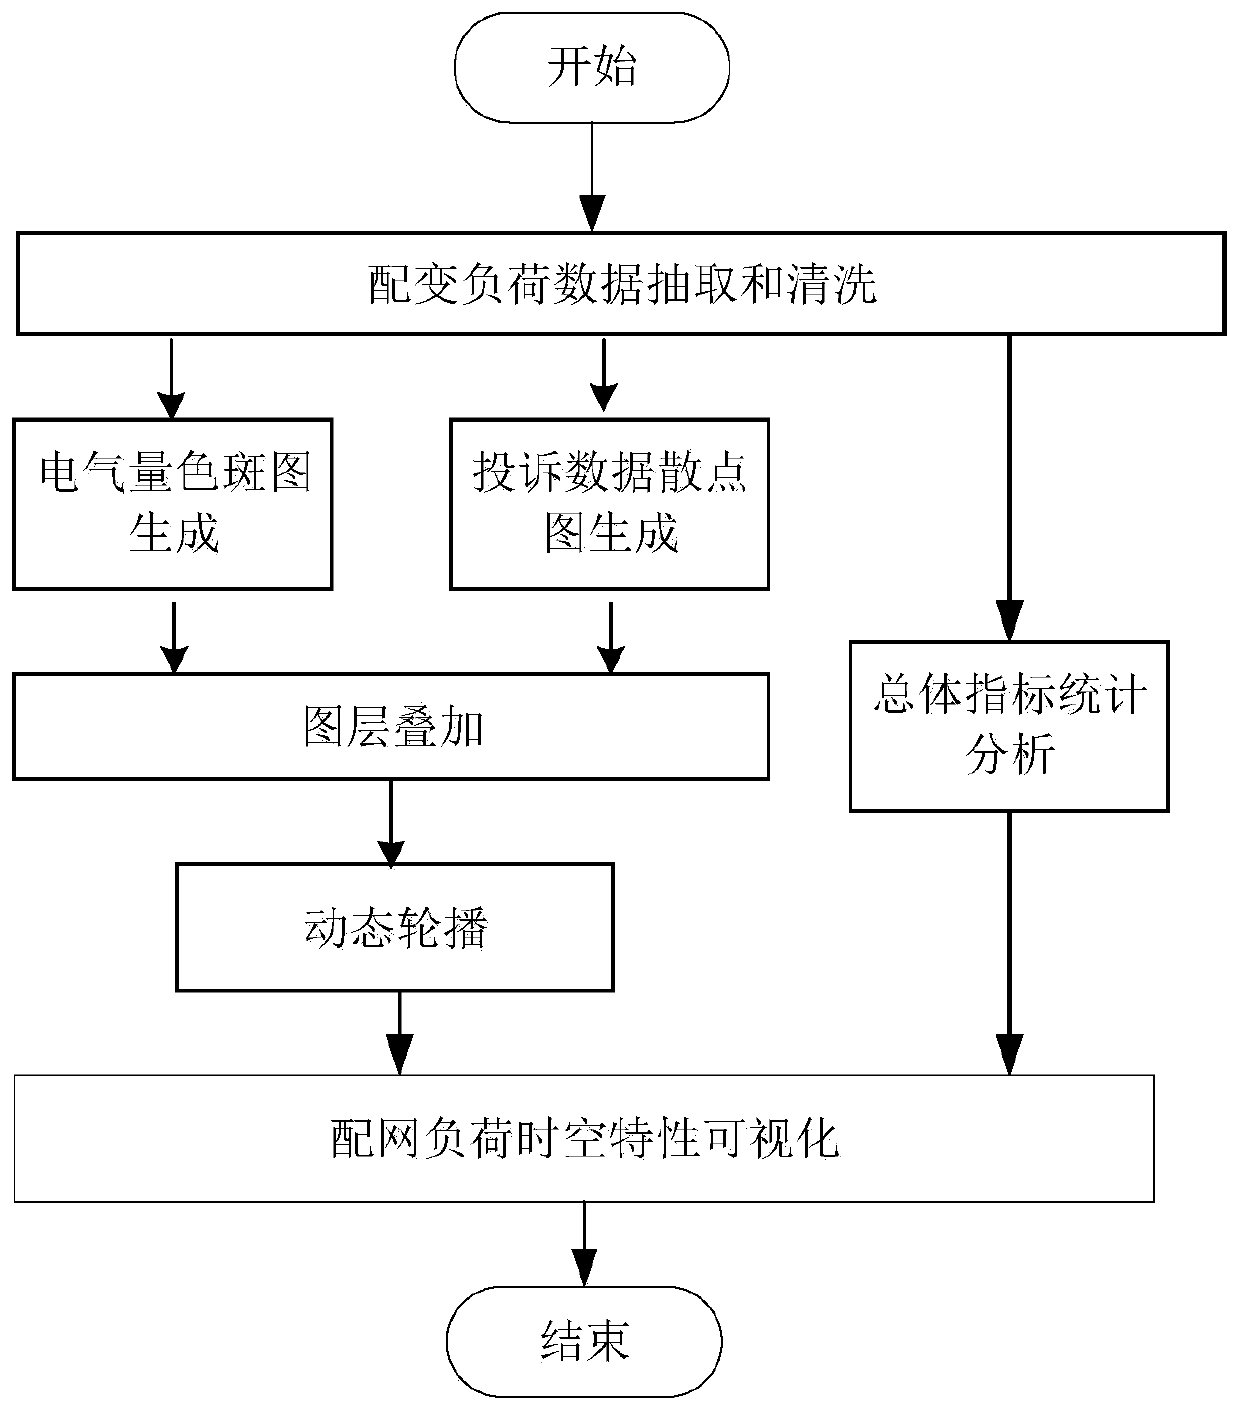
[0029] Such as figure 1 As shown, the present invention provides a method for visual analysis of distribution network load spatio-temporal characteristics, including the following steps:

[0030] (1) Modeling. According to the relationship between the load data, the load data table, the voltage qualification rate table and the complaint table are constructed in the relational database. See Table 1 to Table 3 for the table structure.

[0031] Table 1 Distribution transformer load data structure

[0032] data item name data item type data item length data time VARchar2 100 substation VARchar2 100 line VARchar2 100 user ID VARchar2 100 user name VARchar2 300 Metering point number VARchar2 100 Meter asset number VARchar2 100 maximum load NUMBE...


PUM


Abstract

The invention discloses a power distribution network load space-time characteristic visual analysis method which comprises the following steps: accessing power distribution transformer load characteristic data from a power distribution network service system, including electrical quantity data and complaint data, to form a power distribution network load characteristic data set; analyzing and processing the electrical quantity data by adopting a dynamic color spot pattern generation technology to form a color spot pattern vector layer file; a scatter diagram generation technology is adopted for complaint data, a map layer of a scatter diagram style is dynamically created, and the two map layers are displayed through a GIS front end; superposing the image layers to form a correlation analysis image taking the color spot image layer as a base image and the scatter image layer as a foreground; deploying a color spot image layer generation service on the GIS platform, and periodically generating a new color spot image layer; statistics and visual display are carried out on the overall indexes, and multi-dimensional sorting analysis is carried out on all the distribution transformer devices in the selected geographic area. According to the method, distribution network business personnel can conveniently interpret the load rate horizontal distribution condition in the area range andguide distribution network planning, transformation and electric energy quality treatment work.

Description

technical field [0001] The invention belongs to the field of distribution network management business and auxiliary signal decision-making, and particularly relates to a visualization method for distribution network load spatiotemporal characteristics, which is convenient for distribution network business personnel to interpret the distribution of distribution network power supply capacity and power supply efficiency within the area, and find out in time Weak points, guiding transmission and distribution network planning, transformation and power quality management. Background technique [0002] In recent years, the construction of domestic distribution network has developed rapidly, and the power supply capacity has been greatly improved. However, the auxiliary decision-making ability of distribution network planning and operation and maintenance is still insufficient, mainly reflected in: [0003] (1) The distribution network equipment lacks effective and reliable status a...

Claims


Application Information

Patent Timeline
Patent Type & Authority Applications(China)
IPC IPC(8): G06Q10/06G06Q50/06G06F16/29
CPCG06Q10/0639G06Q10/0635G06Q50/06
Inventor 胡剑锋潘玉春朱玉付张高峰蒋波
Owner NR ELECTRIC CO LTD
Why Eureka
Try Eureka