River peak discharge range calculation method

A technology of flood peak flow and calculation method, which is applied in the field of calculation of river peak flow range, can solve the problem of inaccurate calculation results of the moving flood peak flow of the rainfall center, and achieve an effect with reference value

Active Publication Date: 2021-08-17
CHINA INST OF WATER RESOURCES & HYDROPOWER RES
View PDF8 Cites 2 Cited by
  • Summary
  • Abstract
  • Description
  • Claims
  • Application Information

AI Technical Summary

Problems solved by technology

[0006] In order to solve the above-mentioned technical problems, the present invention proposes a method for calculating the range of the peak flow of a river, mainly to solve the problem that the calculation result of the peak flow may be inaccurate due to the uncertainty of the movement of the rainfall center when the rainfall forecast data in the research area is known.

Method used


Image

  • River peak discharge range calculation method
  • River peak discharge range calculation method
  • River peak discharge range calculation method

Examples


Embodiment 1

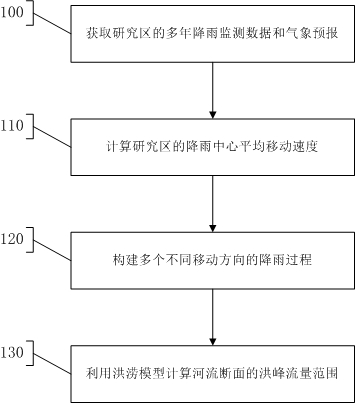
[0038] Such as figure 1 As shown, a method for calculating the range of river flood peak flow, step 100 is performed to obtain the multi-year rainfall monitoring data and weather forecast in the research area. The multi-year rainfall monitoring data includes at least M years of rainfall data in N fields that meet the screening conditions, where N≧100, and the screening conditions are that the rainfall exceeds 2.6 mm / hour and / or causes the river water level to rise by 5 cm. When the research area is located in an area with annual precipitation greater than 800 mm, M≧5; when the research area is located in an area with annual precipitation less than 800 mm, M≧10.

[0039] Step 110 is executed to calculate the average moving speed of the rainfall center in the research area. This step includes the following sub-steps:

[0040] Step 111, counting the rainfall center at each moment of each rainfall event.

[0041] Step 112, calculate the moving distance of the rain center and th...

Embodiment 2

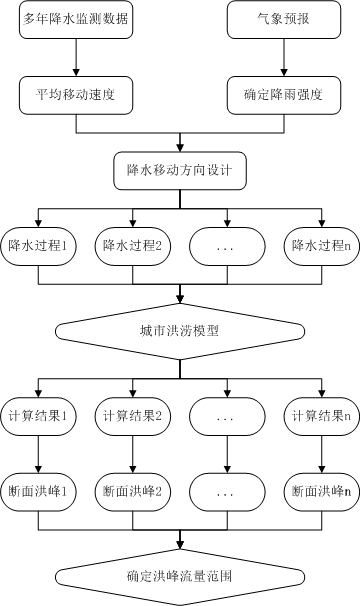
[0051] This paper constructs a river flood peak calculation method considering the direction of rainfall movement, and obtains a flood peak range, which can more accurately represent the flood risk of the river. The method flow is as follows figure 2 shown.

[0052] (1) Calculate the average moving speed of the rainfall center in the study area

[0053] It is necessary to collect historical rainfall monitoring data (intervals of 5 minutes) in the study area for many years, including at least N fields of large rainfall in M ​​years (in this example, N=100) (the southern region needs at least continuous M=5 years of data , at least M=10 years data in the north). Calculate the rainfall center of each rainfall at each moment, calculate the moving distance of the rainfall center and the rainfall time, and divide the two to obtain the rainfall moving speed. The moving speed of each rainfall event is averaged to obtain the average moving speed s of the study area.

[0054] (2) Co...

Embodiment 3

[0059] Taking the Shenzhen River Basin as the research area, such as the forecast of the meteorological department that "the rainfall of 70 mm in one hour will occur in the future weather forecast" as an example, the flood peak range of the river section is calculated.

[0060] (1) Calculate the average moving speed of the rainfall center in the study area

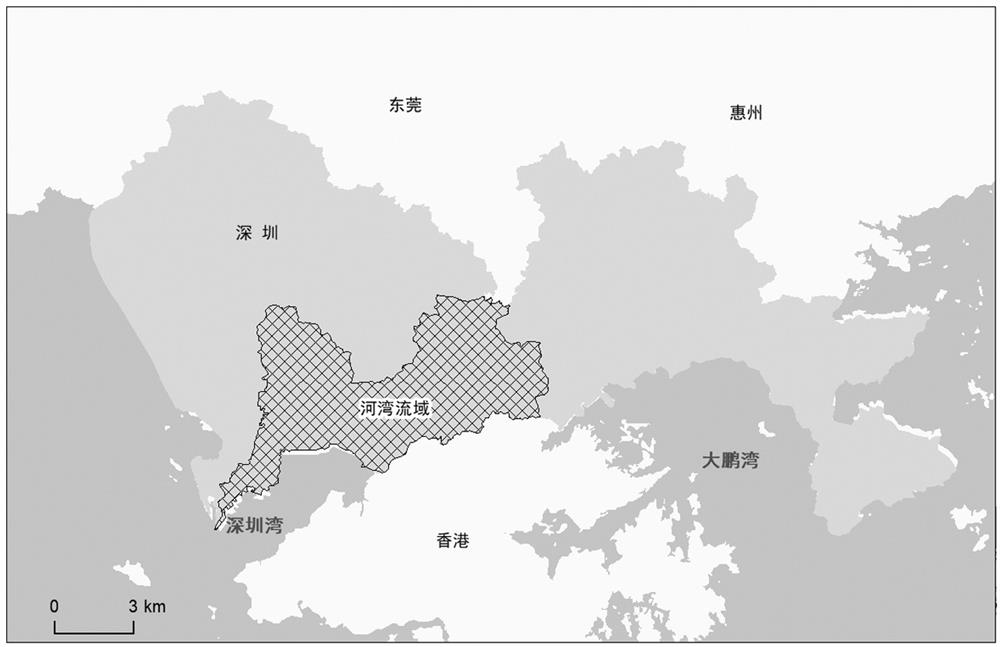
[0061] Such as image 3 As shown in , the river basin in the central area of ​​Shenzhen is selected as the research area. The Hewan area is located on the east side of the Pearl River Estuary, including the three urban centers of Nanshan, Futian, and Luohu, as well as Buji and Nanwan streets in Longgang District, with a total area of ​​293km². It is the earliest and most mature area in Shenzhen.

[0062] According to the 5-minute rainfall monitoring data statistics of 63 meteorological stations in Shenzhen from 2008 to 2018, the average moving speed of the rainfall center of all rainfall events is about 10km / h.

[0063] ...


PUM


Abstract

The invention provides a river peak flood flow range calculation method, and the method comprises the steps of obtaining multi-year rainfall monitoring data and weather forecast of a research area, and further comprises the following steps: calculating the average moving speed of a rainfall center of the research area; constructing a plurality of rainfall processes in different moving directions; and calculating the flood peak flow range of the river section through the flood model. The invention provides a river peak discharge range calculation method which mainly solves the problem that when rainfall forecast data of a research area is obtained, the uncertainty of rainfall center movement possibly causes the inaccurate peak discharge calculation result. According to the invention, the method comprises the steps: designing various possible rainfall center moving directions, calculating the flood peak flow in various moving directions, extracting the maximum value and the minimum value of the flood peak flow in the calculation result, i.e., the possible flood peak flow range, which can provide a more scientific reference basis for river risk evaluation.

Description

technical field [0001] The invention relates to the technical field of flood detection, in particular to a method for calculating the range of river flood peak flow. Background technique [0002] Urban torrential rain and flooding have intensified, and the risk of urban flooding continues to rise. The measured data show that the spatio-temporal heterogeneity of urban heavy rainfall is becoming more and more obvious, the spatial difference of rainfall is increasing, and the time history distribution is more concentrated. The spatiotemporal inhomogeneity of the rainfall process is one of the main factors affecting the inaccuracy of urban river flood forecasting. When the meteorological department issues a rainstorm warning or rainfall forecast, it generally gives the amount and intensity of rainfall, such as: "100 mm of rain in a certain area of ​​a city in the next 3 hours", or "there will be a rainstorm in the city in the next 6 hours", etc. Then, according to the weather ...

Claims


Application Information

Patent Timeline
Patent Type & Authority Applications(China)
IPC IPC(8): G06Q10/04G06Q50/26
CPCG06Q10/04G06Q50/265Y02A10/40
Inventor 刘业森刘媛媛杜晓鹤臧文斌李敏李匡刘舒刘金钊
Owner CHINA INST OF WATER RESOURCES & HYDROPOWER RES
Why Eureka
Try Eureka