
Computerized method, process and service for stock investment timing

a technology of stock market price and computerized method, applied in the direction of electric digital data processing, buying/selling/lease transactions, instruments, etc., can solve the problems of stock market price data hardly following any known mathematical or technical theory, and is considered as difficult or impossible to succeed

Inactive Publication Date: 2002-07-25
STOCKMAPPER
View PDF1 Cites 80 Cited by
  • Summary
  • Abstract
  • Description
  • Claims
  • Application Information

AI Technical Summary

Benefits of technology

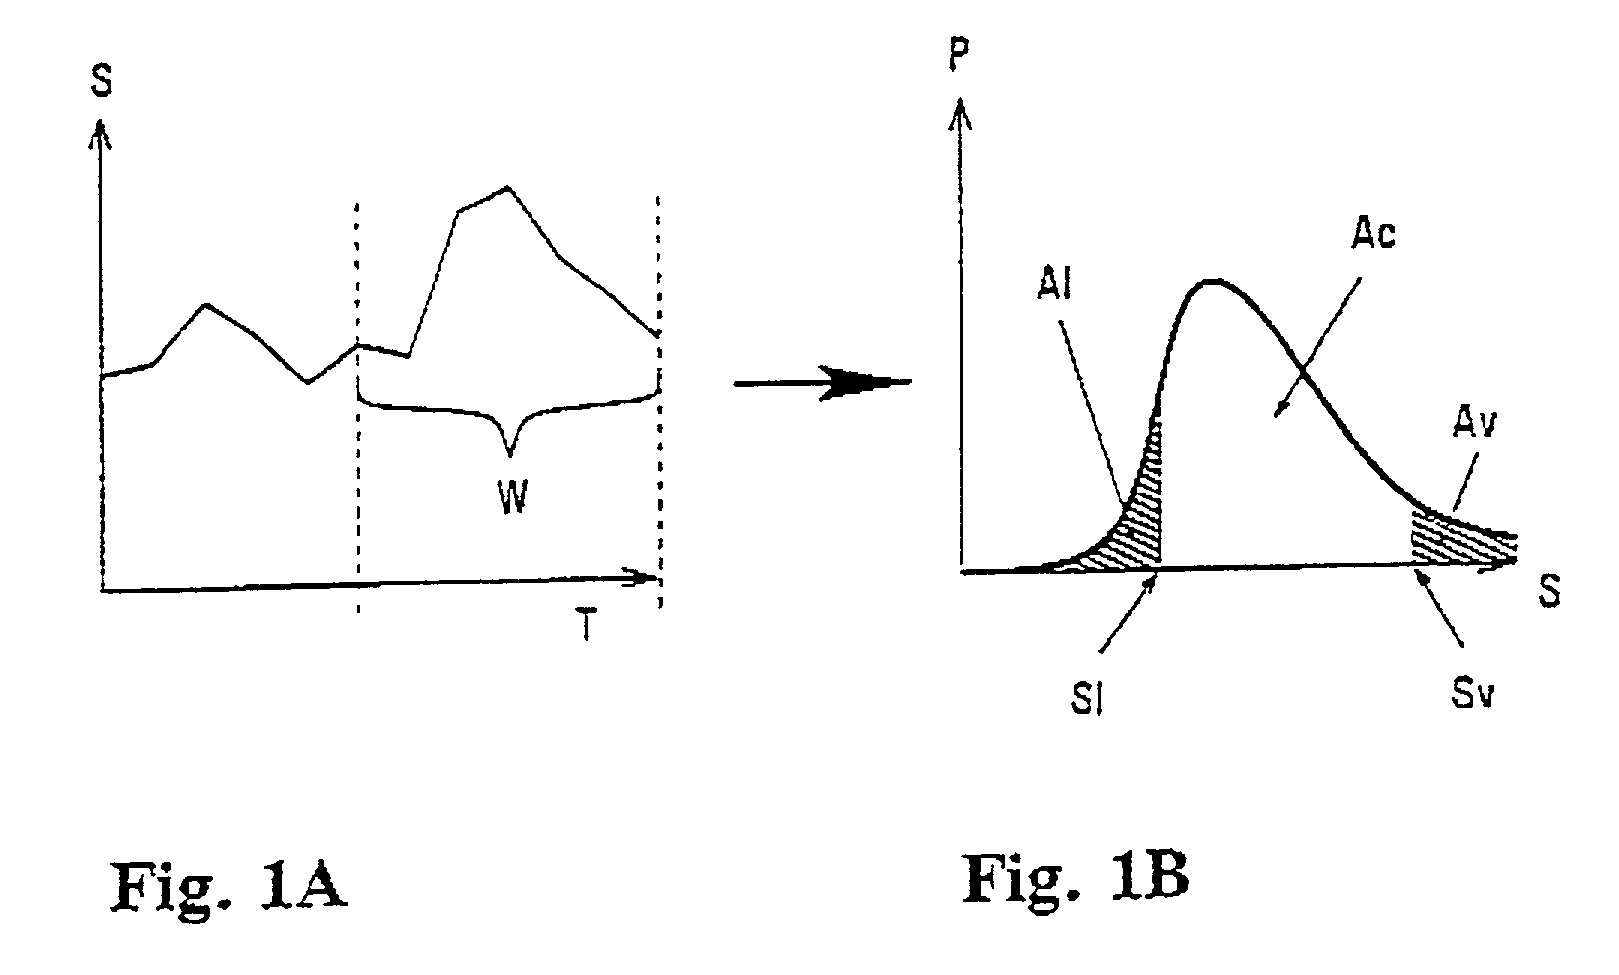
[0005] It is an object of the present invention to provide for a new, stock investors supporting method which is readily usable for making a buy / sell decision preferably having the ability of easily calculation with an individual risk profile, and obviating at least part of the disadvantages of the known methods. It is a further object of the invention to provide a service which runs the process daily for at least one of all the major stock exchanges in the world. The invented method differs from the known methods in that it takes advantage of the known history of the share price and compares the current price to the history from statistical mathematics point of view. This enables categorizing the share current price into three different classes: high (sell), moderate (hold) and low (buy). Still, although perfect market timing cannot be promised, also not by using the recommendations of the method according to the invention, the least achieved by using the new method is that bad timings, e.g. to buy with the peak expensive price or to sell with the lowest possible price, are not anyhow possible at least are now revealed in a very favourable and understandable manner. Moreover, the new method renders it highly probable to achieve a considerable improvement to the investment gains in the long run.
[0006] The new method eases market timing, viz. when to buy or sell which shares. In a relatively readily understandable manner closely associated with comparing actual share price is buy and sell limits derived from historical data analysis based on a new philosophy utilising probability calculations from the wavelength field.

Problems solved by technology

Manually that is more or less an impossible task because of high number of firms listed in a typical stock market.
Perfect market timing is in stock investments an adored goal but without insider information of the firms it is considered as very difficult or impossible thing to succeed.
However, stock market price data hardly follow any known mathematical or technical theory because they are heavily dependent on psychological phenomena e.g. sometimes caused by mass hysteria of the investors as feedback to some surprising stock bulletin.
Another drawback of known technical analyses systems is that, though it can give a plenty of information or pseudo information, it typically requires heavy human interaction to interpret the calculated figures.
This does not help to solve the original problem abundance of stock market information available, any further.

Method used


Image

  • Computerized method, process and service for stock investment timing
  • Computerized method, process and service for stock investment timing
  • Computerized method, process and service for stock investment timing

Examples


example implementation

of the Generic Model Utilising an Existing WWW-Service

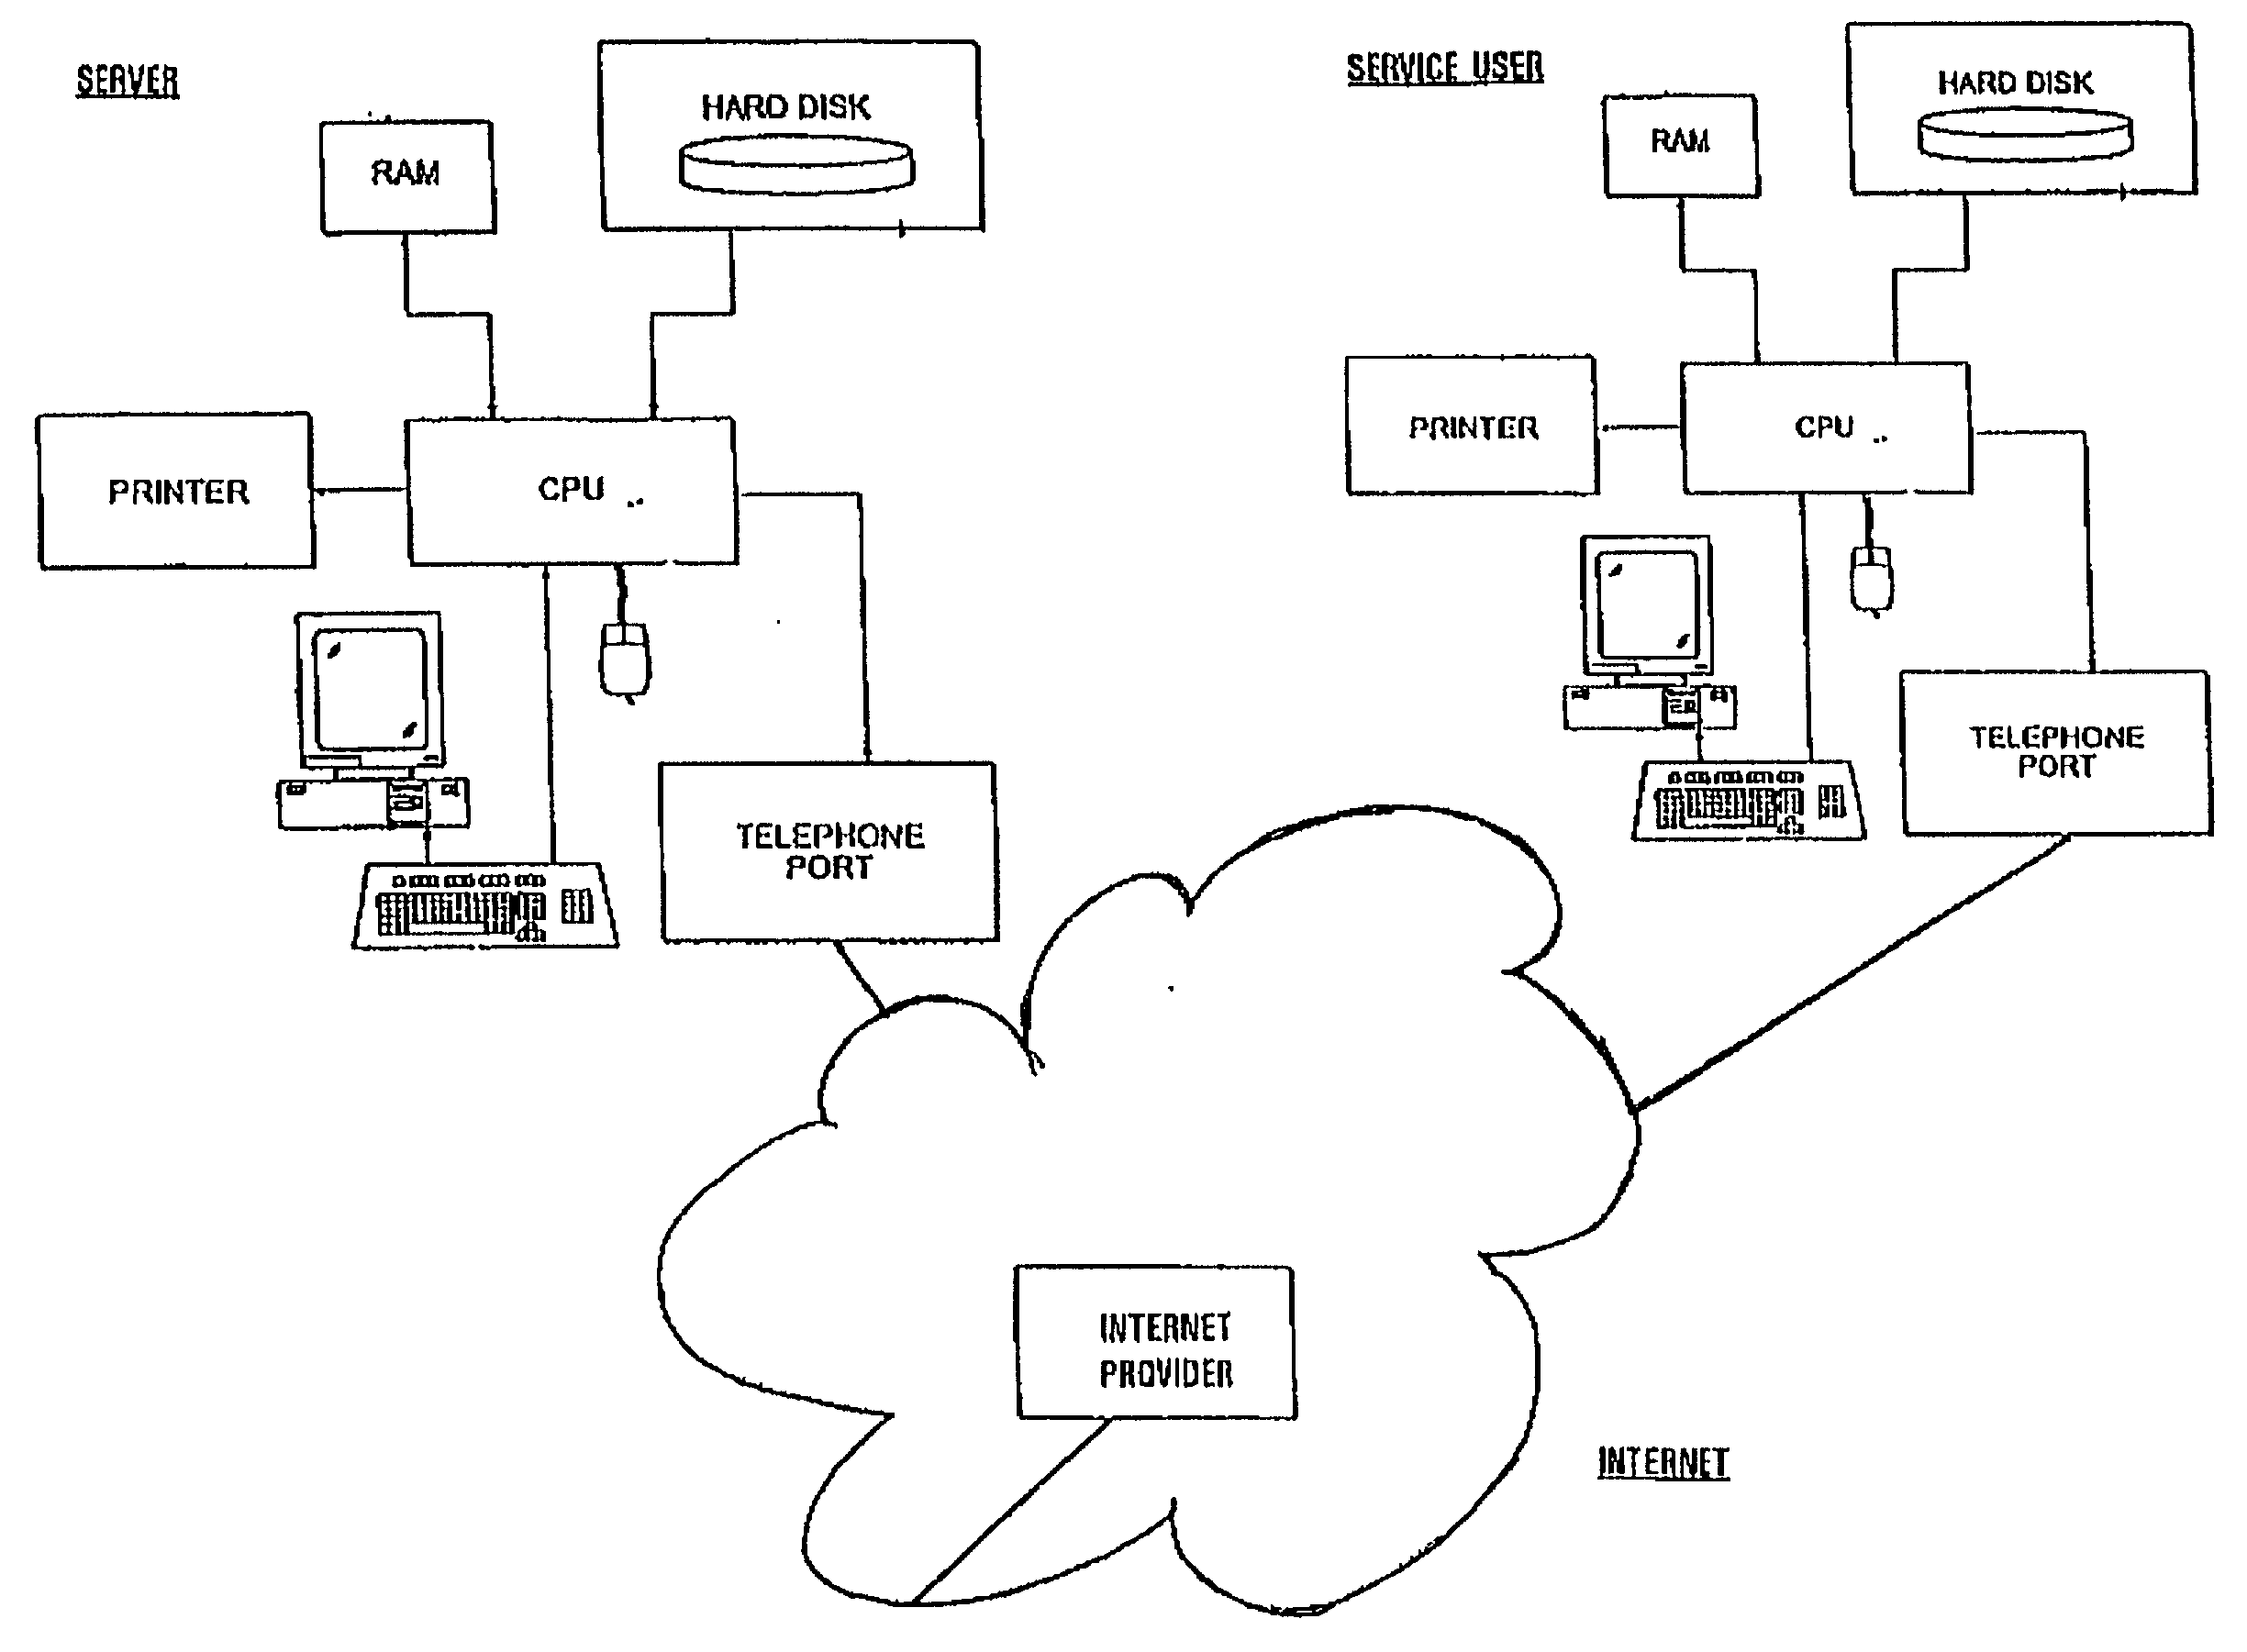
[0060] The Helsinki Stock Exchange (HEX) last closed information of all listed securities from the URL of HEX website or other available stock price data provider is downloaded after each stock day. The information is typically in unsuitable format for numerical calculation in this phase and it is denoted as being in a raw format, typically in HTML format.

[0061] The raw data is converted into suitable numeric data for calculations by a parser function suitable for HEX. This involves string manipulations commonly known and available from handbooks.

[0062] The data are appended to the previously gathered files which exist one per security. This is e.g. performed by a simple append function, implemented in TCL.

[0063] The following steps are repeated for each security.

[0064] The dominating frequency component is determined from the price data and use the corresponding wavelength, i.e. period, as the history window for the security.

[00...

examples of performance statistics

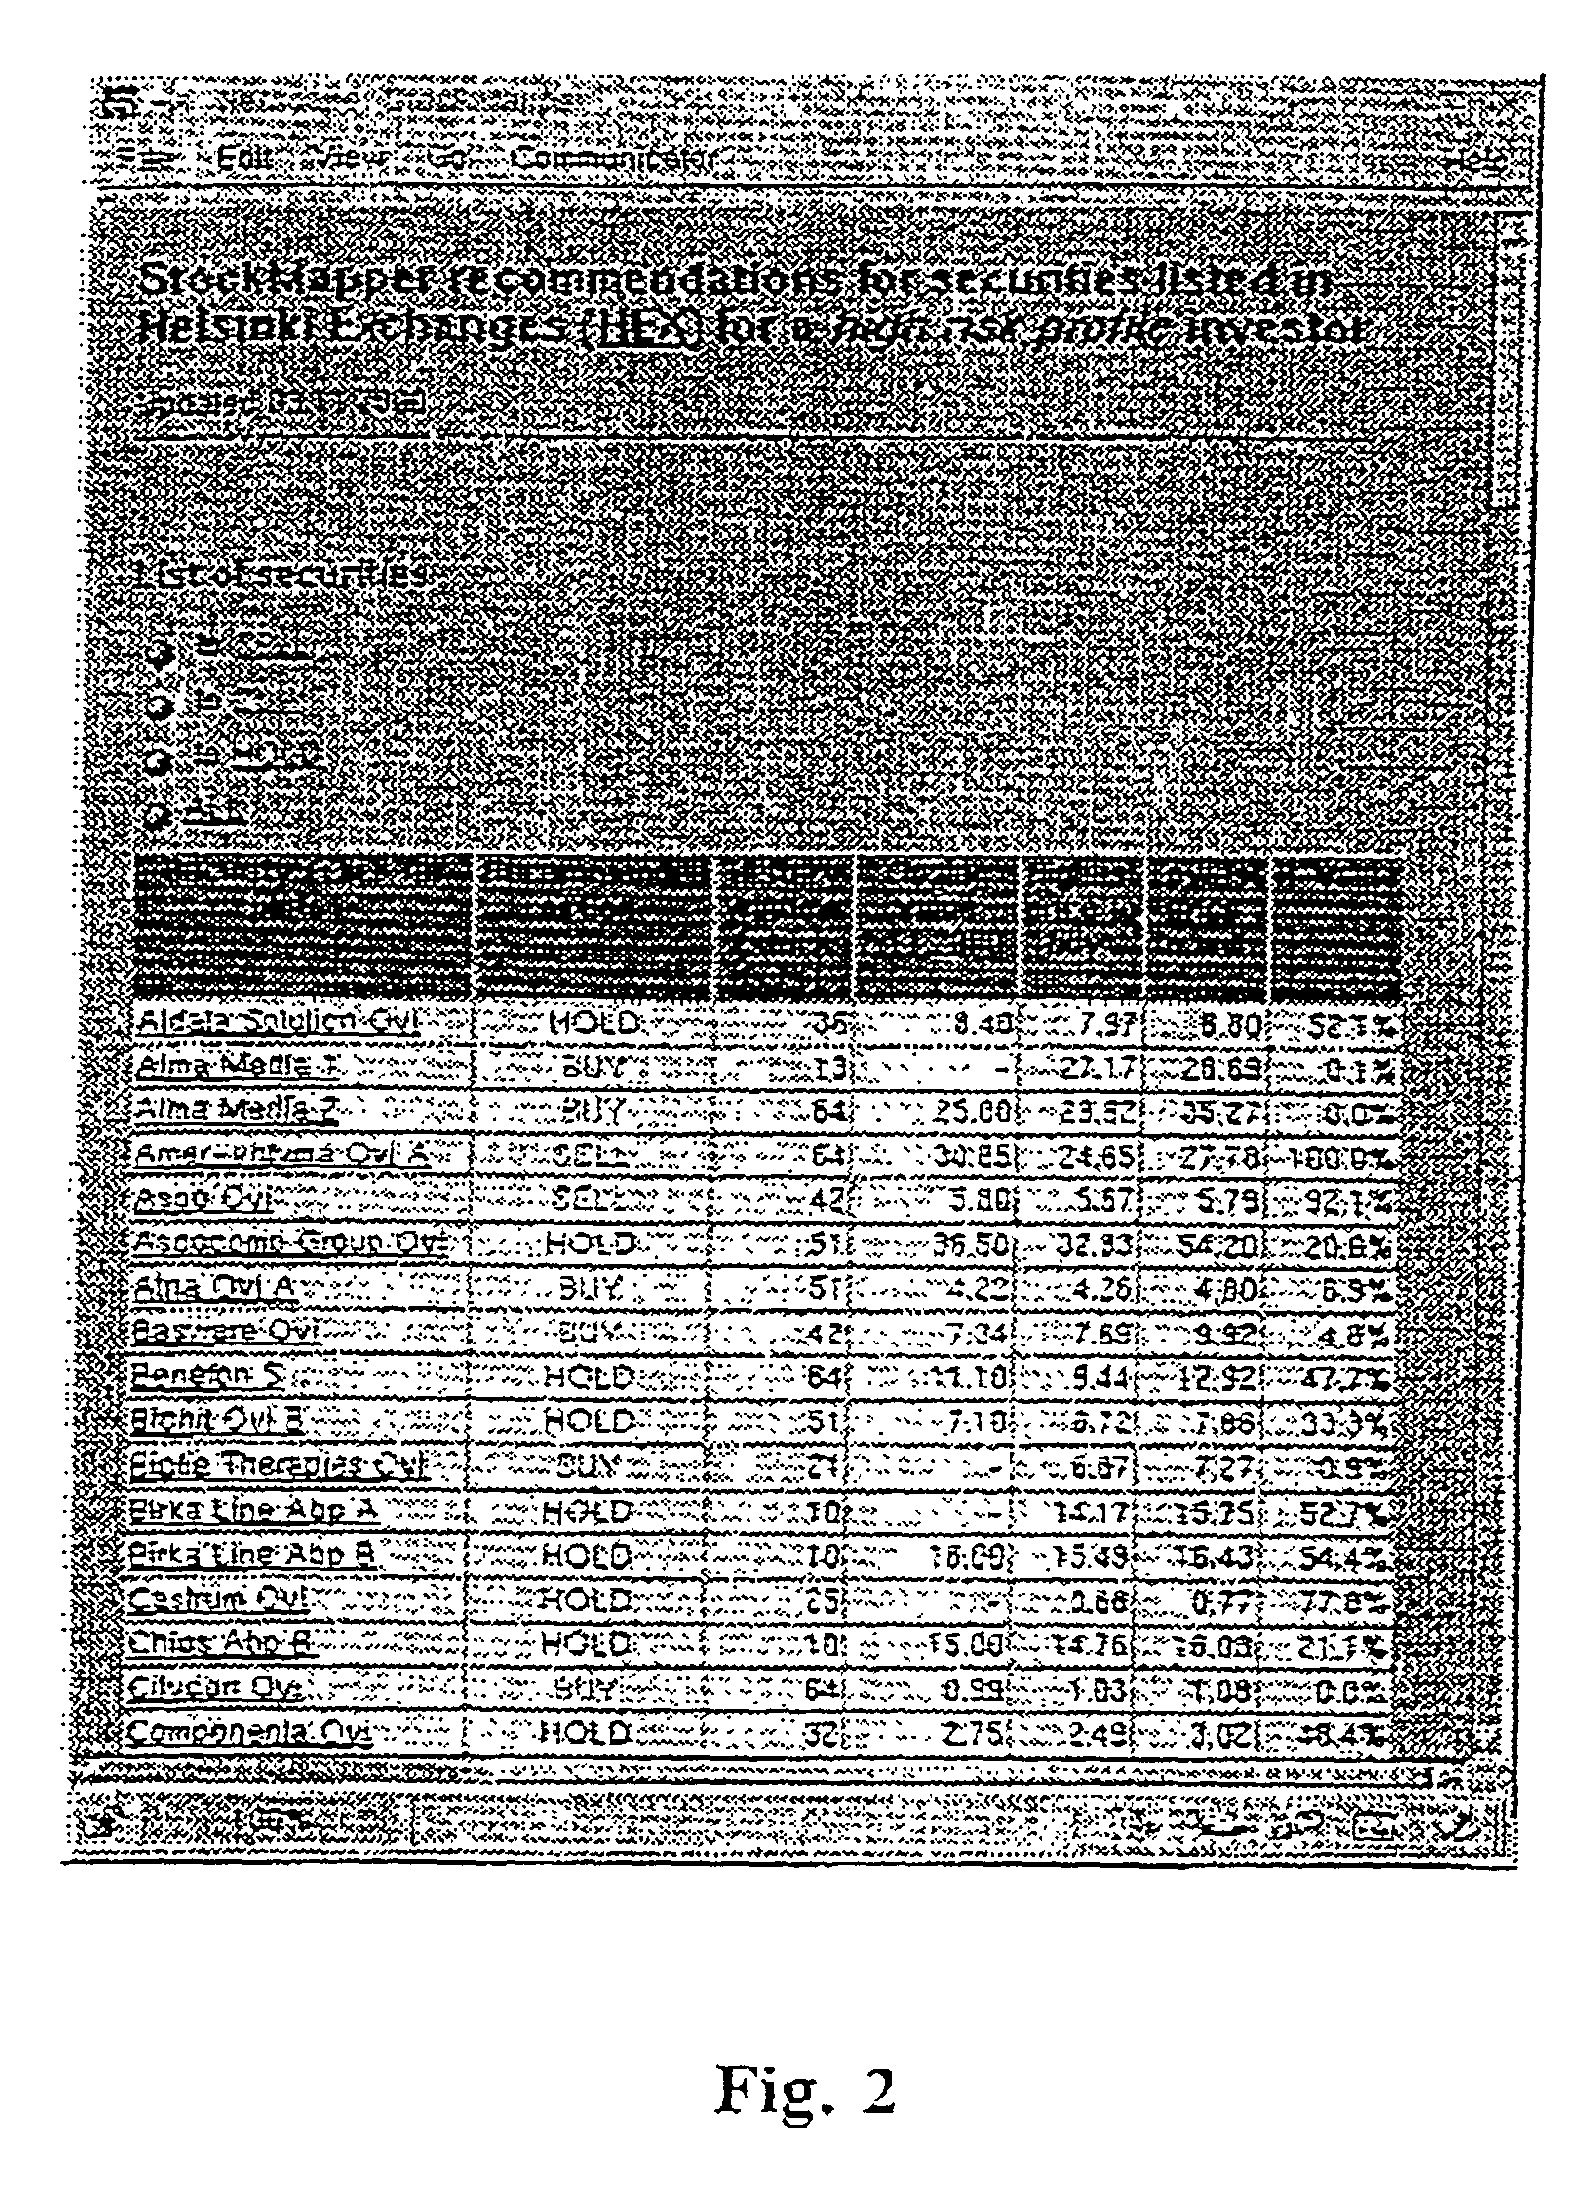
[0082] The service has an implementation of one investing strategy in a form of a simulated and daily updated table for both investor profiles and all the securities listed in HEX. These tables are meant to serve as performance statistics of the recommendations. The chosen strategy is the second one in the list of the previous section, viz. it is assumed that the client buys one lot of a share each day when the recommendation is `buy` and sells one lot each day when the recommendation is `sell`, respectively. Furthermore, a broker fee of 0.25% of the value of each transaction is assumed to be charged. A screen-shot is provided in FIG. 5.

[0083] The performance statistics clearly show that for a big majority of the securities to follow and investing according to the recommendations would result in substantial increase in realized profit when compared with share price change over the simulated period.

[0084] For a typical stock day (3.11.2000) of HEX, conclusions of the simulated result...


PUM


Abstract

The invention is in the field of using a computer implemented method to calculate and provide recommendations for stock share investment timing. The process gathers price and volume data of listed firms from as many stock markets as implemented, only condition being that those markets price data are available over the Internet, in order to be able to automate the process. Analysing and calculation methods used within the process differ from those used in typical technical stock analyses in that the invention takes advantage of the known price history and uses statistical mathematics to categorize the current price to a recommended action: "sell', "buy' or "hold', while the most famous technical analysing methods typically try to predict the share price in the near future. The clear benefits of the process are that, after being set up properly, the process does not need human intervention, except in rare special cases, and furthermore, the calculated results are very easy to interpret even by persons without much experience in stock investing. Performance statistics clearly show that remarkable increase in profit of stock share investments can be gained by using the recommendations. The method has been implemented in a form of WWW-service and it is usable globally via the Internet. The method has been donated as StockMapper.

Description

[0001] The invention relates generally to the field of stock investment timing management. More particularly, the present invention relates to a computerized method for supporting stock inventors in the decision making process, including a calculation process for obtaining daily recommendations (as buy, sell, hold) for all listed securities of all stock markets accessible via the Internet inventors as well as a method of making the same available to stock investors.BACKGROUND AND OBJECT OF THE INVENTION[0002] Interest toward investing to stock shares has increased rapidly worldwide during 1990's. This has caused that masses of people would like to have a means to filter out the meaningful information from the enormous volume of stock price data available nowadays. Manually that is more or less an impossible task because of high number of firms listed in a typical stock market. In order to tackle this problem, an invention to filter out and take advantage of small variations (volatil...

Claims


Application Information

Patent Timeline
IPC IPC(8): G06Q30/06
CPCG06Q30/0601G06Q40/04G06Q40/06
Inventor NARUMO, TIMO J.
Owner STOCKMAPPER
Learn More