
Incremental plotting of network topologies and other graphs through use of markup language

a graph and network topology technology, applied in the computer field, can solve the problems of wasting processing resources, affecting the visualization effect, so as to facilitate the incremental graph plotting and save processing resources

Inactive Publication Date: 2006-08-17
CISCO TECH INC
View PDF12 Cites 68 Cited by
  • Summary
  • Abstract
  • Description
  • Claims
  • Application Information

AI Technical Summary

Benefits of technology

This approach minimizes processing resource utilization and network bandwidth usage by avoiding redundant data retrieval and plotting, allowing for clear and concise visualization of network topologies and other graphs, enabling efficient interaction and display of dynamic network information.

Problems solved by technology

Hence, it becomes even more difficult to determine and specify an optimal screen location for a node, and to avoid crossing connections.
If these challenges are not overcome, the result is often a congested graph, which is difficult to view and interpret, or a very large graph whereby a user must perform many scroll and zoom operations to view desired information.
Furthermore, when displaying a large graph or network topology, rendering all of the entities or network nodes is a waste of processing resources and a waste of display screen space.
Displaying the entire network topology is not practical, and is analogous to unfolding an entire city map when only cross street information is wanted.
In addition, when a user is viewing a displayed graph focusing only on a first entity or node, and wants to view the nodes connected to a secondary node, requiring retrieval from a data source (for example, a network management system) of all of the information associated with the first node and the secondary node is a waste of network bandwidth.
Although a web browser is often used for displaying network topologies and might be the most logical interface from a software design perspective, most markup languages (e.g., HTML) fail to efficiently serve this purpose.
That is, they were not designed for incrementally plotting and displaying large, dynamic network topologies, but rather static text and images.
In addition, transmitting an image file to a browser is a demand on network bandwidth.

Method used


Image

  • Incremental plotting of network topologies and other graphs through use of markup language
  • Incremental plotting of network topologies and other graphs through use of markup language
  • Incremental plotting of network topologies and other graphs through use of markup language

Examples


Embodiment Construction

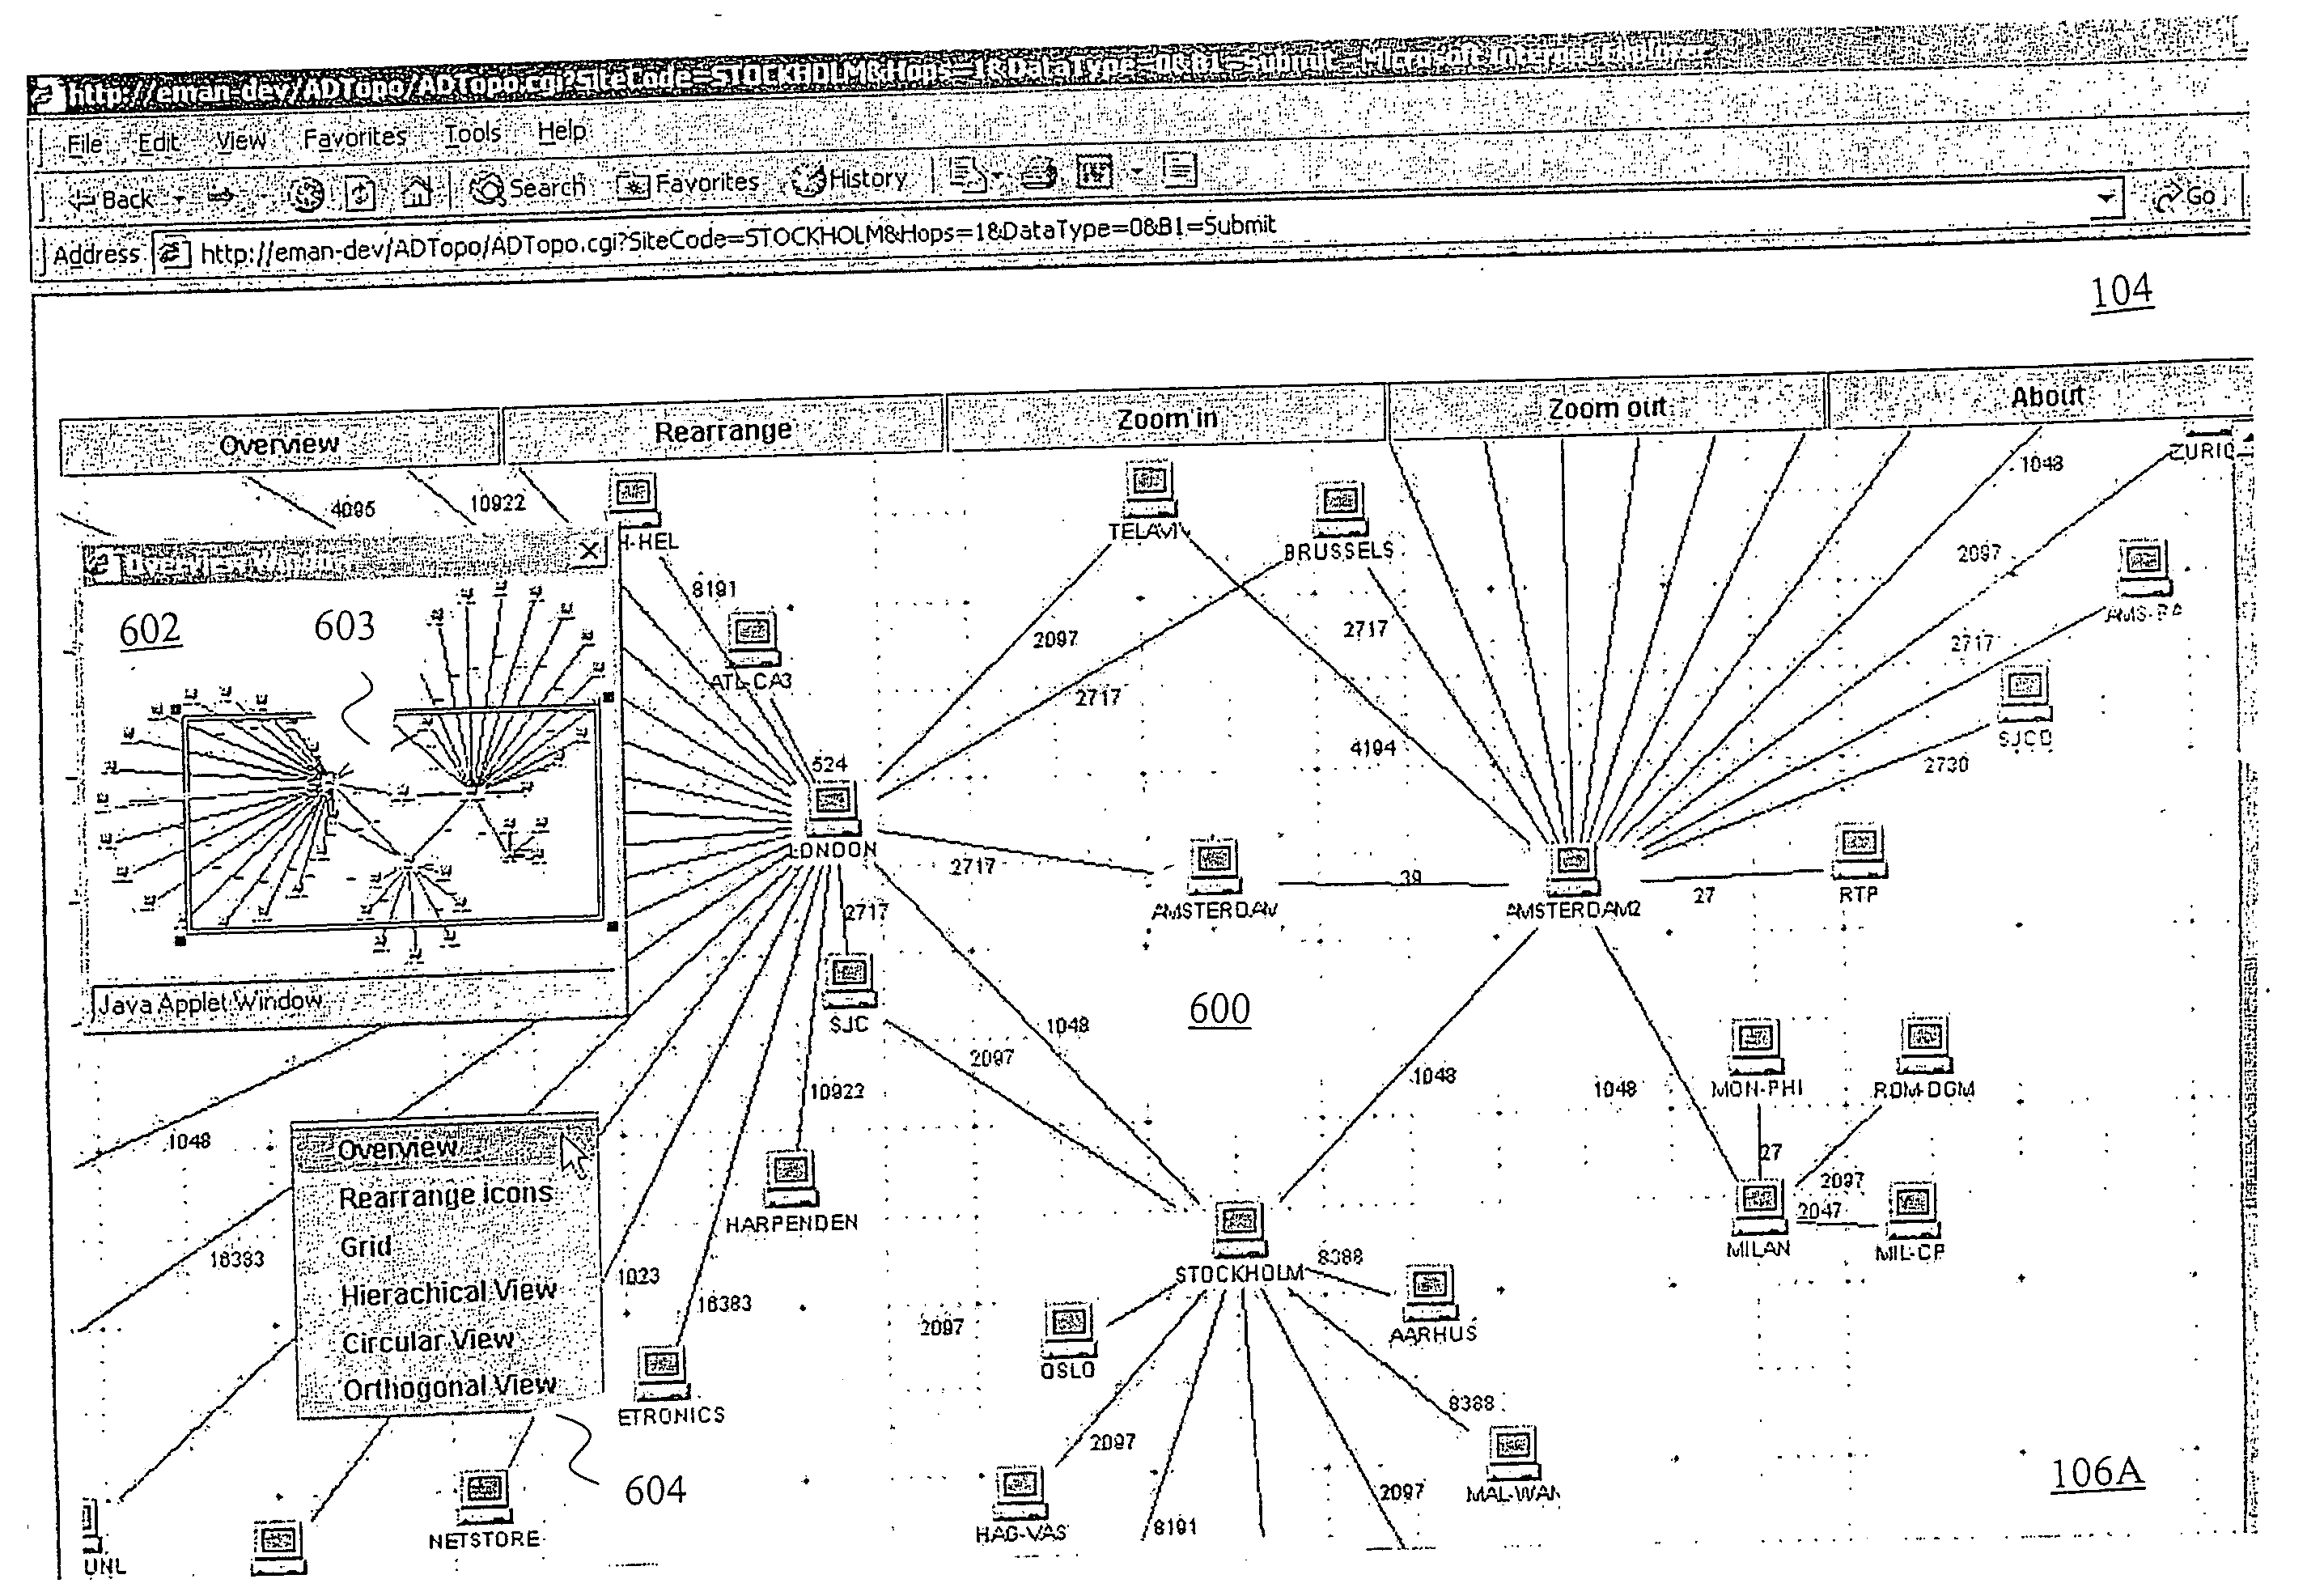
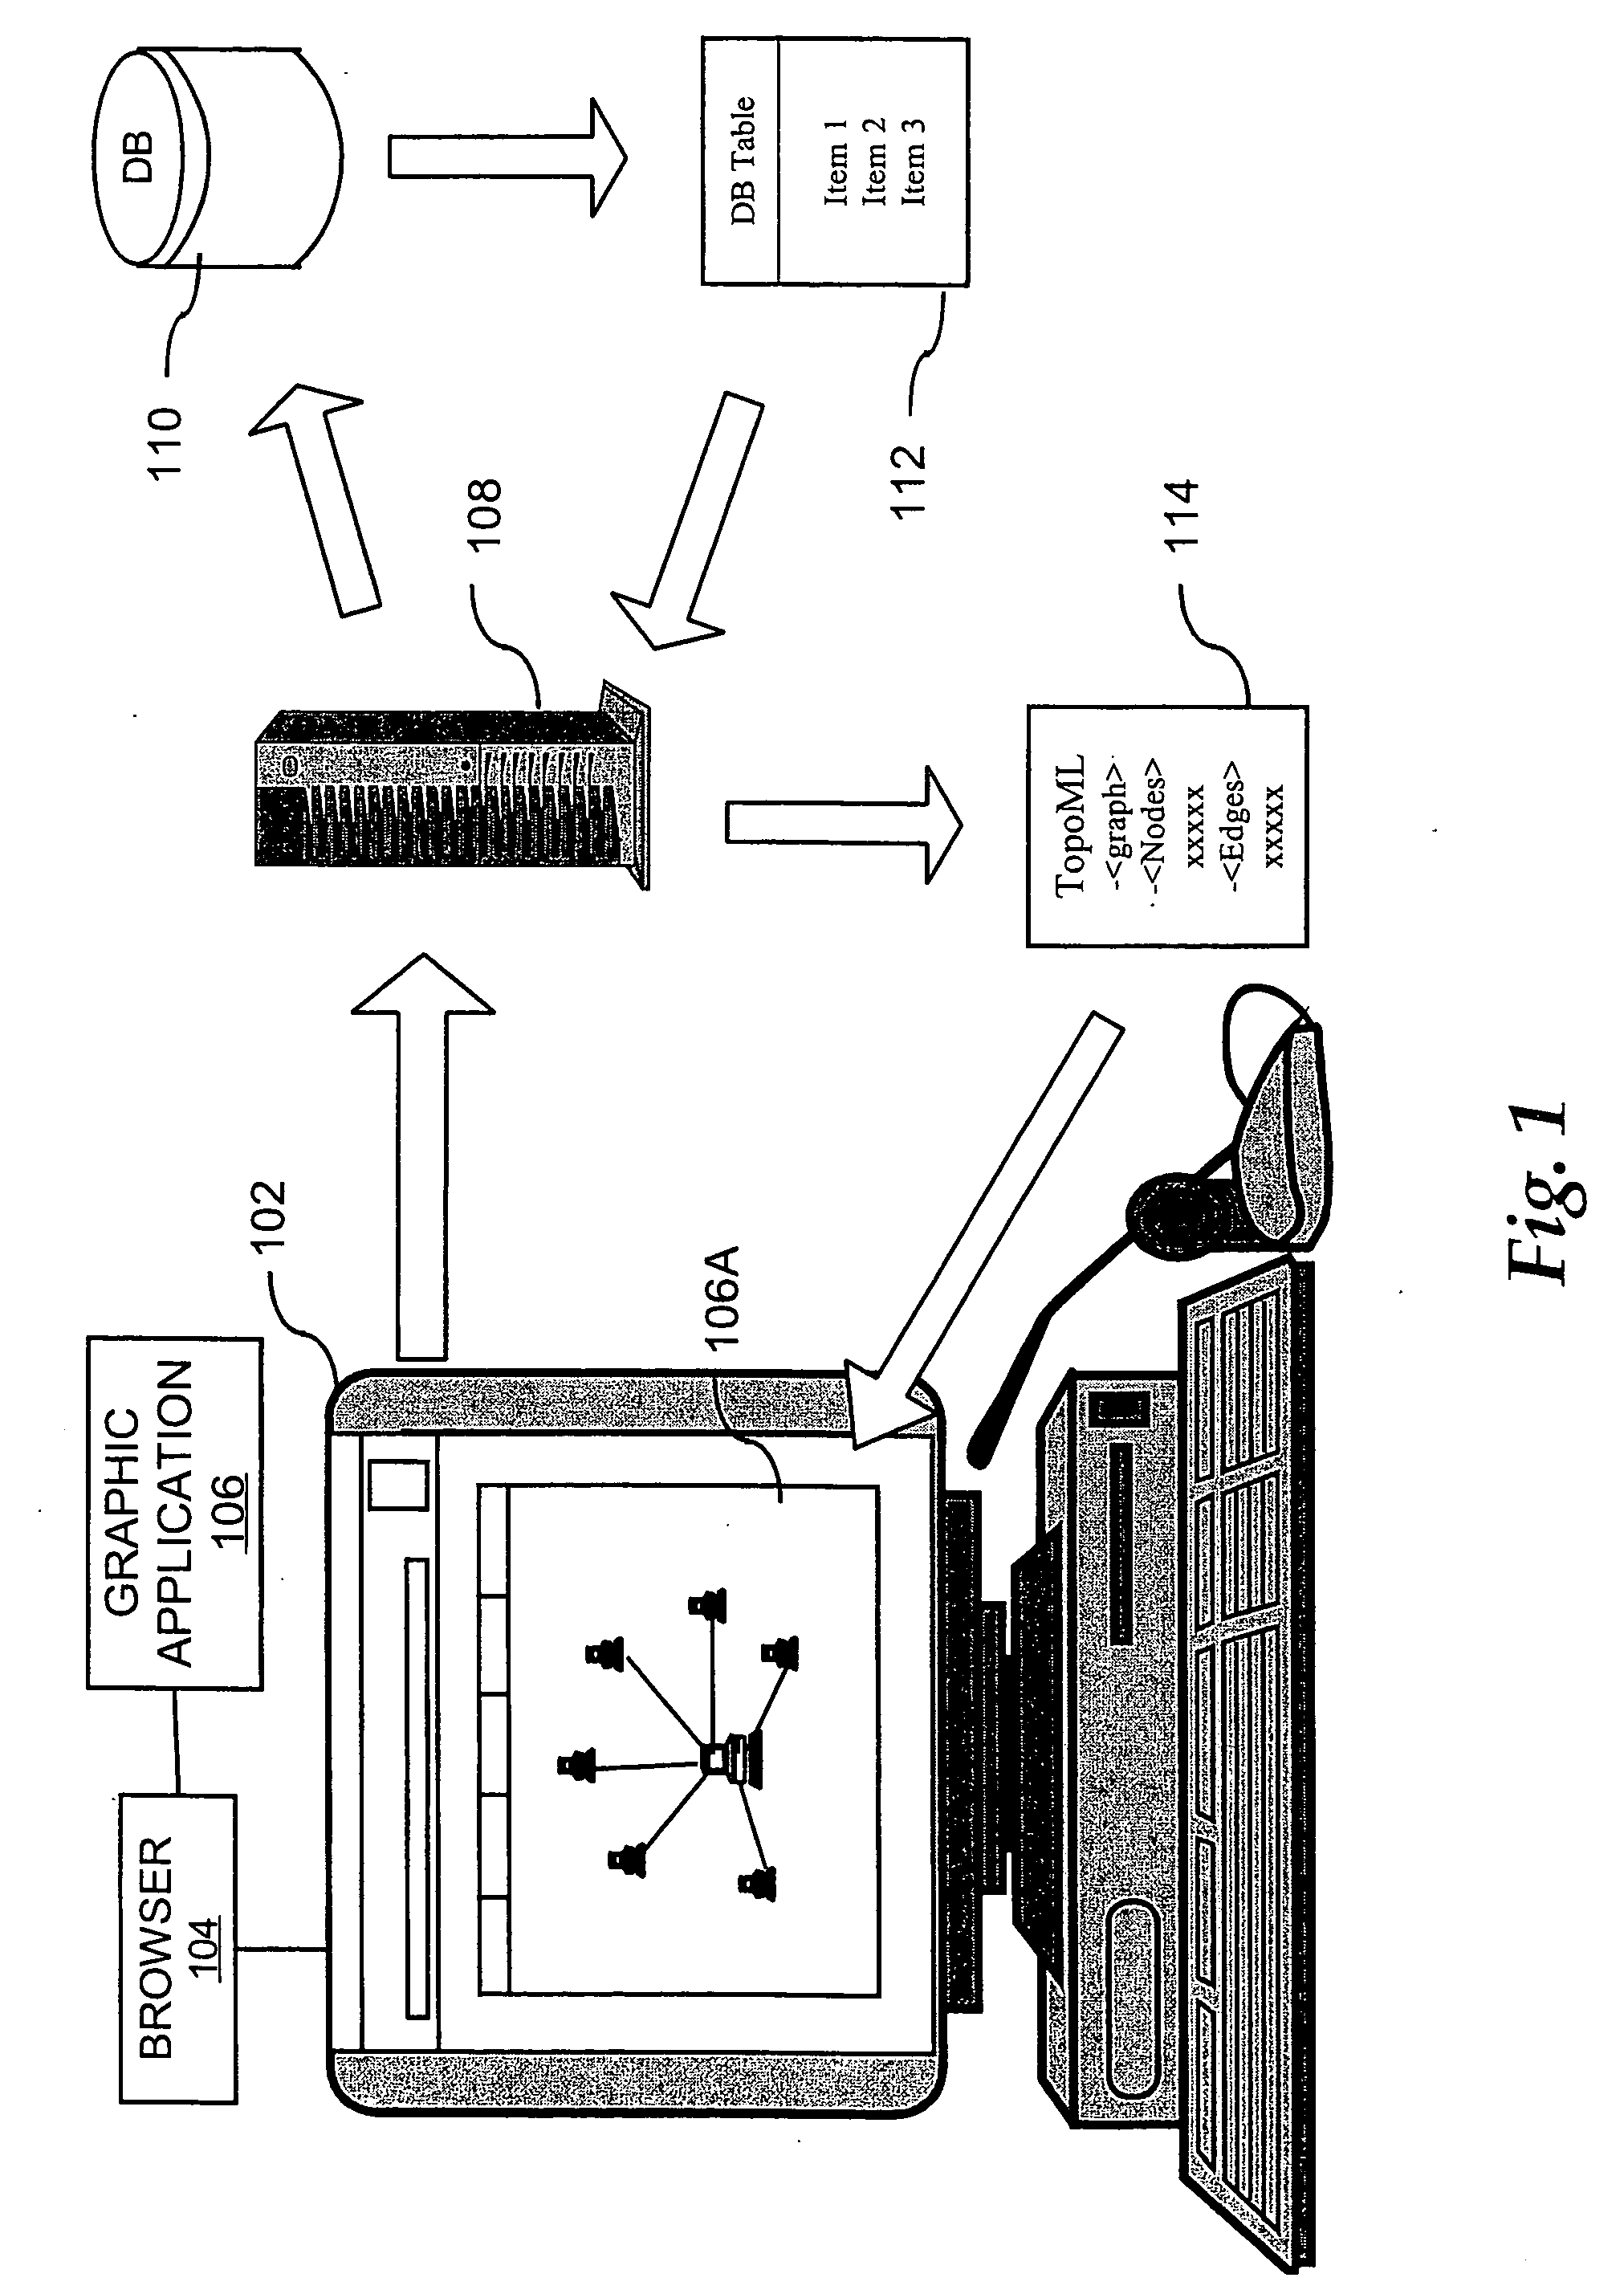
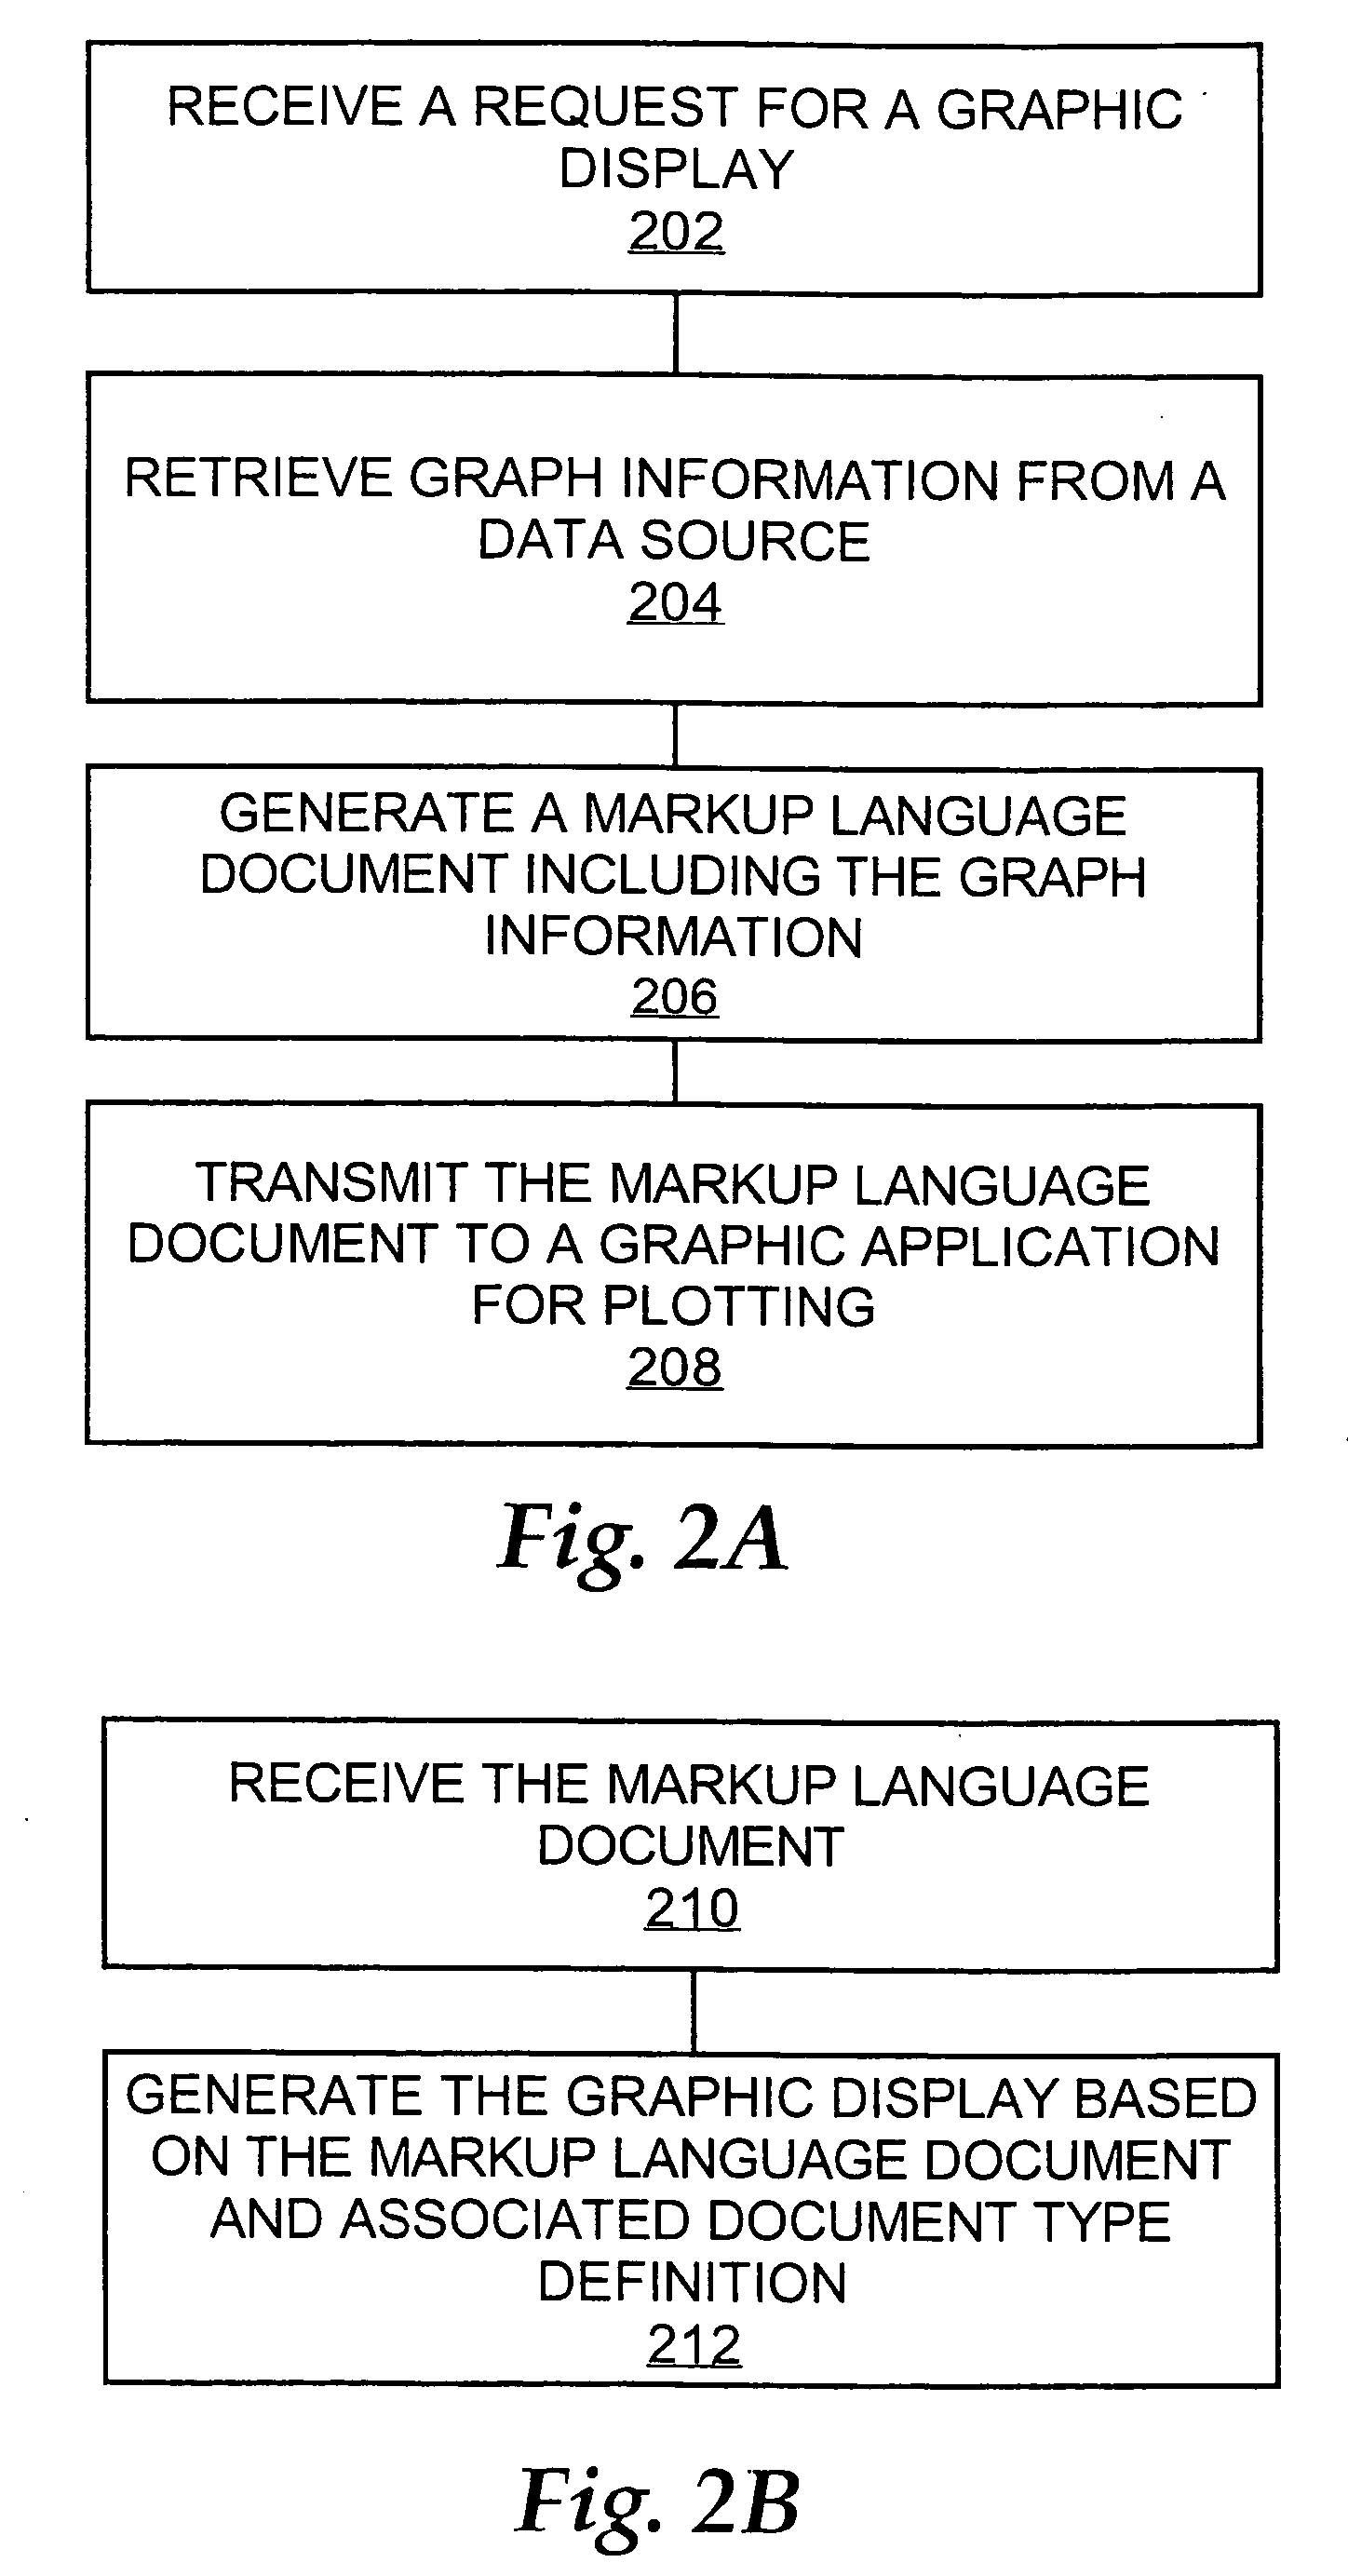
[0020] A method for plotting a graph using a markup language is described. An aspect of the method is used to plot a network topology.

[0021] In the following description, for the purposes of explanation, numerous specific details are set forth in order to provide a thorough understanding of the present invention. It will be apparent, however, that the present invention may be practiced without these specific details. In other instances, well-known structures and devices are shown in block diagram form in order to avoid unnecessarily obscuring the present invention.

[0022] In view of the shortcomings described above in relation to laying out and plotting network topologies simply, clearly and efficiently, a method for incrementally plotting a network topology is highly desirable.

[0023] The present invention comprises, in one aspect, a method for incremental plotting of network topologies and other graphs. Other aspects and features of the invention will become apparent from the fol...


PUM


Abstract

Plotting a graph using a markup language comprises receiving a request to generate a display of a graph of nodes connected by links and focused on a first entity; retrieving first graph information describing the first focus entity and first nodes and links to the first entity; creating a first markup language document with the first graph information, which when rendered in a display causes plotting the first entity and first nodes and links; receiving a request to change the display to focus on a second entity; retrieving second graph information describing only second nodes and links to the second entity; creating a second markup language document that contains only the second graph information and which when rendered causes plotting both the first focus entity and the second focus entity without repeated rendering of the first markup language document.

Description

CROSS-REFERENCE TO RELATED APPLICATIONS; PRIORITY CLAIM [0001] This application claims domestic priority under 35 U.S.C. 120 as a Continuation of prior application Ser. No. 09 / 905,306, filed Jul. 13, 2001, the entire contents of which are hereby incorporated by reference for all purposes as if fully set forth herein.FIELD OF THE INVENTION [0002] The present invention generally relates to computers, and more specifically to methods for plotting network topologies and other graphs. BACKGROUND OF THE INVENTION [0003] Plotting and displaying graphs on a computer display screen is often a rigorous process, requiring the specification of the location (i.e., x-y coordinates) of each entity on the display screen. The demands involved with plotting graphs are especially evident when plotting network topologies. The optimal viewing location of a node of interest is dependent on the number of connections the node has to other nodes. In addition, the number of nodes and connections associated w...

Claims


Application Information

Patent Timeline
Patent Type & Authority Applications(United States)
IPC IPC(8): G06T11/20
CPCH04L41/0253H04L41/12H04L41/22
Inventor GOLDSCHMIDT, CASSIO BRUN
Owner CISCO TECH INC
Learn More