Efficient imagery exploitation employing wavelet-based feature indices

a technology of feature indices and wavelet-based images, applied in scene recognition, instruments, computing, etc., can solve the problems of inability to self-determine or self-calibrate, computationally intensive, and thus expensive, and is not practicable to analyze manually

Inactive Publication Date: 2007-02-08
US ARMY CORPS OF ENGINEERS
View PDF16 Cites 85 Cited by
  • Summary
  • Abstract
  • Description
  • Claims
  • Application Information

AI Technical Summary

Problems solved by technology

Multispectral and hyperspectral images are composed of amounts of data that are impractical to analyze manually.
In general, conventional region-based segmentation is performed on an image within but a single spectral band, follows well-defined mathematical decision rules, is computationally intensive, and thus expensive, and is not self-determining or self-calibrating.
While it capitalizes on economy of computation, it may select incorrect features and apply incomplete information sets in the recognition

Method used


Image

  • Efficient imagery exploitation employing wavelet-based feature indices
  • Efficient imagery exploitation employing wavelet-based feature indices
  • Efficient imagery exploitation employing wavelet-based feature indices

Examples


example i

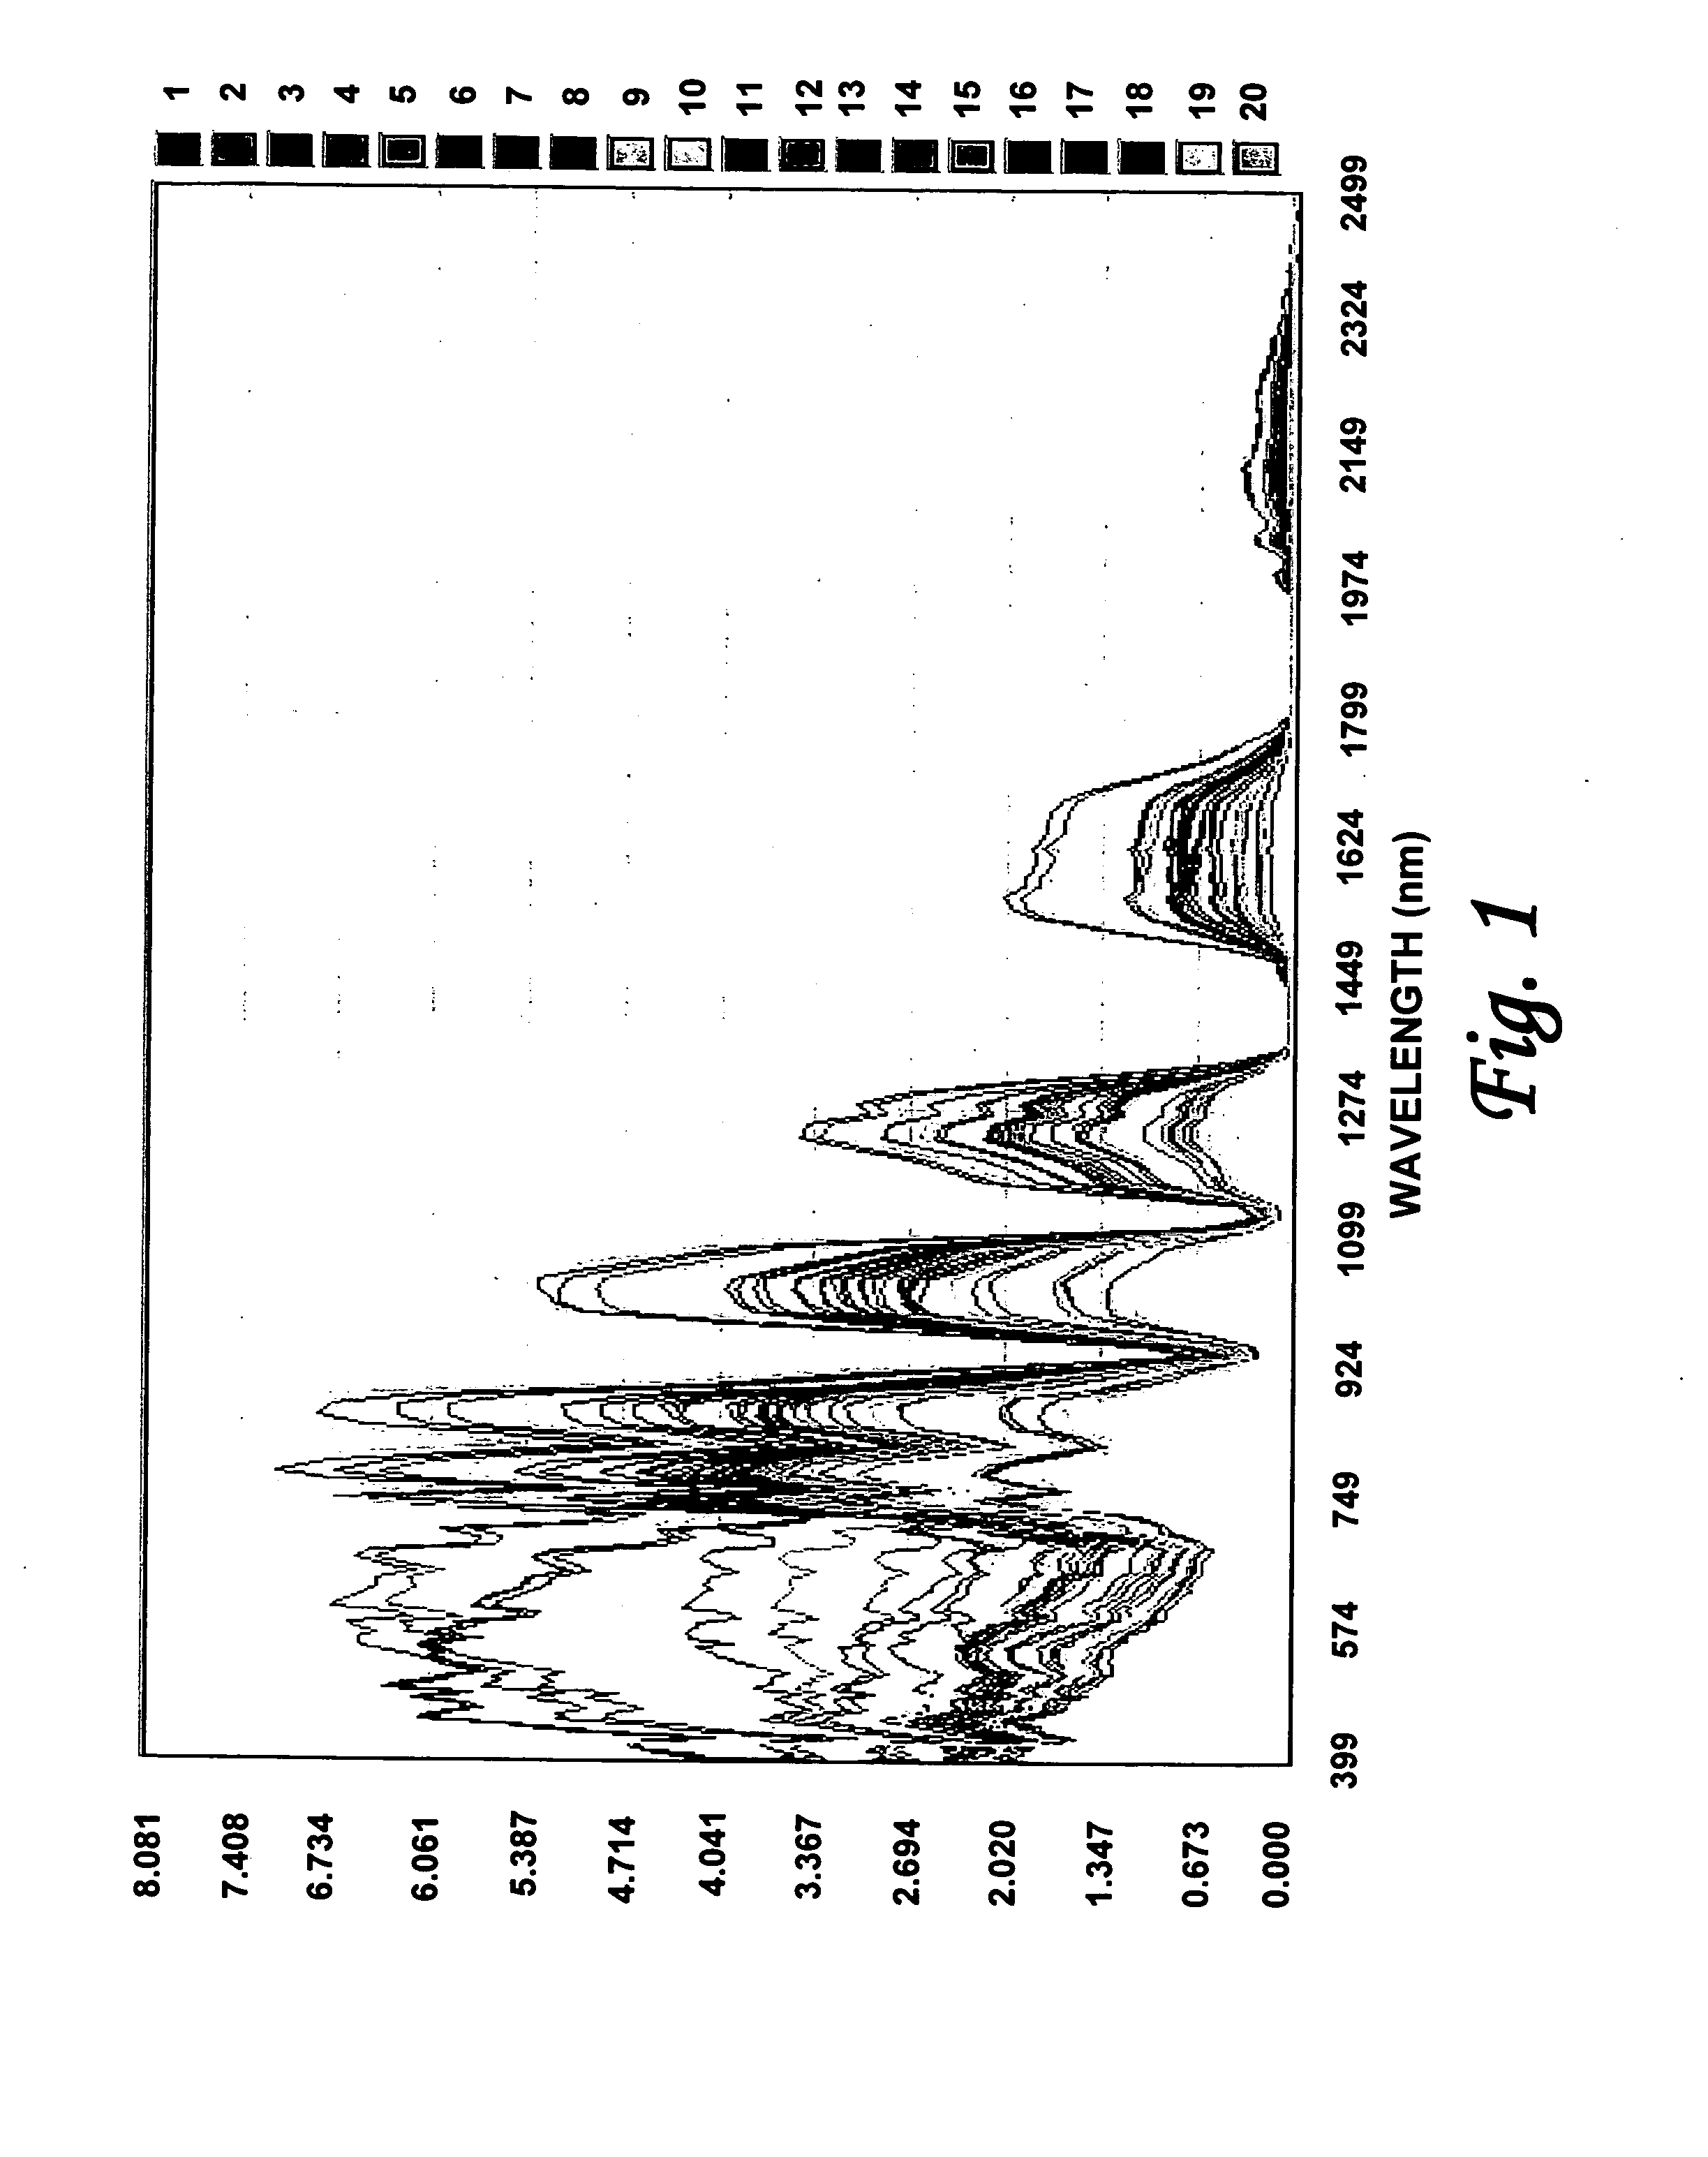
[0109] Data were collected with a Hyperspectral Digital Collection Experiment (HYDICE) airborne sensor. This sensor uses a 320×210 array with multiple gain regions to support imaging at 400-2500 ηm. The sensor is flown at 5000 to 25000 ft and achieves spatial resolution of about 0.8 to 4 m. Basedow, R. W., D. C. Carmer, and M. E. Anderson, Hydice: Operational Status, Proceedings of the SPIE, Vol. 2480, May 1994.

[0110] Data were collected over Copperas Cove, Tex. and the neighboring vicinity. The aircraft flew at an altitude of 20,000 ft to provide a spatial resolution of three (3) meters in 210 spectral bands from 398.5-2499.2 ηm. Twelve (12) features were identified in the hyperspectral scene: buildings 301, roads 302, soil 303, rooftops 304, canvas (not shown separately), rubber (not shown separately), metal (not shown separately), shrubs 305, plastic, grass 306, trees 307, and calibration panels (not shown separately). Refer to FIG. 3 depicting the hyperspectral composite class ...

example ii

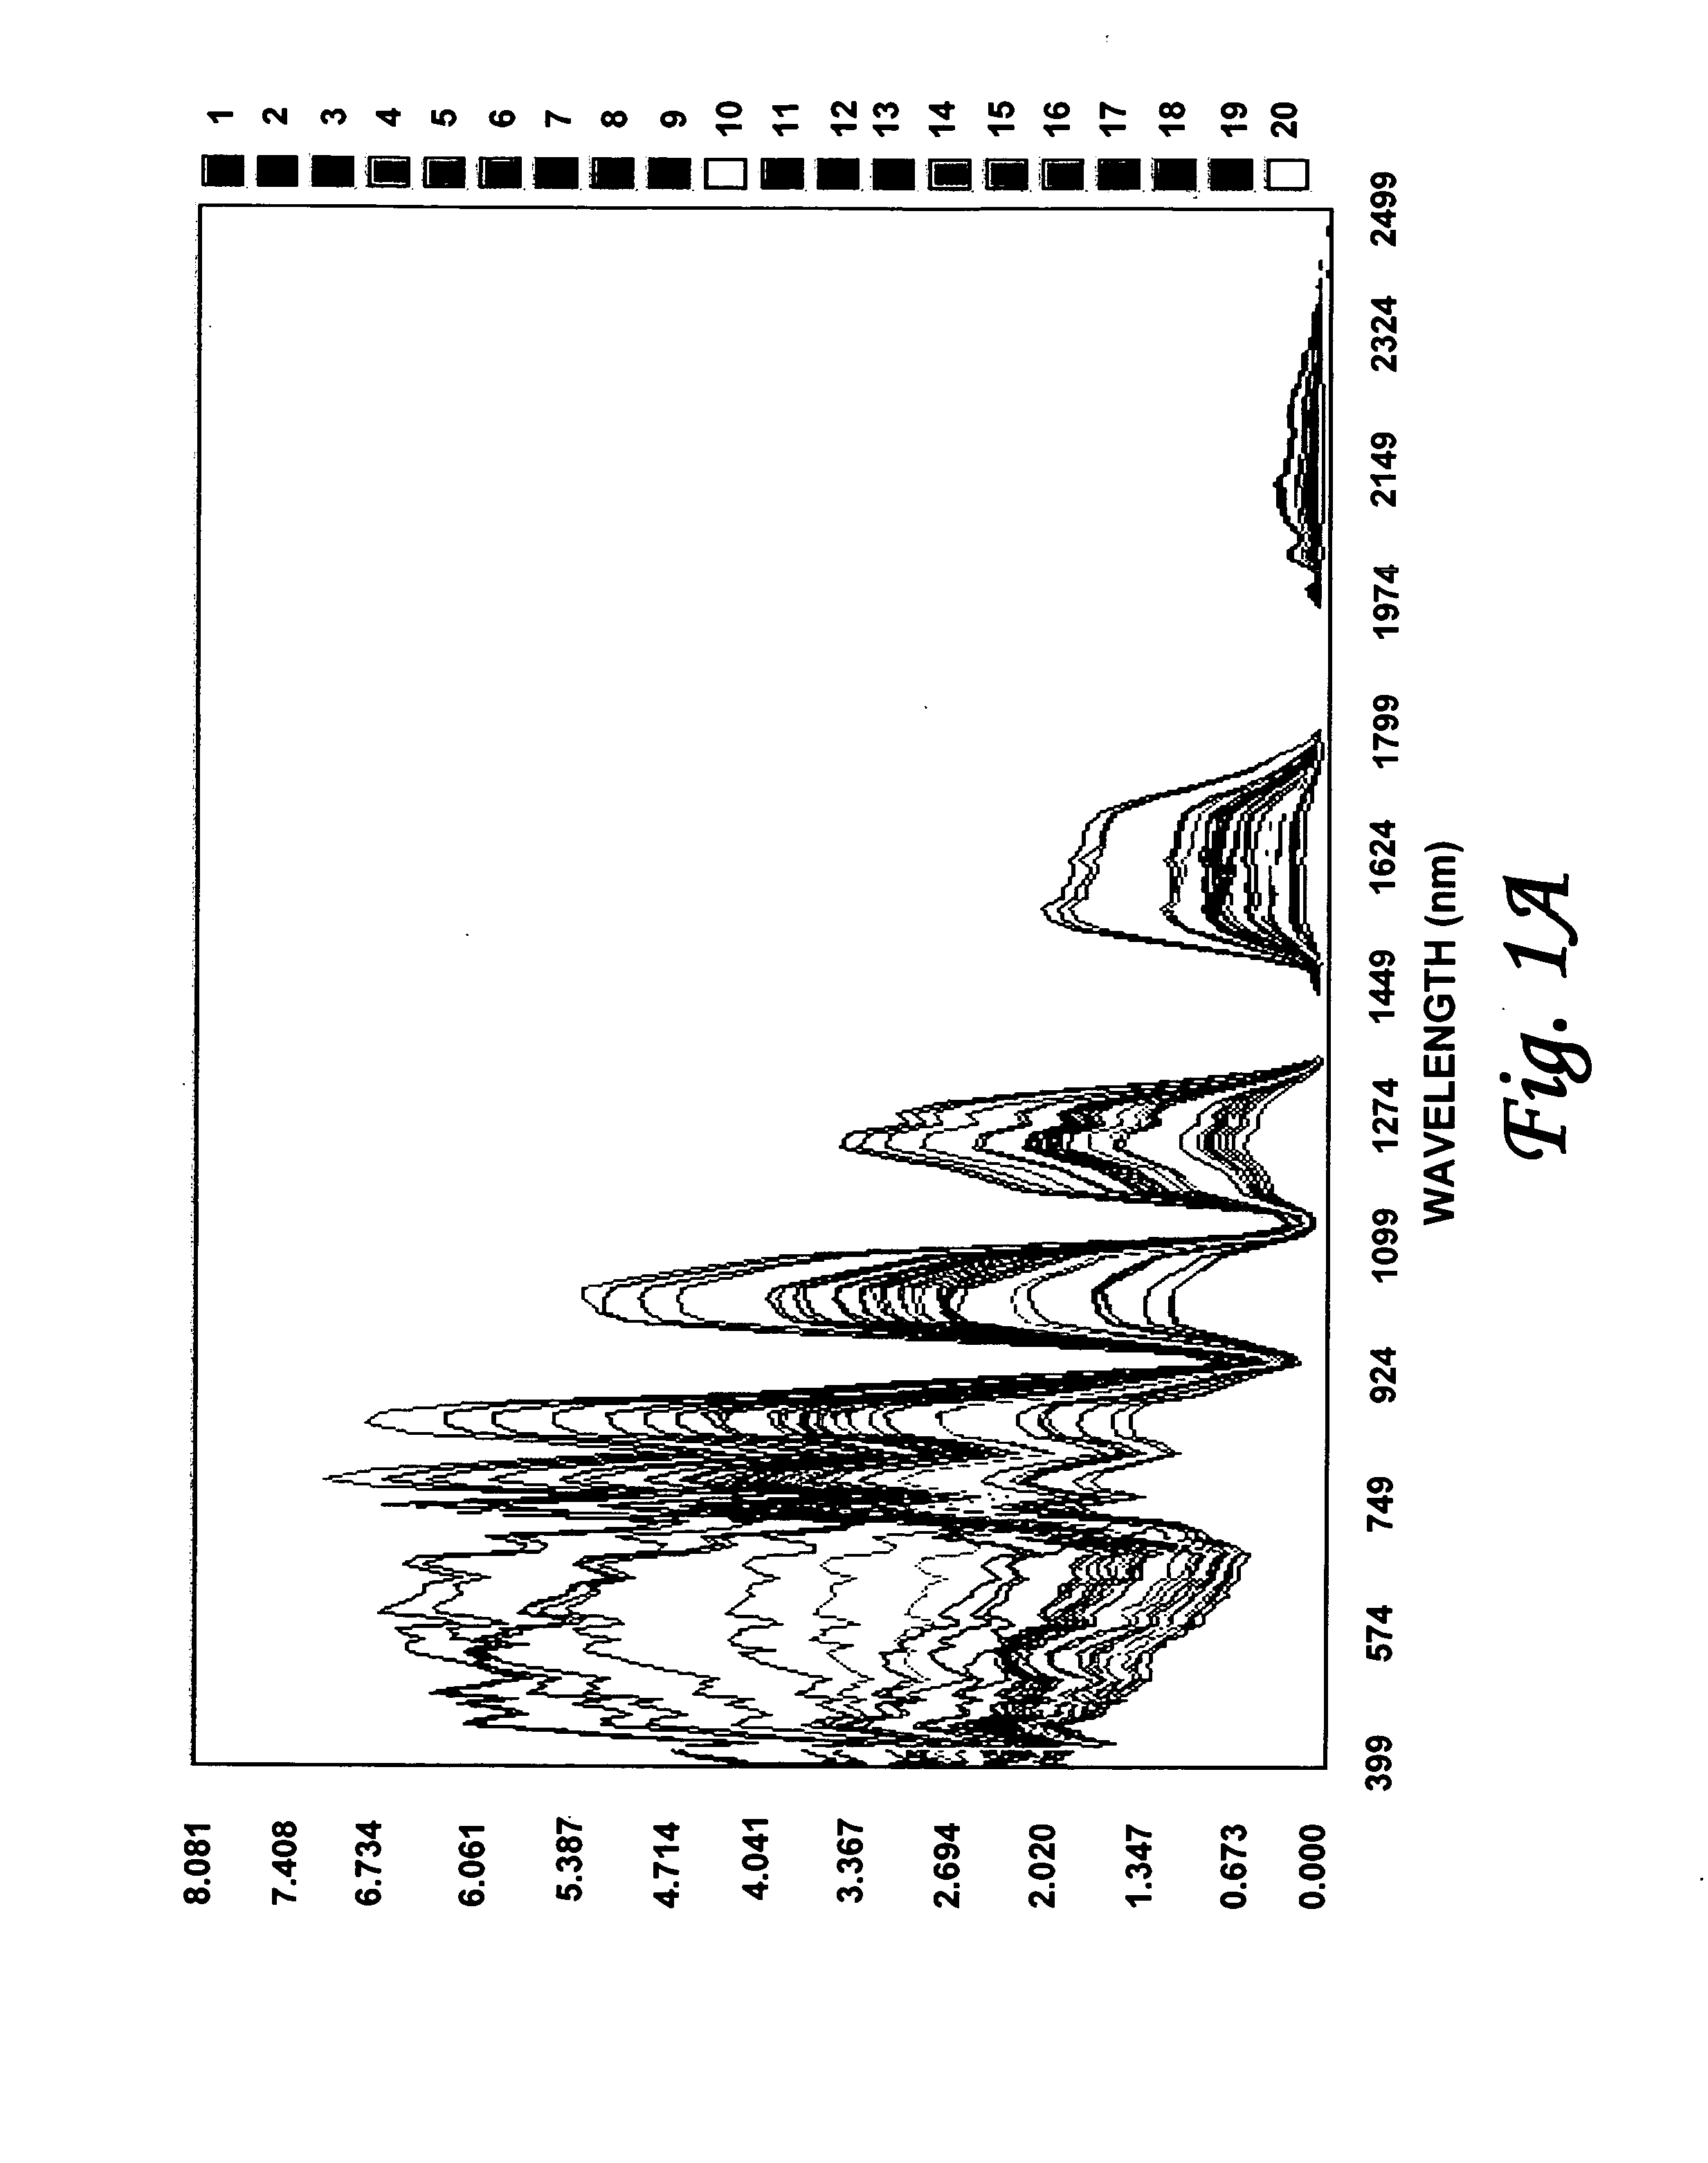
[0111] Data were also collected over Yuma City, Ariz. The aircraft flew at an altitude of 5000 ft to provide a spatial resolution of one (1) meter in the same number of bands as in Example 1. However, for this example only 204 bands were employed to image. These data are not calibrated. Eight (8) features were identified in the scene including: buildings 401, roads 402, soil 403, rooftops 404, shrubs 405, grass 406, trees 407, and swimming pools 408. FIG. 4 is a grayscale composite of the imaged area while FIG. 4A is the same Yuma City composite in color.

[0112] In the data sets for Examples I and II the interval between bands is not constant. Table I below summarizes the first three (3) and last five (5) wavelengths measured for each data set. The plot of the wavelength interval for Copperas Cove is a monotonic curve starting with an approximate interval of 3.3 and increasing to about 8.3 ηm. The same plot for Yuma City data is a step function with the interval a constant amount fo...

example iii

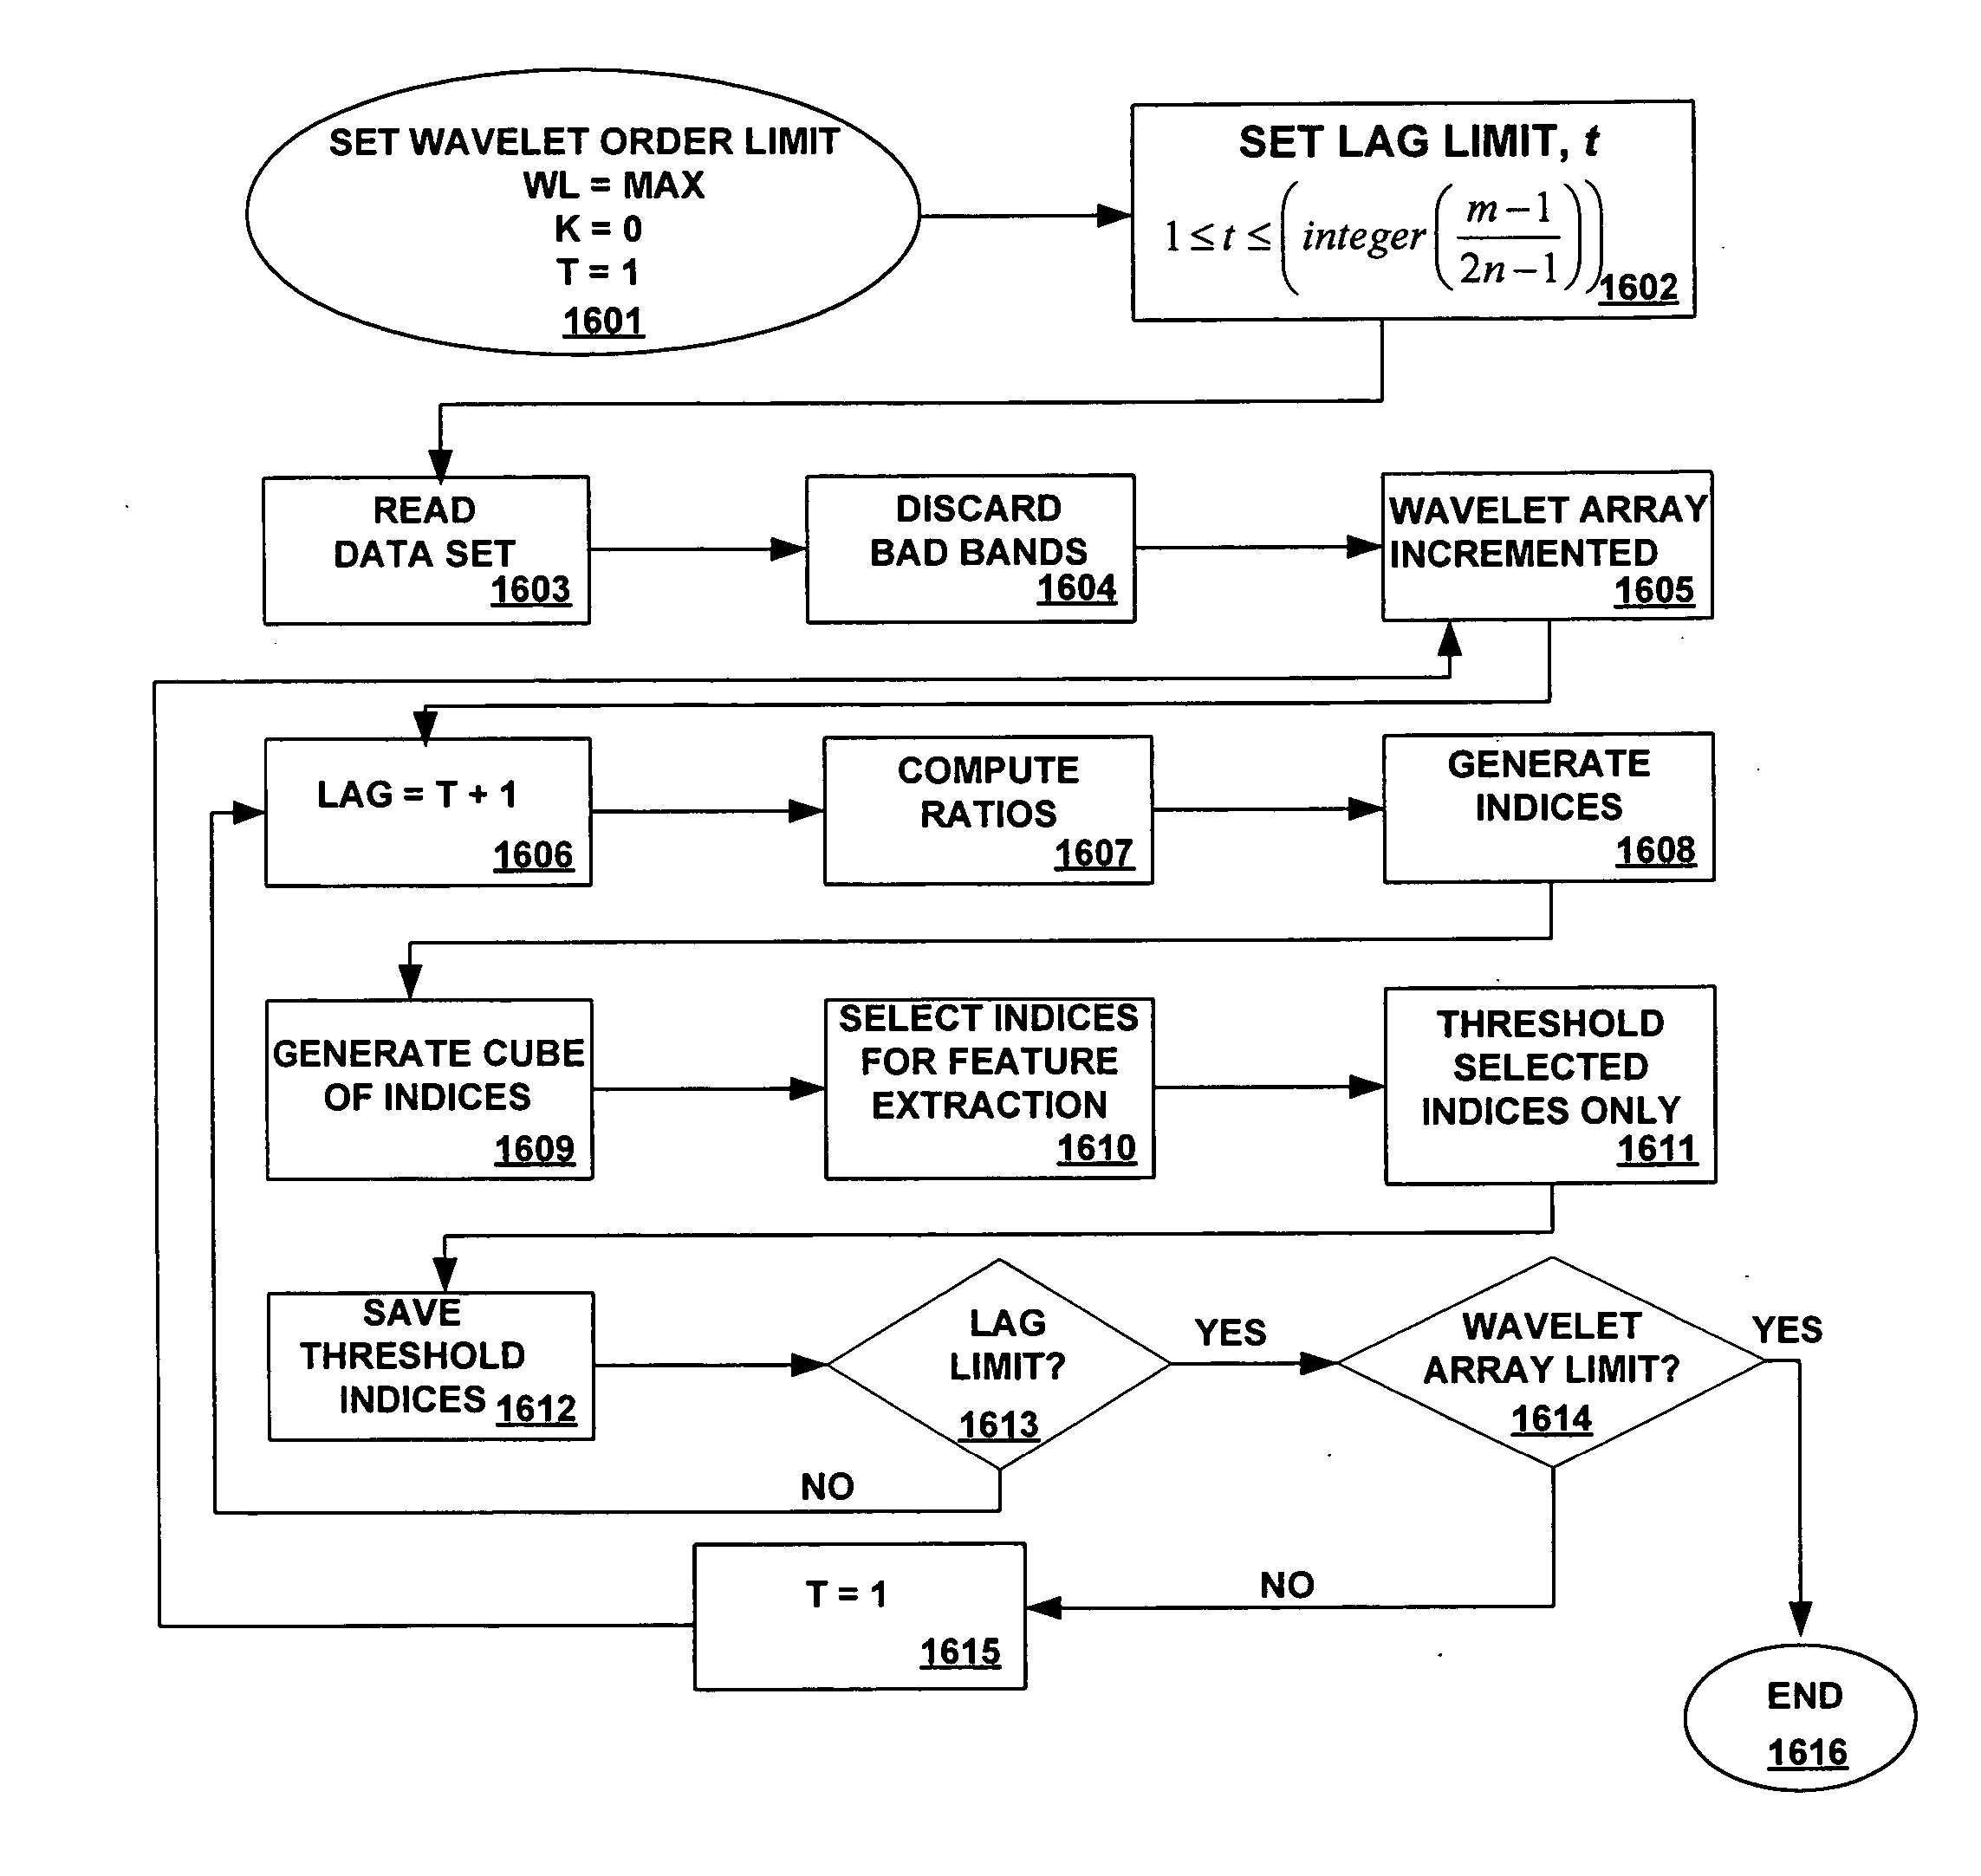
[0127] Refer to FIG. 16, a sample flow diagram for a process used in select embodiments of the present invention to perform data mining to streamline the processing of hyperspectral data in those cases in which specific features are to be identified or highlighted. To start the process at step 11601 the pre-specified limit of the wavelet array index, K, is selected and set and start values of wavelet array index, K, and lag, T, are set to zero and 1, respectively. Next at step 21602, the limit for lag is set. Having set these two limits, step 31603 involves reading in the hyperspectral data set. Step 41604 discards those bands that contain compromised (bad) data. (Although this step is taken early in the process to reduce the amount of data handled early on, “bad bands” would be eliminated at step 101610 below in any case.) The wavelet array index, K, is then incremented appropriately in step 51605. In step 61606, the lag, T, is incremented by 1 and step 71607 calculates the ratios ...


PUM


Abstract

A wavelet-based band difference-sum ratio method reduces the computation cost of classification and feature extraction (identification) tasks. A Generalized Difference Feature Index (GDFI), computed using wavelets such as Daubechies wavelets, is employed in a method to automatically generate a large sequence of generalized band ratio images. In select embodiments of the present invention, judicious data mining of the large set of GDFI bands produces a small subset of GDFI bands suitable to identify specific Terrain Category/Classification (TERCAT) features. Other wavelets, such as Vaidyanathan, Coiflet, Beylkin, and Symmlet and the like may be employed in select embodiments. The classification and feature extraction (identification) performance of the band ratio method of the present invention is comparable to that obtained with the same or similar data sets using much more sophisticated methods such as discriminants, neural net classification, endmember Gibbs-based partitioning, and genetic algorithms.

Description

RELATED APPLICATIONS [0001] Under 35 U.S.C. § 119(e)(1), this application claims the benefit of prior co-pending U.S. Provisional Patent Application Ser. No. 60 / 704,416, Wavelet-Based Feature Indices and Their Use as a Data Mining Tool for Hyperspectral Imagery Exploitation, by Simental et al., filed Aug. 2, 2005, and incorporated herein by reference.STATEMENT OF GOVERNMENT INTEREST [0002] Under paragraph 1(a) of Executive Order 10096, the conditions under which this invention was made entitle the Government of the United States, as represented by the Secretary of the Army, to an undivided interest therein on any patent granted thereon by the United States. This patent has multiple assignees. This and related patents are available for licensing to qualified licensees. Please contact Jeff Walaszek at 703 428-672 or Phillip Stewart at 601 634-4113.BACKGROUND [0003] Multispectral and hyperspectral images are composed of amounts of data that are impractical to analyze manually. These da...

Claims


Application Information

Patent Timeline
IPC IPC(8): G06K9/46G06V20/13G06V10/52
CPCG06K9/527G06K9/0063G06V20/13G06V10/52
Inventor SIMENTAL, EDMUNDOBOSCH, EDWARD H.RAND, ROBERT S.
Owner US ARMY CORPS OF ENGINEERS
Why Eureka
Try Eureka