
Method for analyzing demographic data

a demographic data and method technology, applied in the field of demographic data analysis, can solve the problems of difficult searching, questionable accuracy of these systems, and no data presented, and achieve the effects of less crime, improved schools, and easy resemblance to

Inactive Publication Date: 2008-01-17
LOCATION GROUP
View PDF11 Cites 59 Cited by
  • Summary
  • Abstract
  • Description
  • Claims
  • Application Information

AI Technical Summary

Benefits of technology

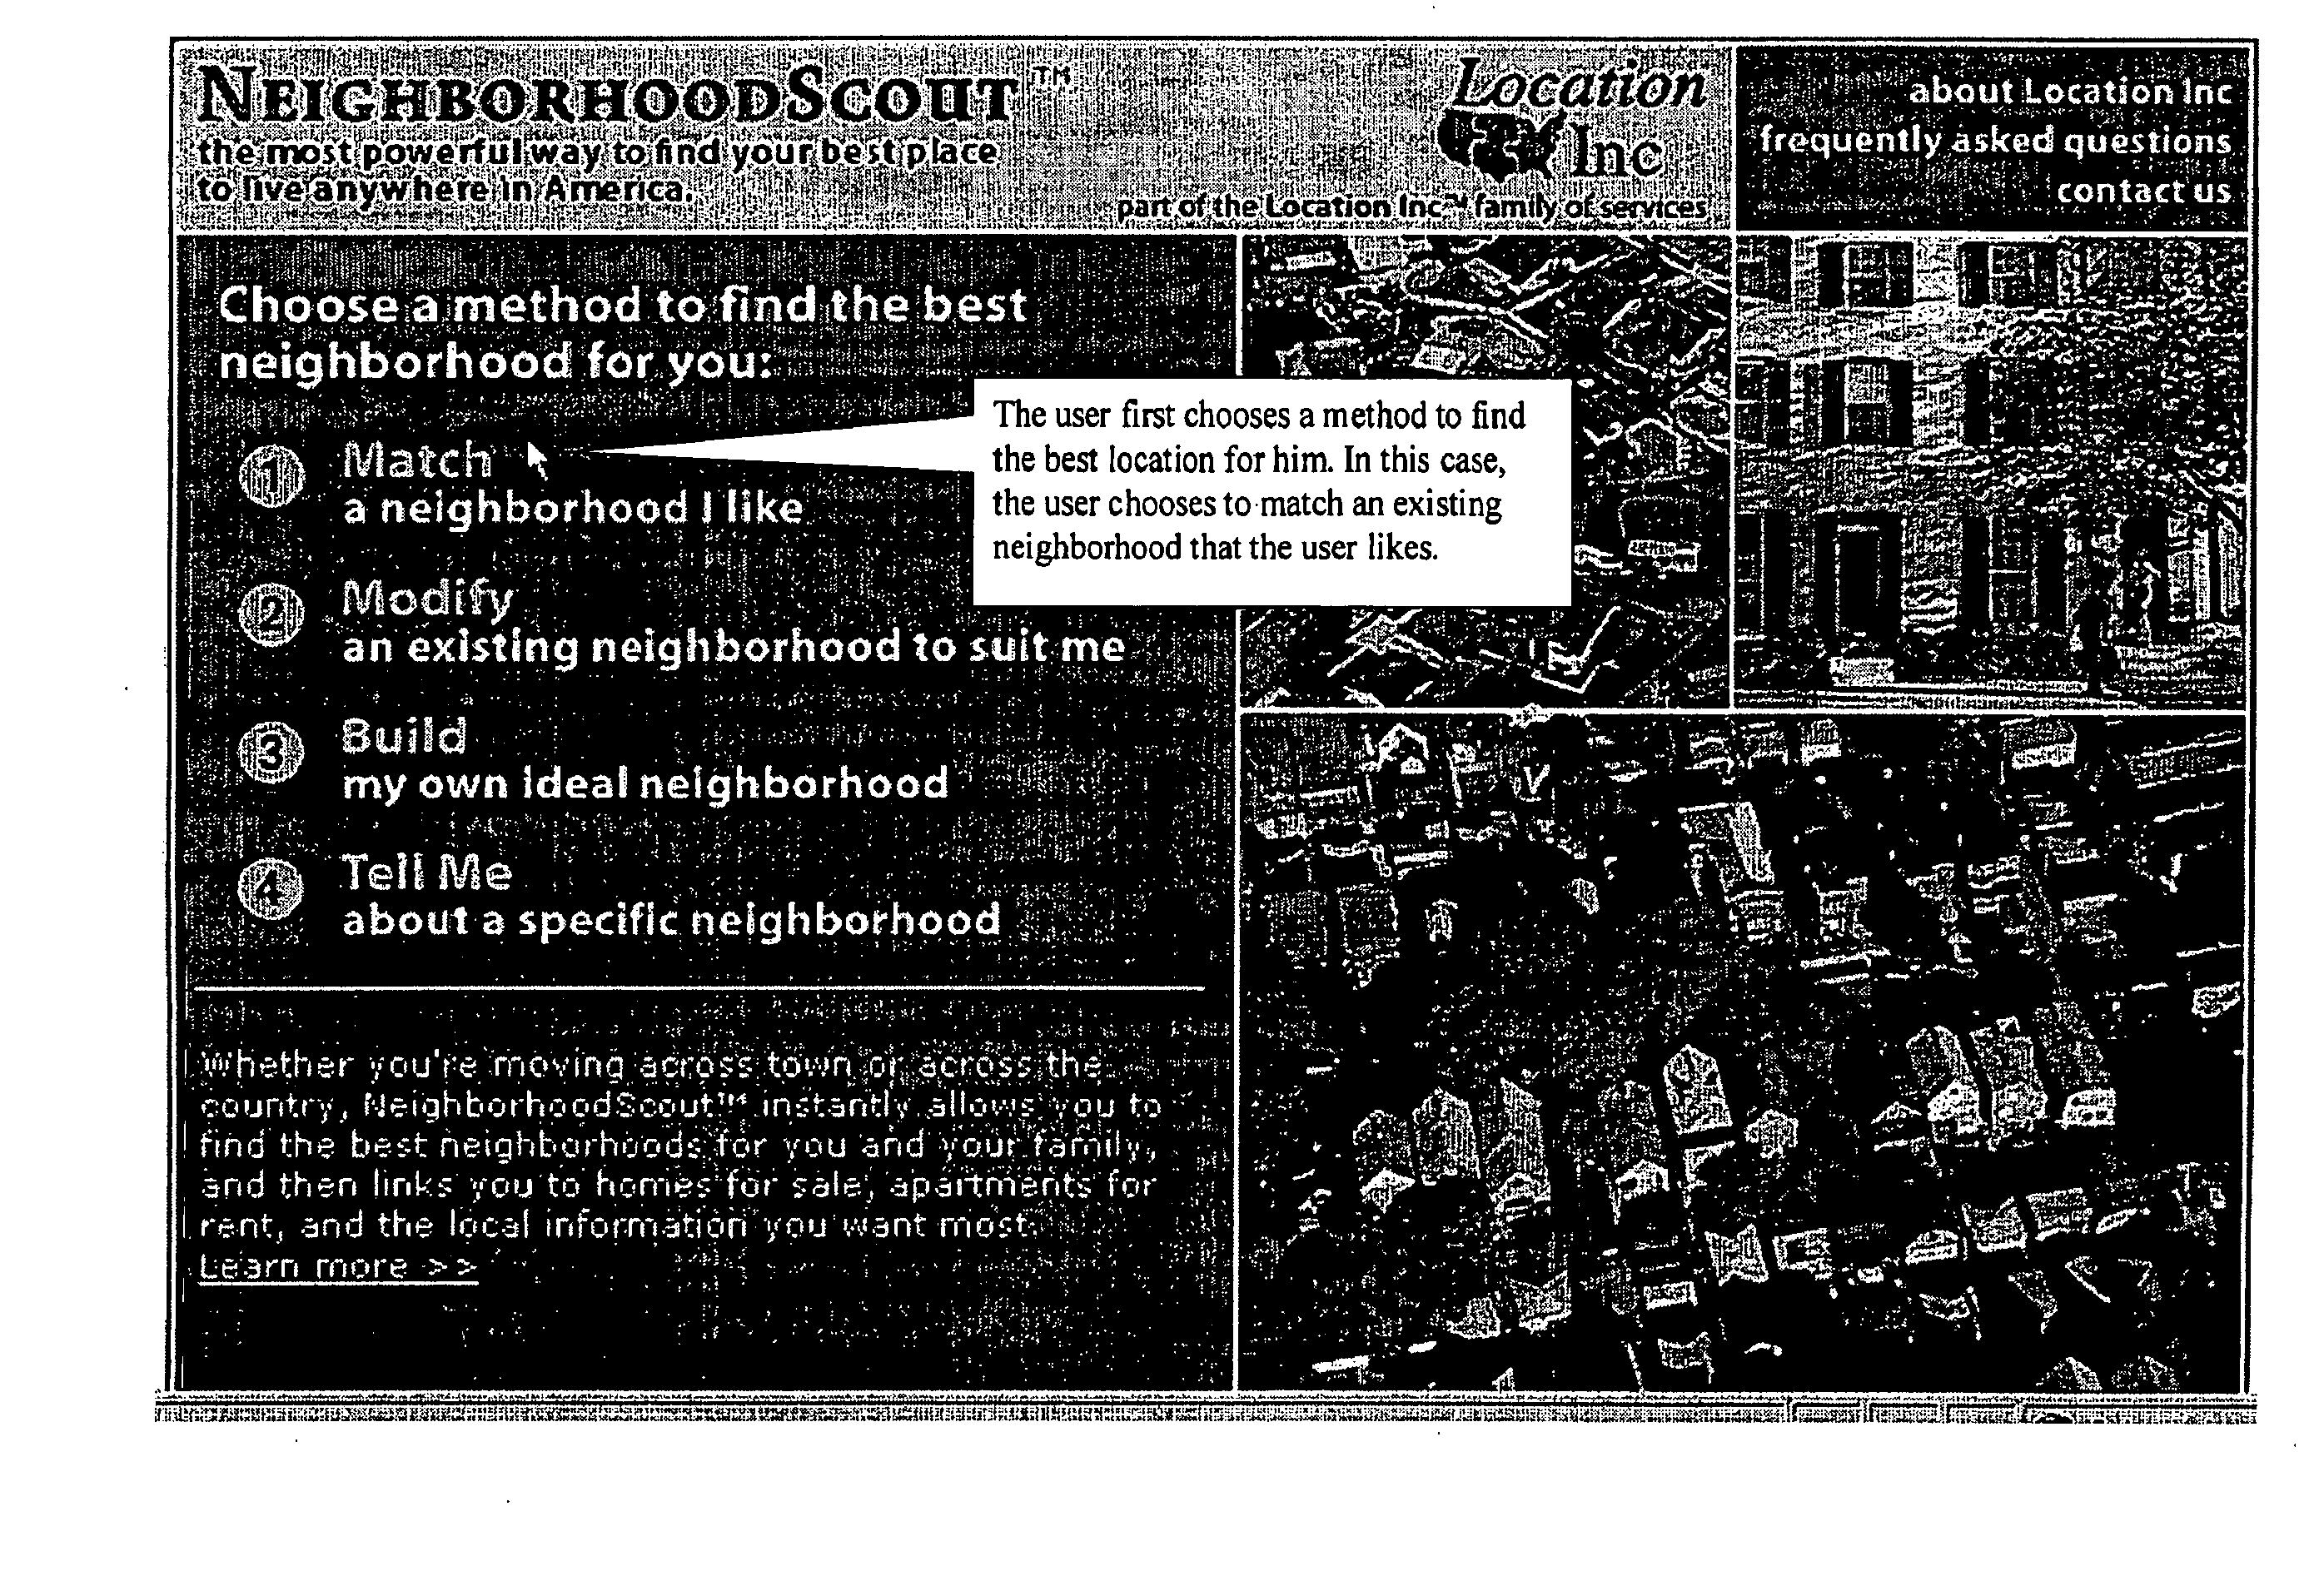
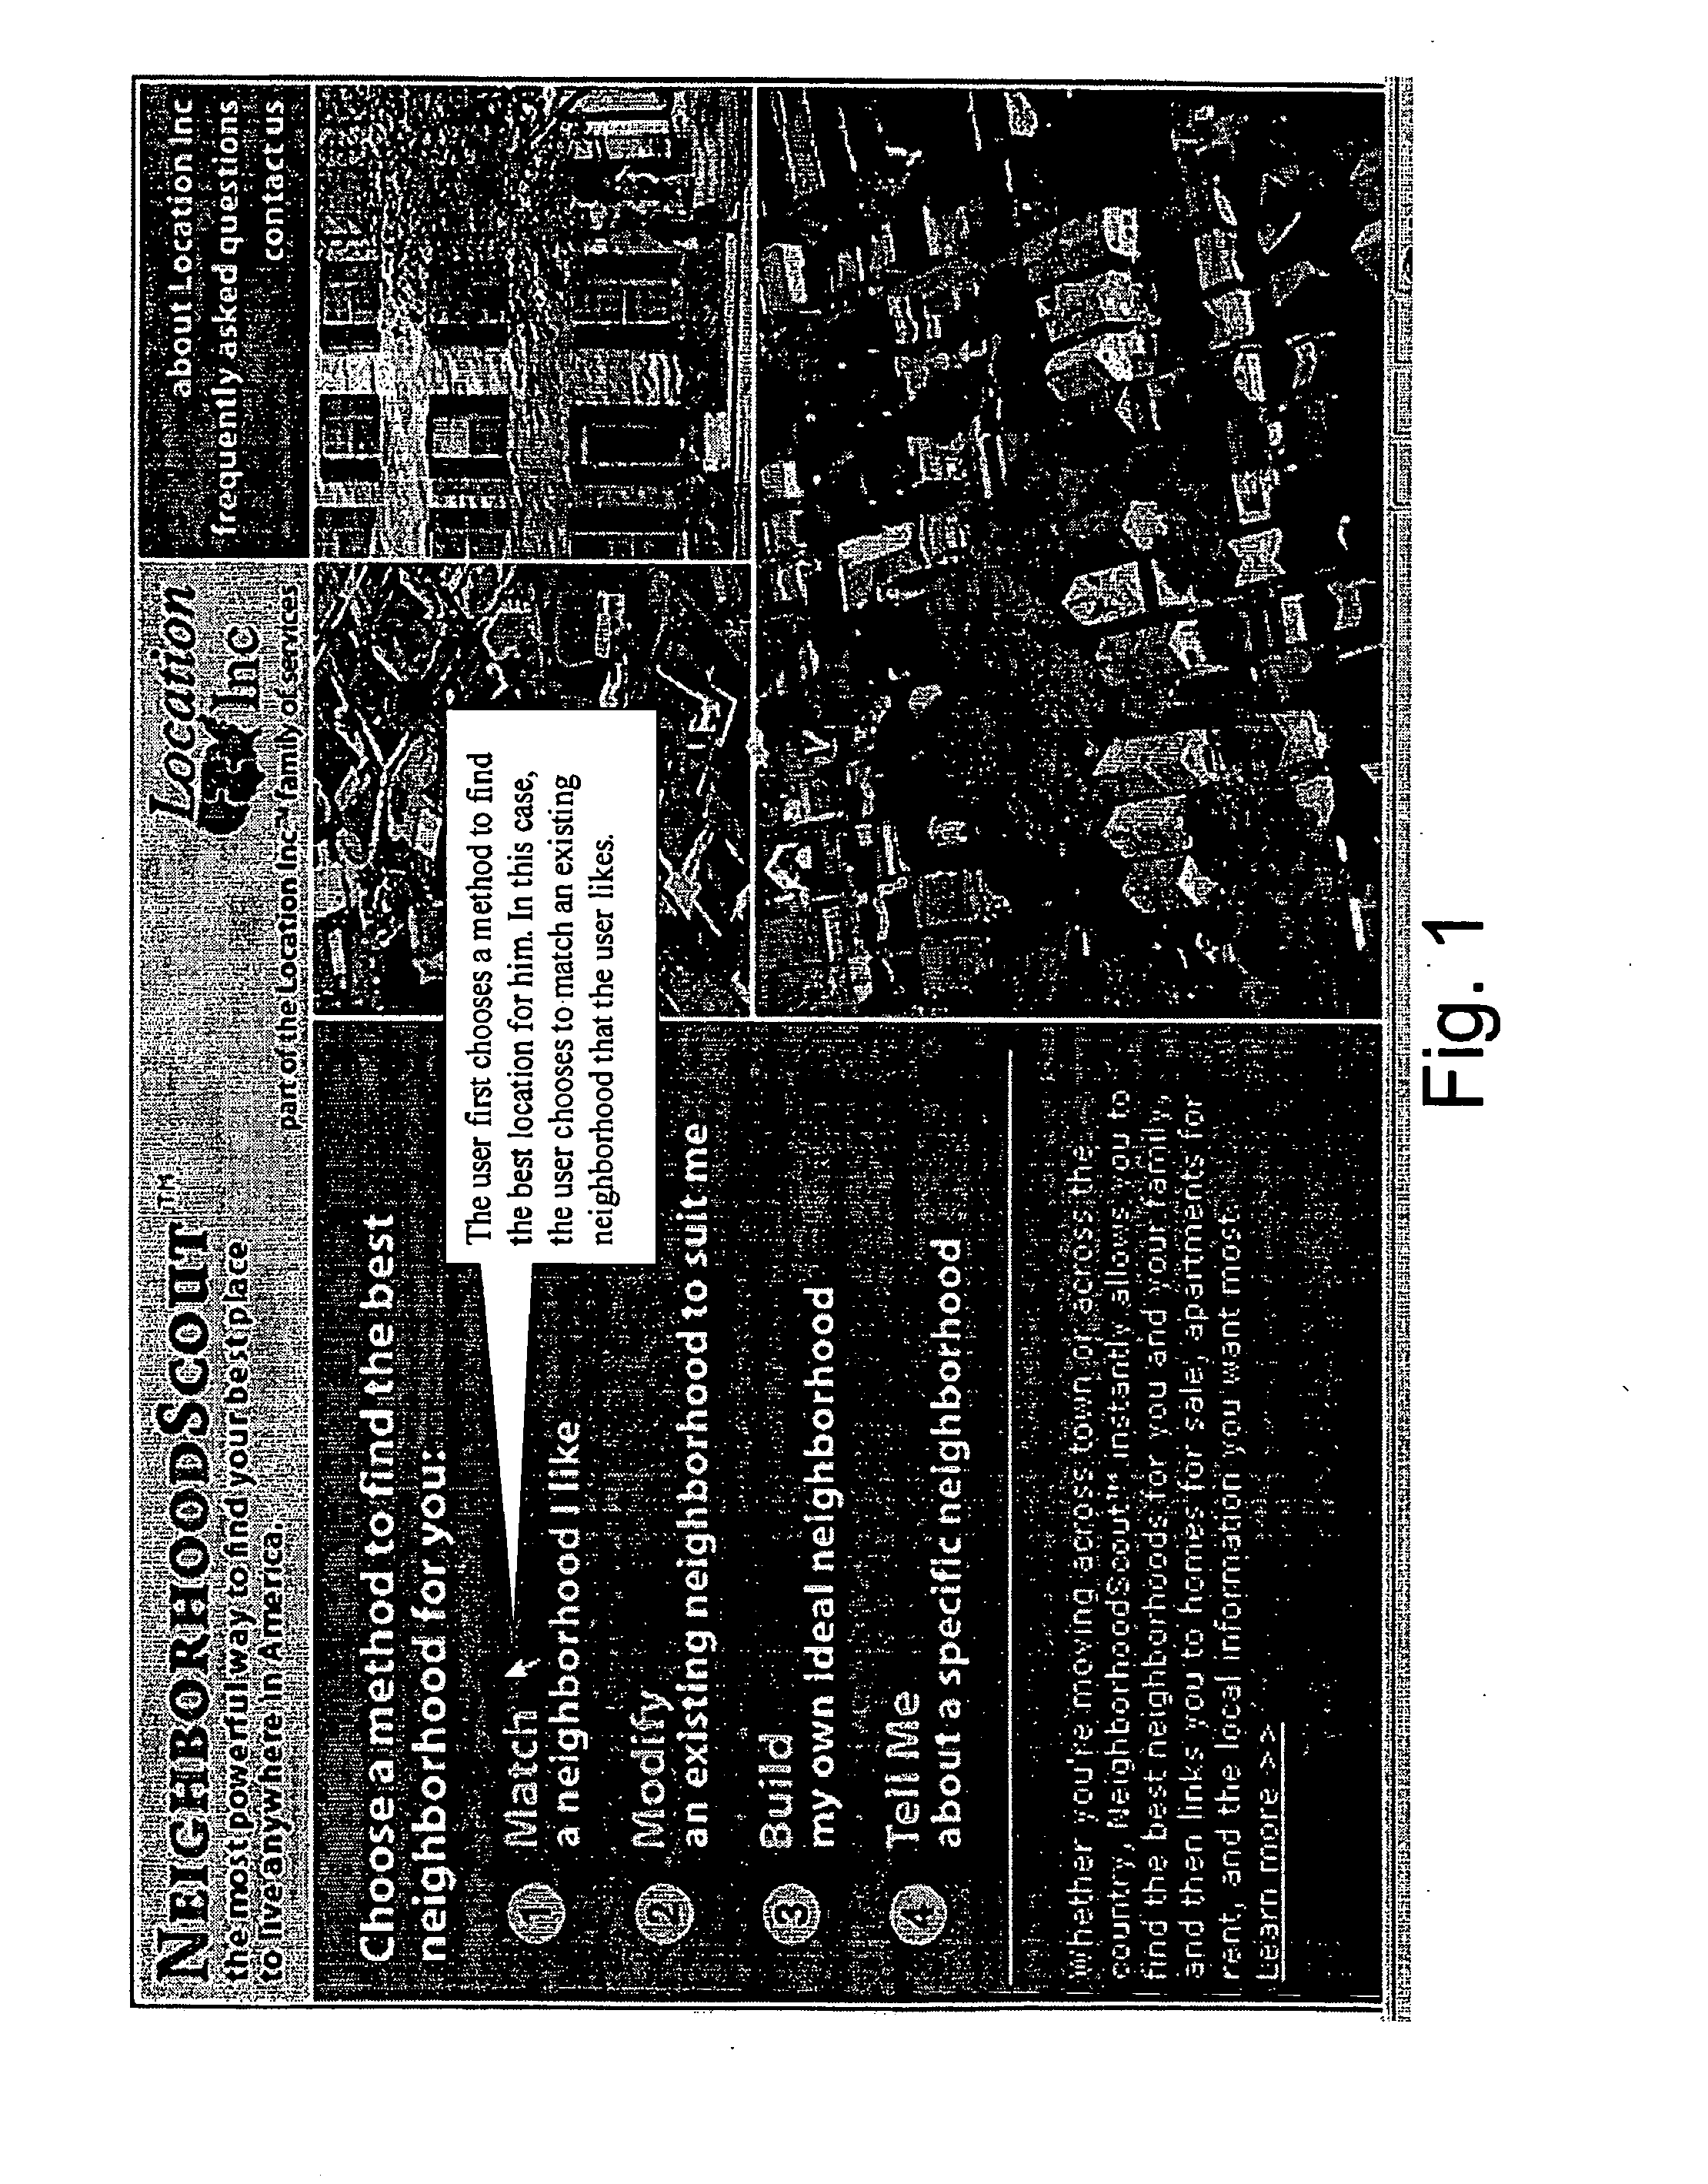
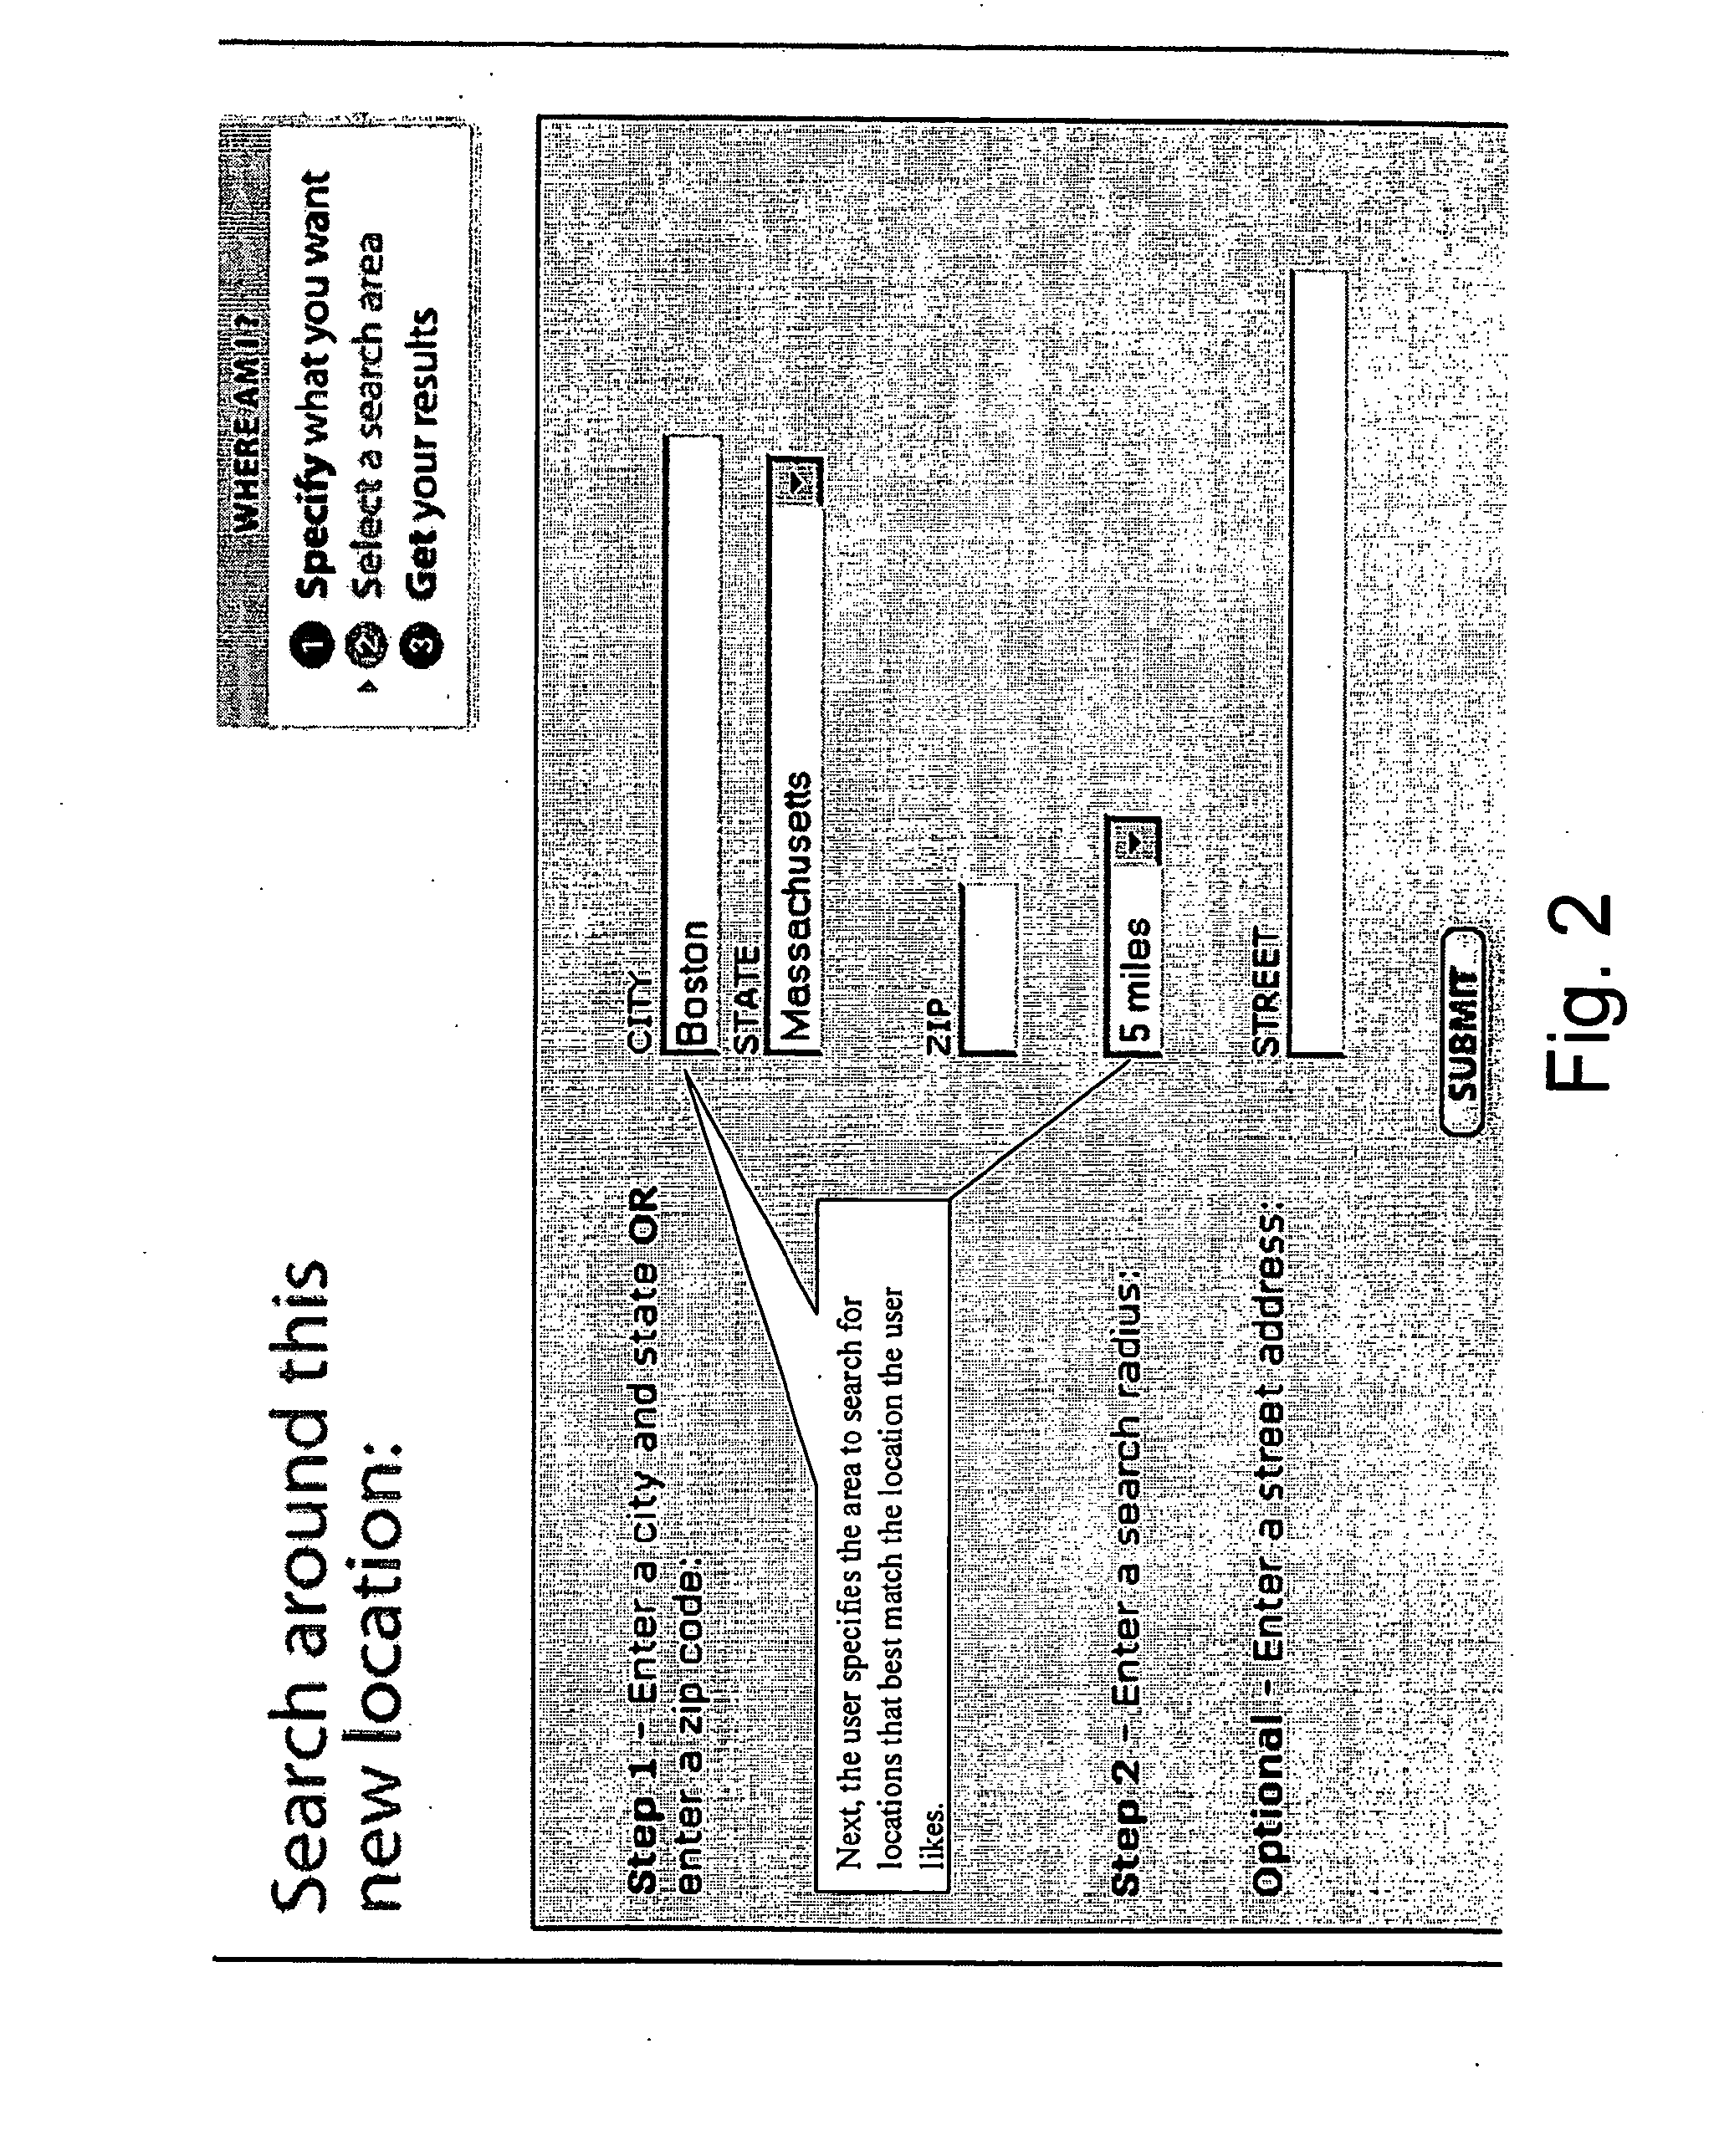
[0007] The second component of the present invention is the use of key word descriptors that provide a verbal expression describing features and characteristics of locations, where each key word is related to the quantitative values provided in an underlying data base that reflect local conditions in particular geographic areas. This component allows users of the application to select verbal, natural language descriptors in the form of these key words to easily relate to and identify characteristics that they find desirable about a geographic location and instruct the application of the present invention to find locations that most closely match the chosen characteristics. Using key words that correspond to identifiable quantitative values to describe locations creates an interface that allows the users never have to think in quantitative terms, while still requesting a list of locations that have the characteristics that they want. Once the user selects the key words that correspond to the characteristics that they find desirable, the application of the present invention converts the key words to quantitative values and performs an average absolute difference calculation to compute a value corresponding the selected set of keywords and the overall level of similarity between the key words a user chooses, and real locations that exist.
[0008] The final component of the application of the present invention is the ability of the user to choose a location they presently find desirable and view the set of key words that are associated with that location. The user can then modify the set of key words by select or unselect key words that describe the location adding and subtracting key words that they either like or dislike, resulting in a modified set of key words. This new set of key words can then be used as a new set of search criteria to find locations that best match these newly selected key words. This allows a user to find locations that are comparable to an existing location that they like, but with, for example, less crime, better schools, or less expensive housing. Again as stated above once the set of keywords is provided by the user, the application calculates the average absolute difference between all of the data base values using the value for the original location, in combination with the newly modified keywords selected by the user.

Problems solved by technology

The difficulty is that none of the data is presented in a manner that facilitates accurate and easy comparison between selected geographic areas that can incorporate multiple characteristics regarding each area.
Although many services attempt to provide comparison information, the accuracy provided by these systems is questionable.
The other difficulty is that the data that is available is primarily numeric making searching difficult.

Method used


Image

  • Method for analyzing demographic data
  • Method for analyzing demographic data
  • Method for analyzing demographic data

Examples


Embodiment Construction

[0010] Referring now to the drawings, the invention will be described in greater detail.

[0011] The first distinctive component is the utilization of known statistical and mathematical functions (Principal Components Analysis followed by squared Euclidean distance calculated on the resulting factors) applied to large amounts of demographic, crime, school, and geographic data for locations all across America. The result of this unique combination is the creation of a matrix containing a quantitative measure of dissimilarity for all locations in America. The larger the value between any two intersecting rows and columns in this matrix, means those locations are more dissimilar based on all of the factors used to describe the locations. Small numeric values between any two locations in the matrix means those locations are quite similar to each other based on all of the factors used to describe the locations. Thus, this approach allows the development of quantitative measures of similar...


PUM


Abstract

A computer implemented method of generating an ordered list of geographical locations having similarities in preselected categories relative to a first geographical location.

Description

CROSS REFERENCE TO RELATED APPLICATION [0001] This application is a continuation-in-part of U.S. Ser. No. 10 / 329,179, filed on Dec. 23, 2002. The priority of this prior application is expressly claimed and its disclosure is hereby incorporated by reference in its entirety.BACKGROUND OF THE INVENTION [0002] The present invention relates to a system for analyzing and comparing demographic and other data related to identifiable geographic areas to evaluate their similarity or dissimilarity. More specifically, this invention relates to a new system for calculating numeric values that are related to identifiable characteristics for a specific area of the country based on that area's demographic and other information and comparing it to a similarly generated numbers for another area of the country to determine the relative similarity or differences. A forty-page inventor's disclosure is attached which illustrates the present invention. [0003] Currently, a broad range of data regarding the...

Claims


Application Information

Patent Timeline
Patent Type & Authority Applications(United States)
IPC IPC(8): G06F7/10G06F17/30G06Q30/00
CPCG06F17/30241G06F17/3087G06Q30/02G06F17/30864Y10S707/919G06F3/04842Y10S707/918G06F16/951G06F16/29G06F16/9537G06Q30/0201
Inventor SCHILLER, ANDREW
Owner LOCATION GROUP
Learn More