
Process for creating management charts

a management chart and process technology, applied in the field of organization management computer programs, can solve the problems of cumbersome maintenance and prone to errors, lack of the ability to easily define employee attributes, and lack of the ability to run an organizational style chart for users

Inactive Publication Date: 2008-02-14
NORTHROP GRUMAN CORP
View PDF9 Cites 20 Cited by
  • Summary
  • Abstract
  • Description
  • Claims
  • Application Information

AI Technical Summary

Benefits of technology

"The invention is a process for creating customizable organizationally drivencharts and reports using a database management program. The process allows users to easily define employee attributes, run chart reports with user-defined color coding and attributes, and access a variety of other reports and data extracts. The system also allows for employees to occupy multiple positions and act in different departments. The technical effects of the invention include improved efficiency and flexibility in creating customizable organization structures and reports."

Problems solved by technology

Thus they were cumbersome to maintain and prone to errors.
Secondly, these programs do not provide the ability to easily define employee attributes.
They do not provide the ability to run an organizational style chart for user selected attributes with on-demand, user defined color coding and definition of attributes at run time.

Method used


Image

  • Process for creating management charts
  • Process for creating management charts
  • Process for creating management charts

Examples


Embodiment Construction

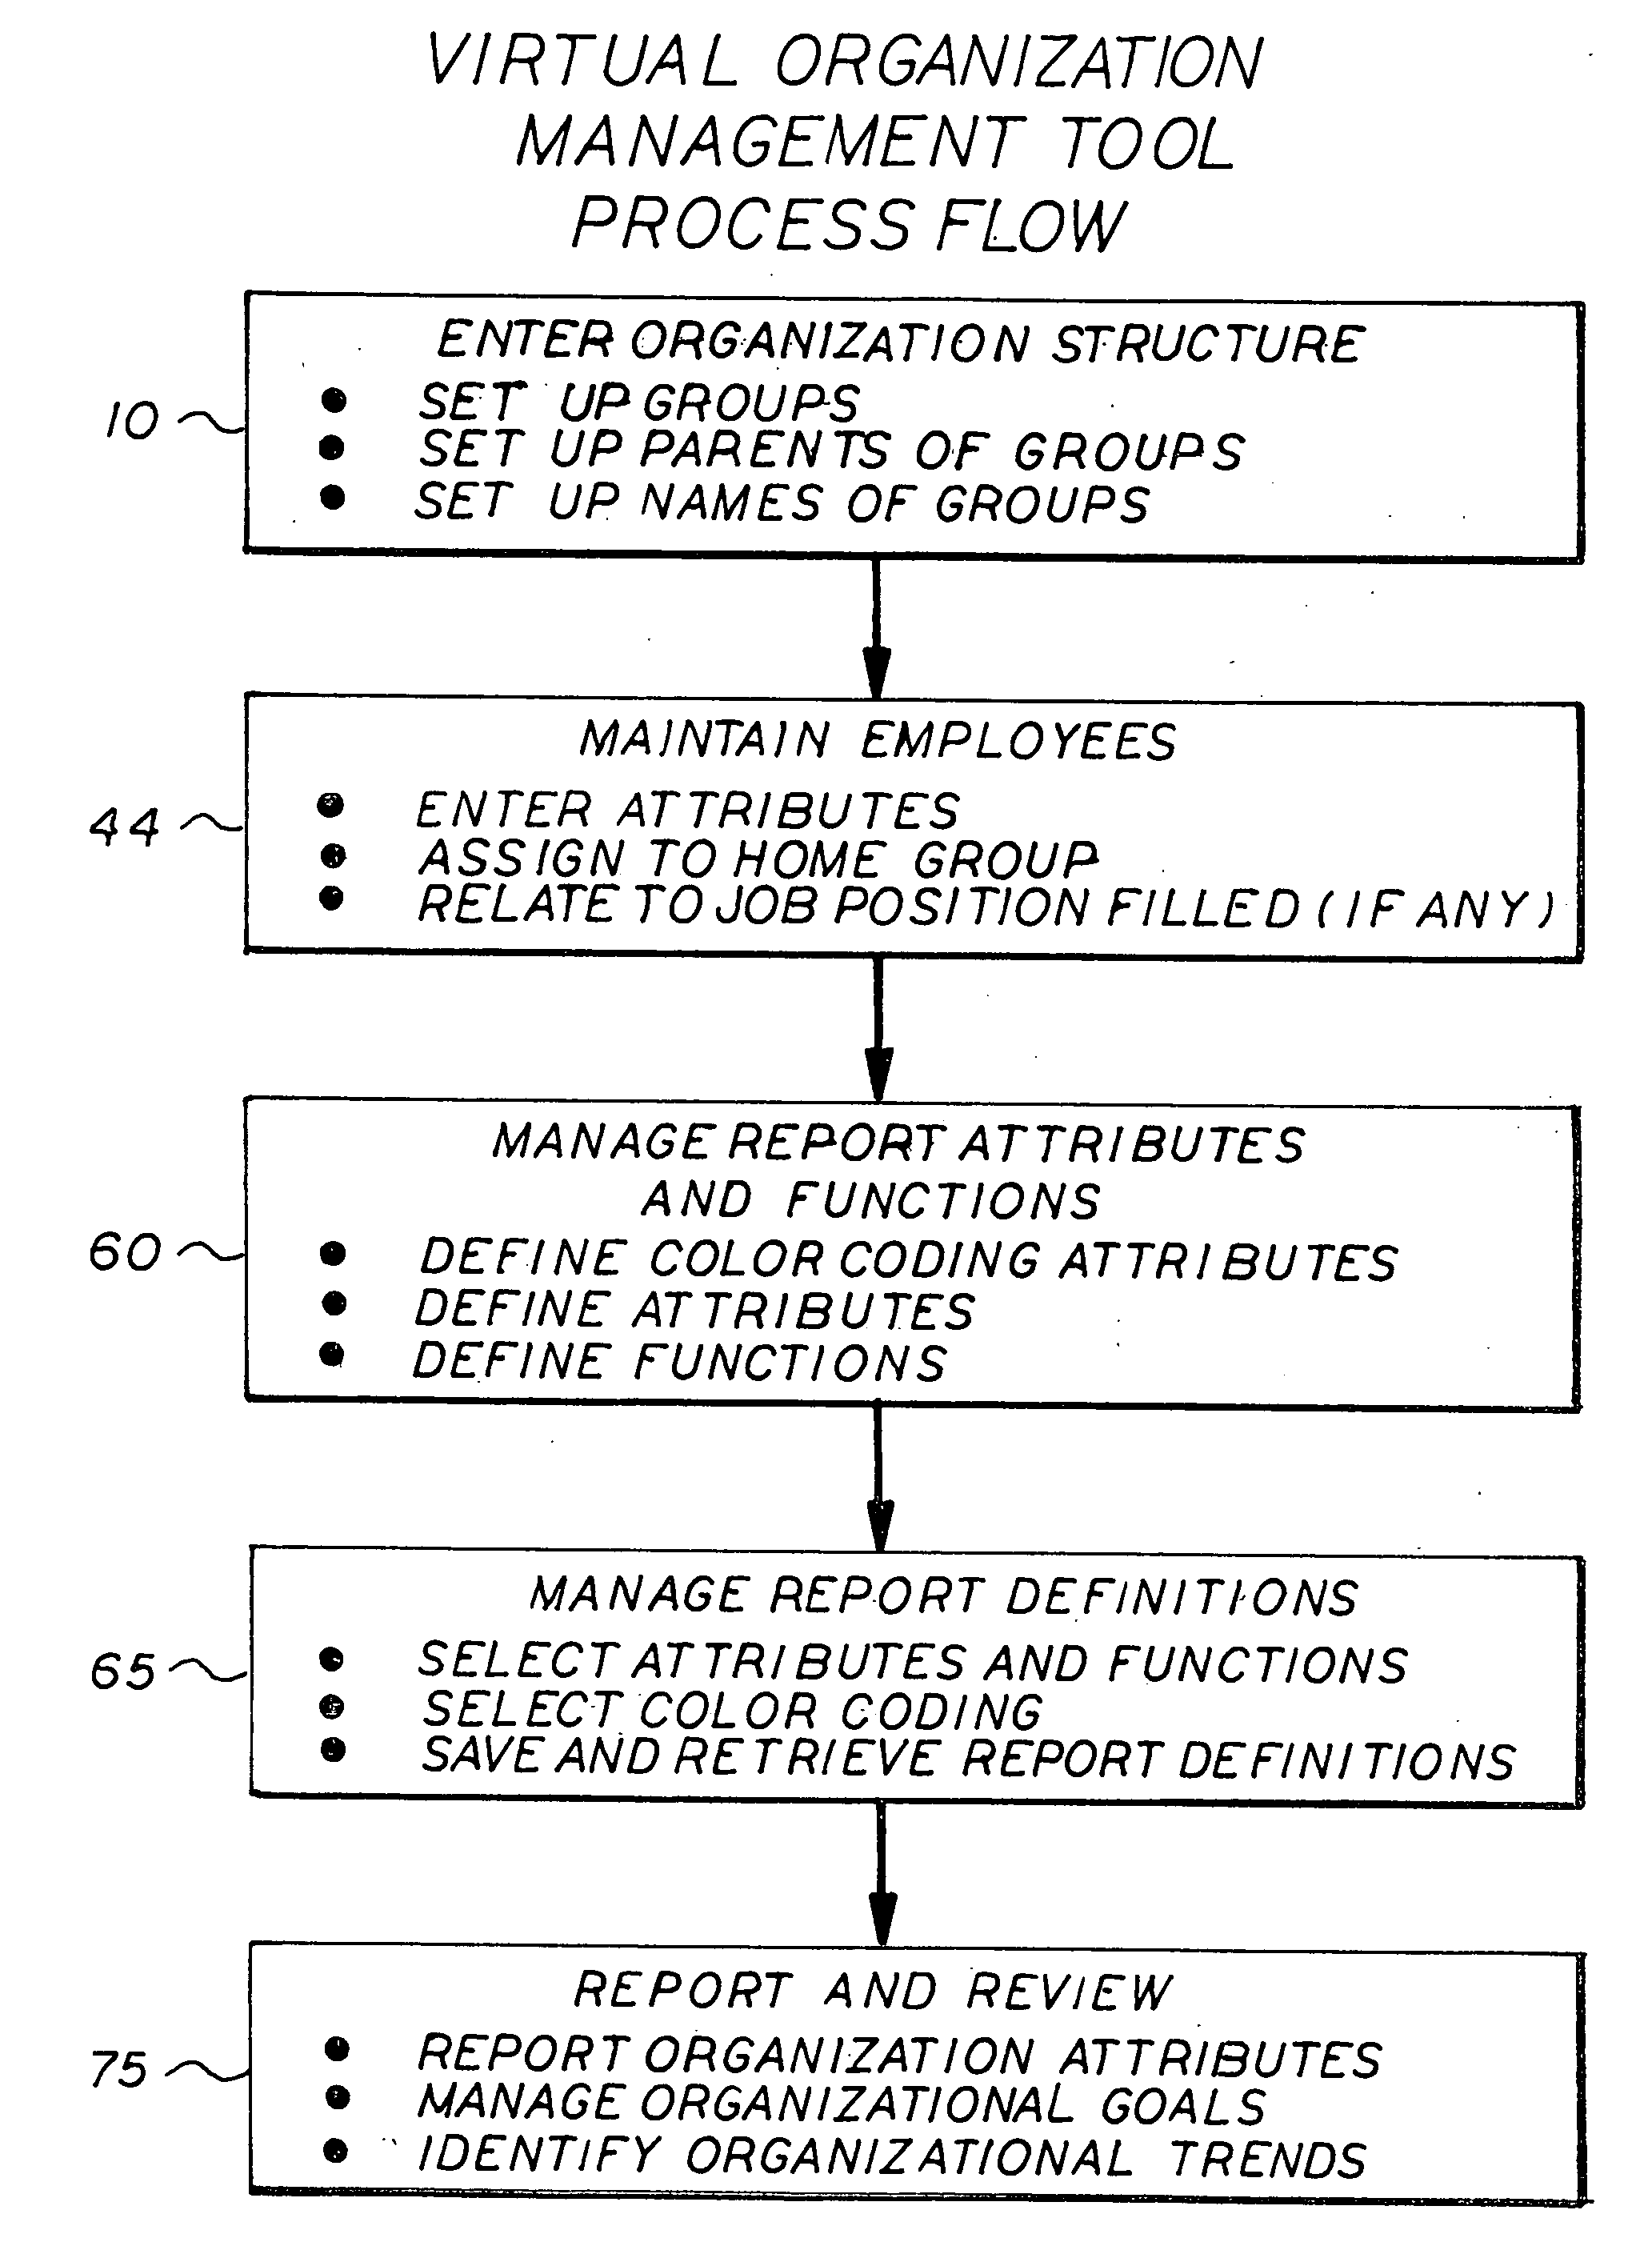
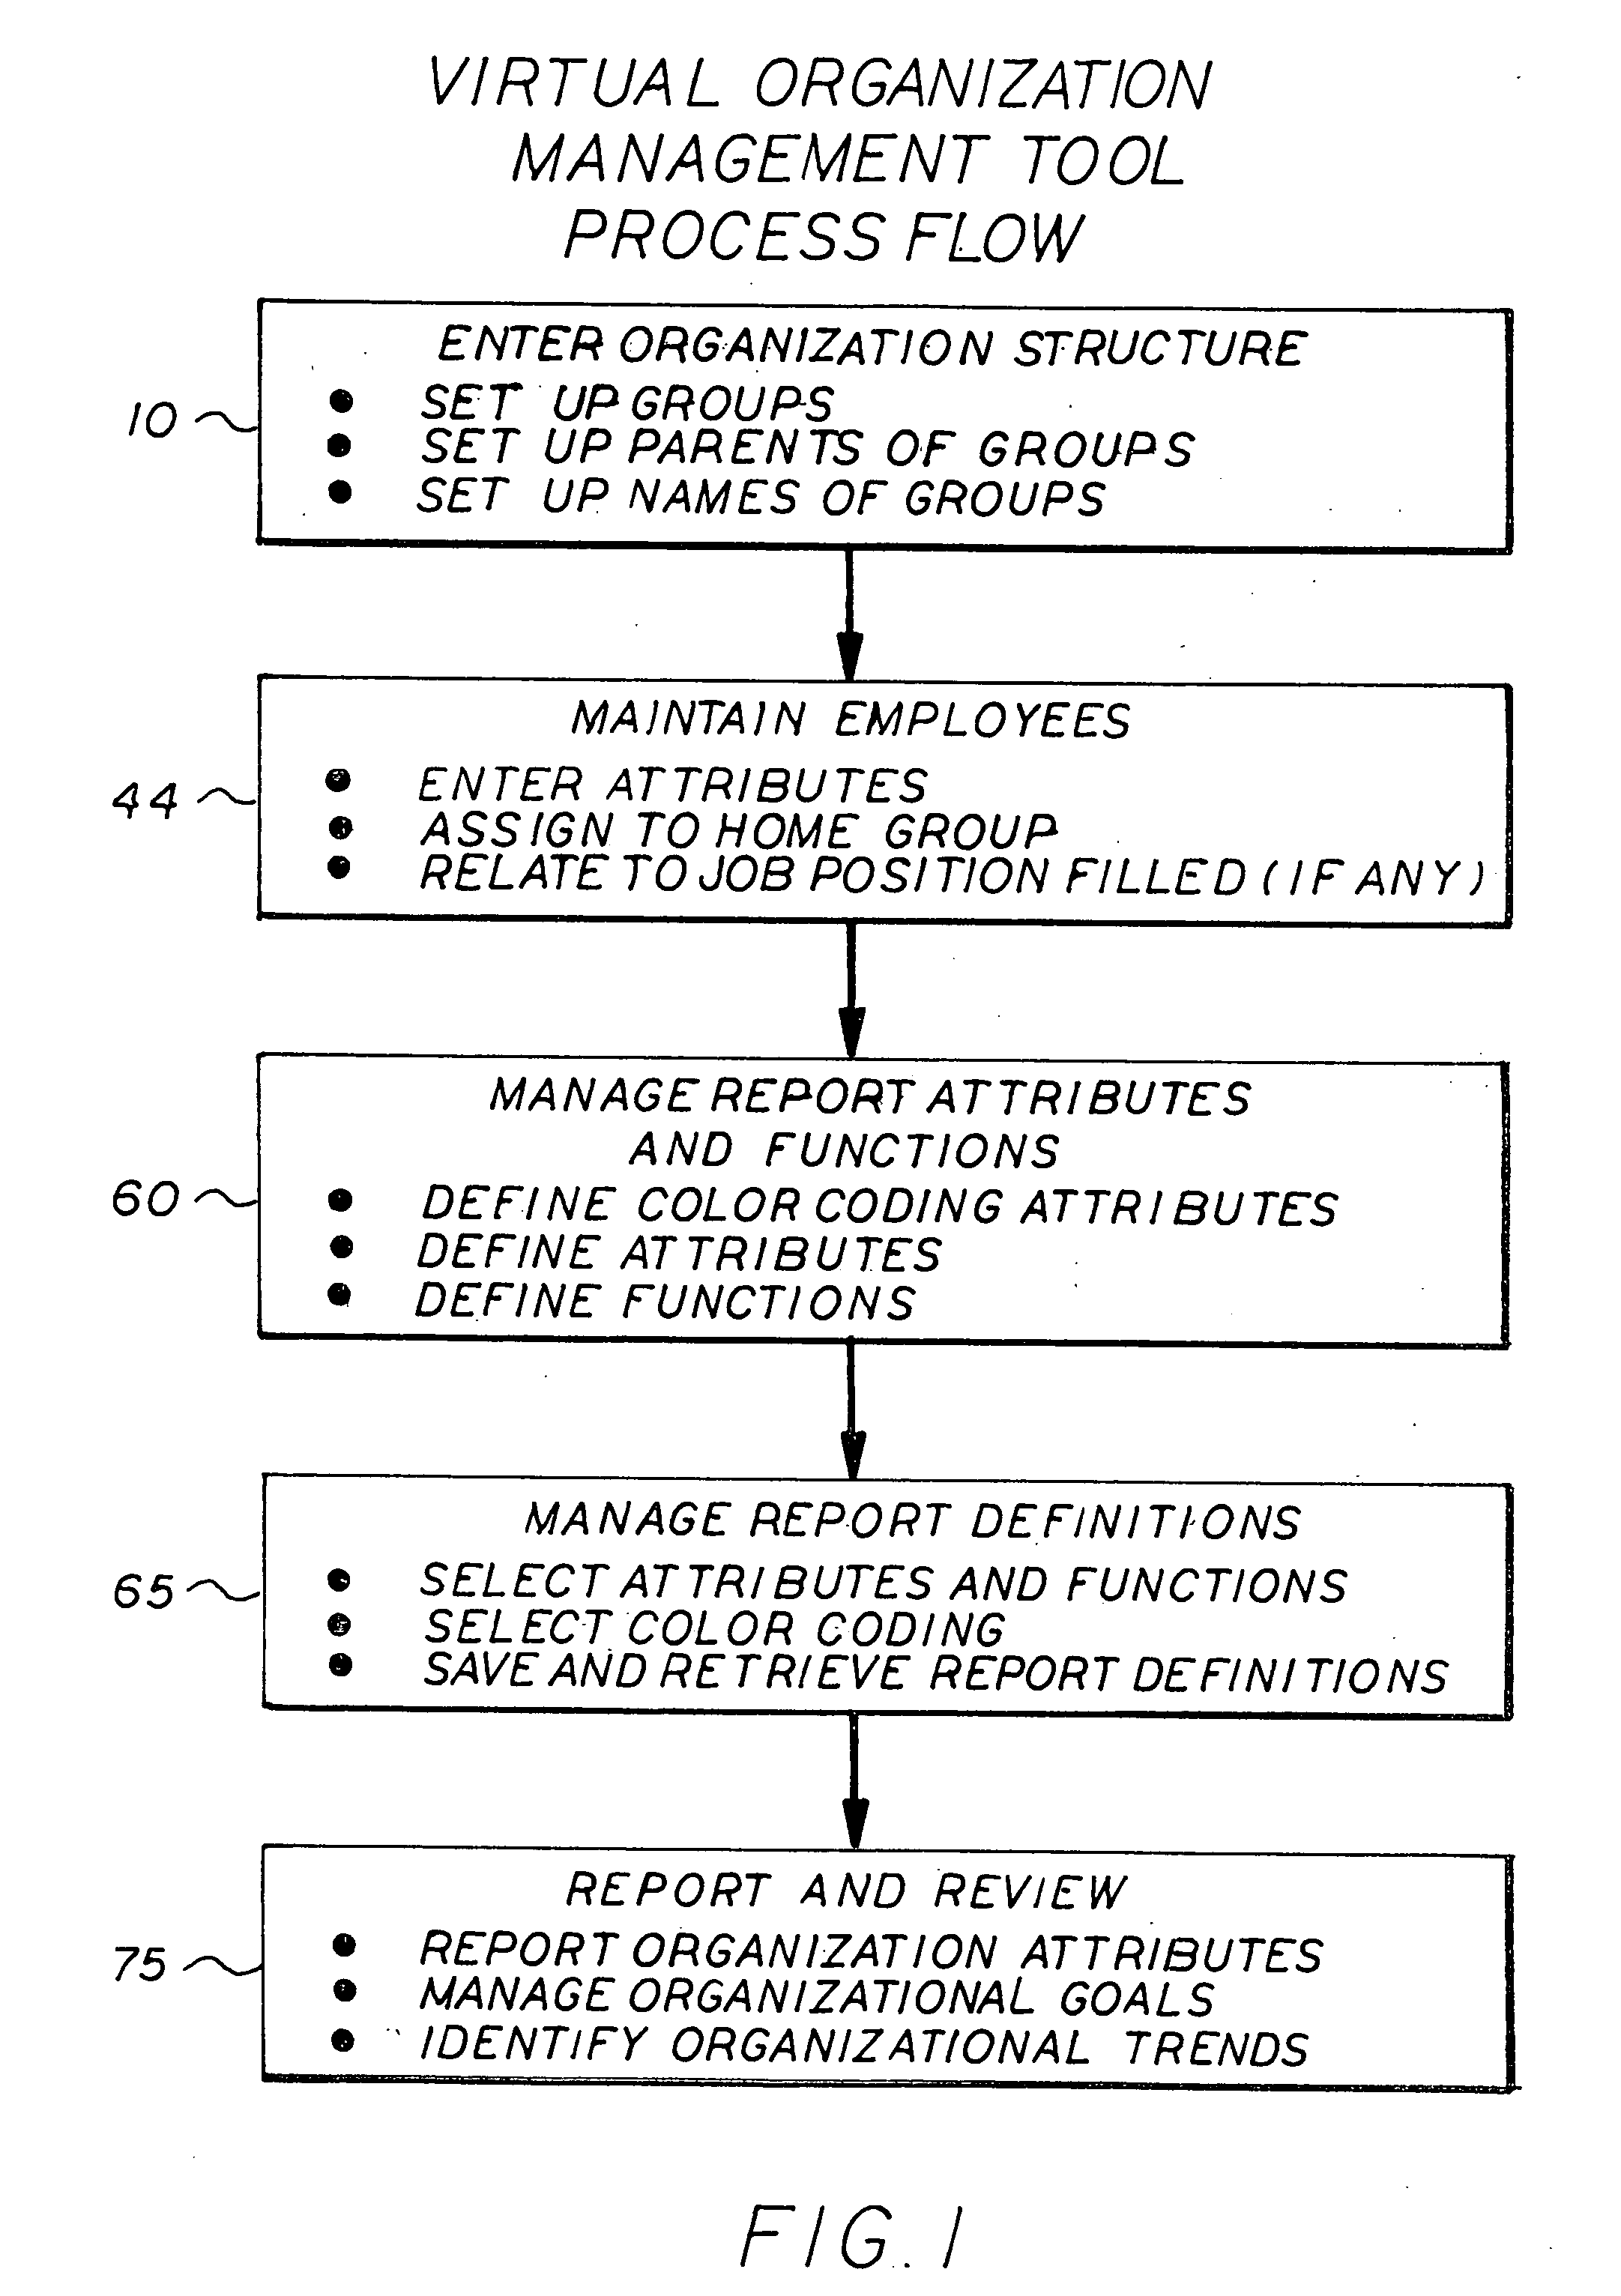
[0027]FIG. 1 illustrates the flow chart of the process used to prepare management organization charts. It makes use of a database management computer program, such as the one commercially provided by Oracle Corporation, a set of forms to enter the data, and a set of reports to extract the data.

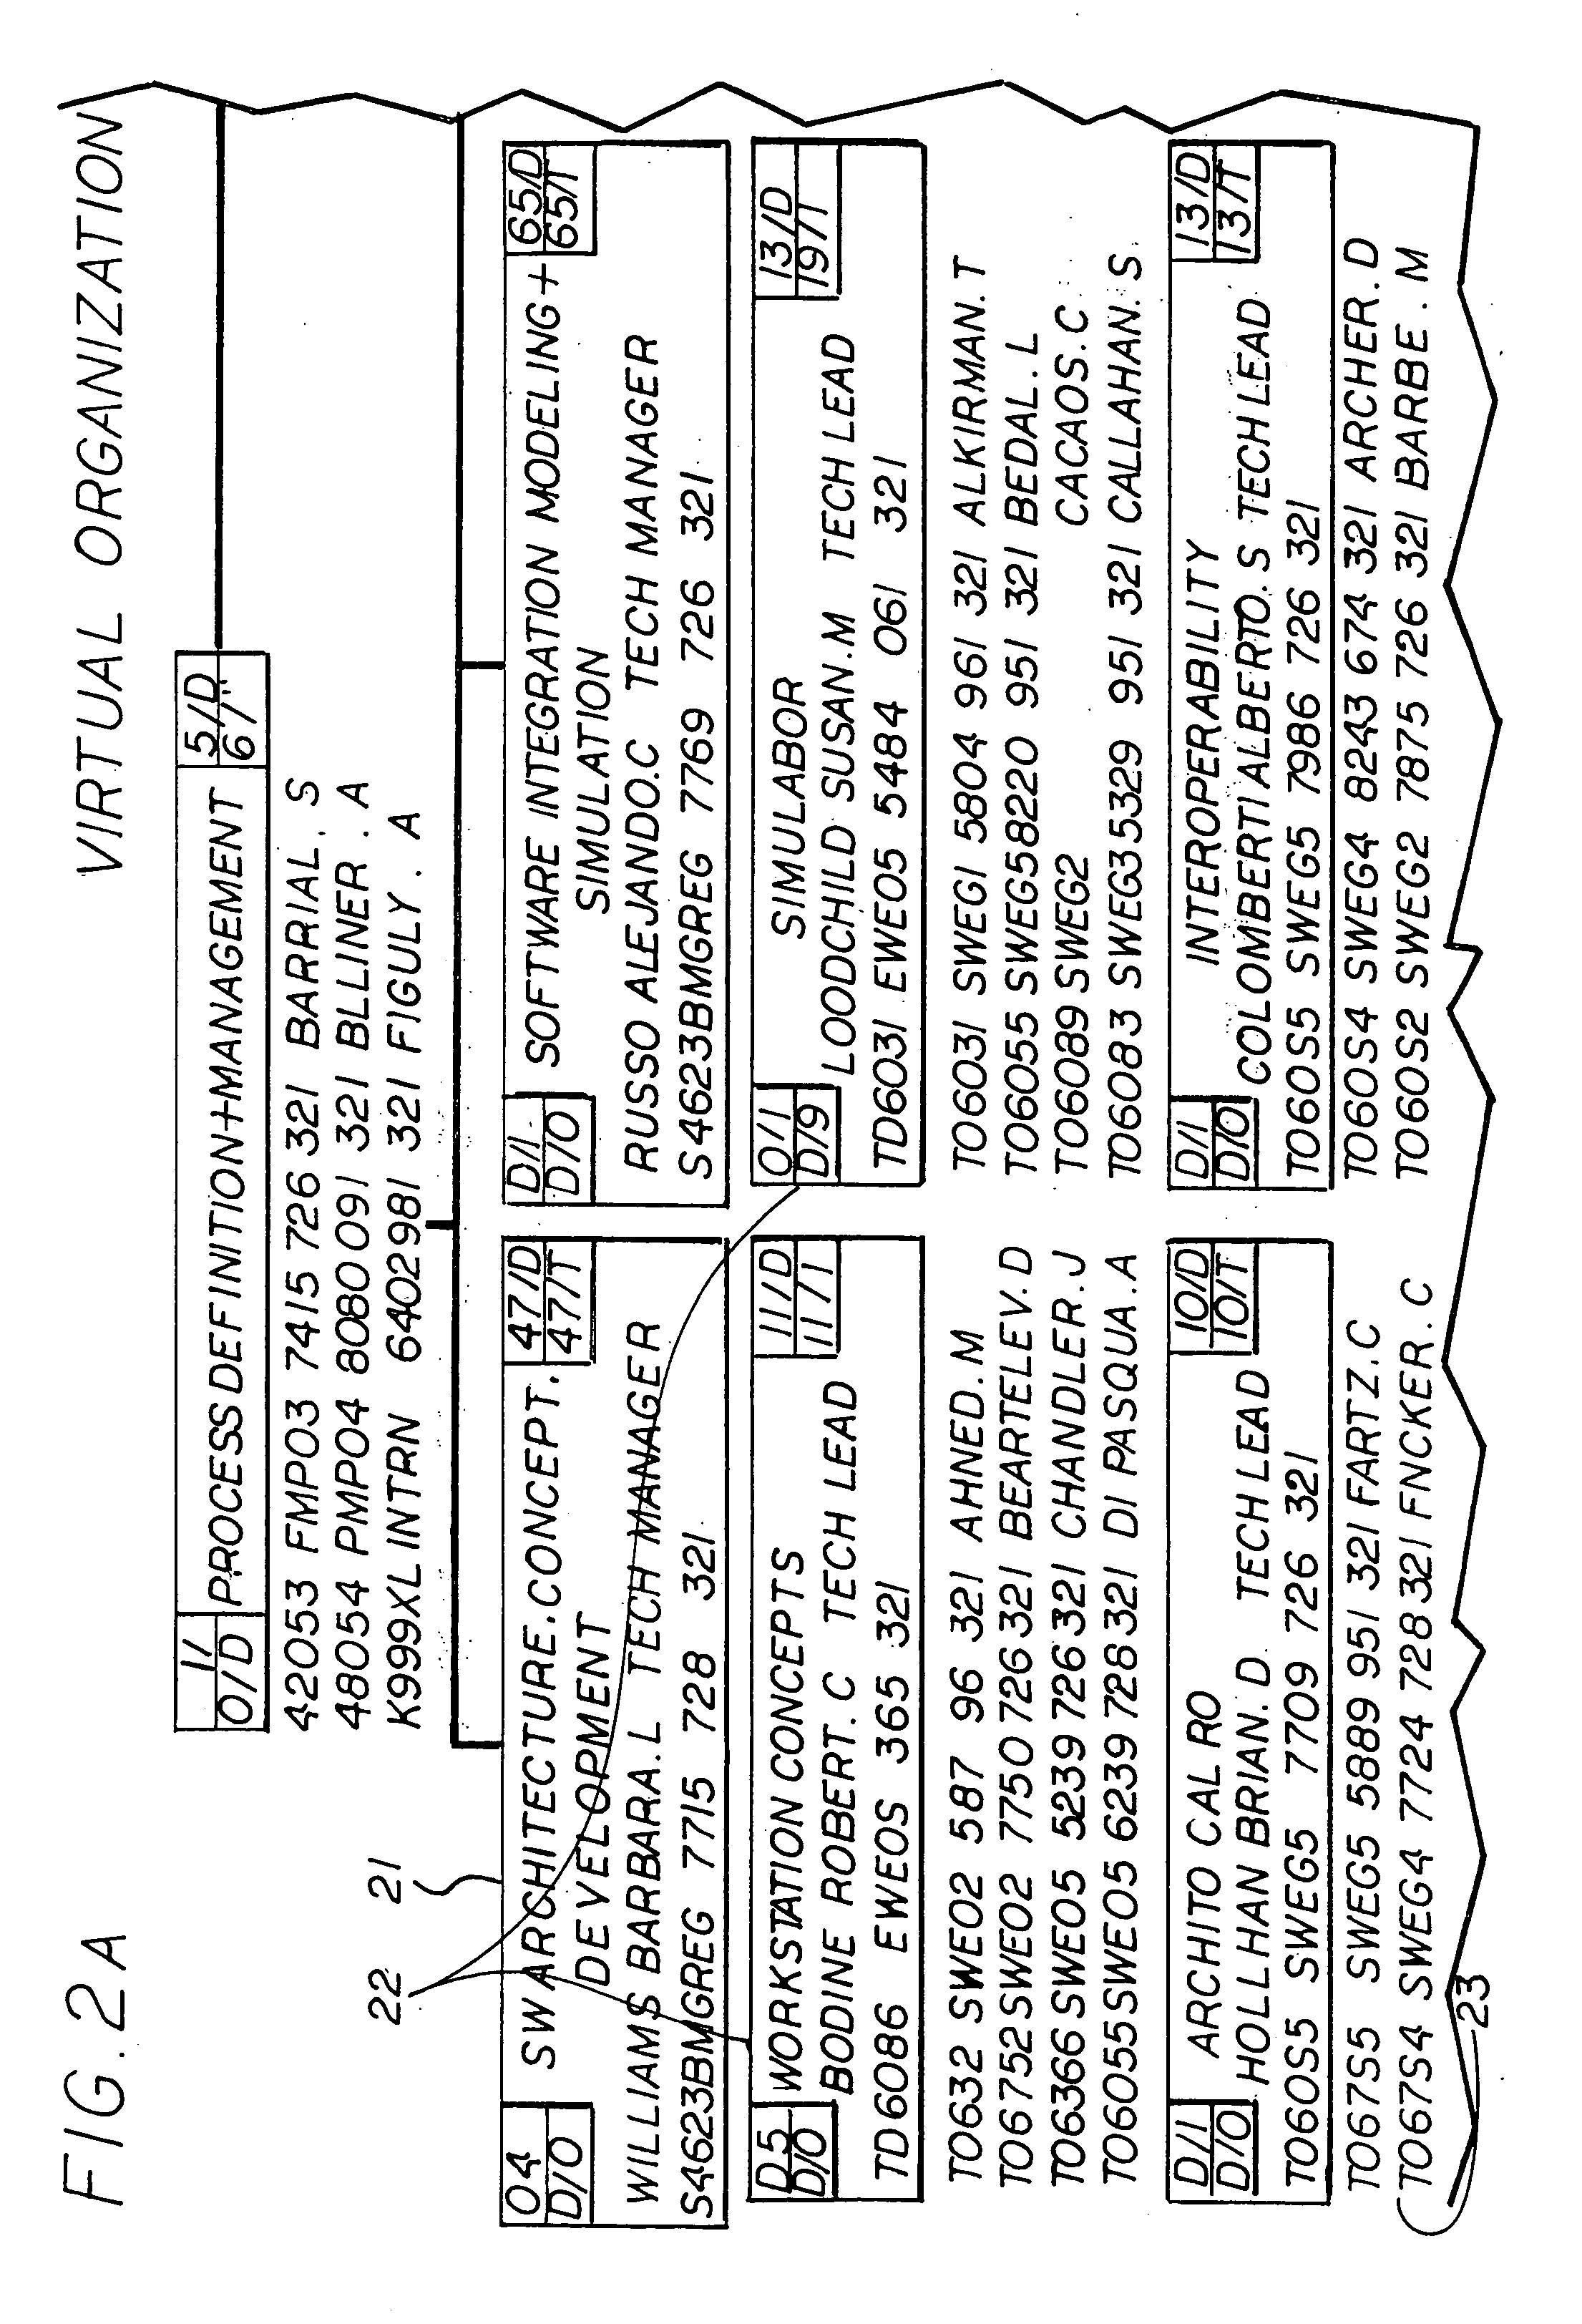
[0028]Step 10—Enter Organizational Structure. A typical management organization chart is illustrated in FIG. 2. This step defines the boxes used at the different levels of the chart using a unique group number identifier. In the example in FIG. 2, numeral 20 indicates a director's box, numeral 21 indicates a manager of multiple groups, and number 22 indicates a group level manager. This step assigns unique numbers and titles to the boxes (e.g. Web Design or Application Development) and the hierarchy of the boxes; not the employee names and attributes in or below the boxes. FIG. 3 illustrates a sample input screen where the groups (boxes) and the relationships between the groups are defined. Th...


PUM


Abstract

The invention is a process for managing organizational information and resources using a database management program, the process comprising the steps of: 1) defining the organization structure; 2) defining the attributes available for personnel in the structure; 3) entering the personnel attributes into the database; 4) creating and maintaining a set of report criteria that allow for dynamically selected and conditionally formatted attributes to be made into a management organization chart; and 5) using those report criteria to generate real-time organization charts for review.

Description

BACKGROUND OF THE INVENTION[0001]1. Field of the Invention[0002]The invention relates to the field of organization management computer programs and, in particular, to a process for virtual organization management that provides a manager with a real time view of the organization under his or her control, providing for the identification of personnel and organizational attributes at a glance.[0003]2. Description of Related Art[0004]In the past, in order to develop and track employees using organization charts, the charts had to be prepared using chart preparation programs such as Microsoft Corporation's Power Point™ or Visio™ computer programs. This was accomplished by the manual entering and formatting of data. Thus they were cumbersome to maintain and prone to errors. Secondly, these programs do not provide the ability to easily define employee attributes. This includes user entered attributes (e.g. hire date), calculated attributes (e.g. years of service based on hire date and toda...

Claims


Application Information

Patent Timeline
Patent Type & Authority Applications(United States)
IPC IPC(8): G06Q10/00G06Q30/00
CPCG06Q10/105G06Q10/06
Inventor VANLANGEN, FRANK J.GRANT, STEVE P.
Owner NORTHROP GRUMAN CORP
Learn More