Methods for risk-adjusted performance analysis

a risk-adjusted performance and analysis method technology, applied in the field of risk-adjusted performance measurement, can solve the problems of insufficient methods, inadequate measurement of performance and therefore quality of care, and difficulty in providing a comparison, and therefore a performance evaluation, between healthcare groups

Inactive Publication Date: 2008-06-26
BOARD OF RGT THE UNIV OF TEXAS SYST
View PDF3 Cites 21 Cited by
  • Summary
  • Abstract
  • Description
  • Claims
  • Application Information

AI Technical Summary

Benefits of technology

[0016]The present invention provides methods for risk-adjusted performance analysis. Methods are disclosed for measuring performance for a healthcare system that is less dependen

Problems solved by technology

These methods are not adequate because the resources needed to collect the specific data, or the relevancy of the specific data, does not provide an adequate measure of performance and therefore quality of care.
Furthermore, due to the different compositions of patients seen at different sites, it is difficult to provide a comparison, and therefore a performance evaluation, between healthcare groups such as remote healthcare facilities in a major hospital system to the major hospital system.
Until recently, using outcomes to measure performance has been difficult because the outcomes for treating a patient group with the same illness using the same therapy may be significantly different because of the specific risk factors of the patients in the patient group.
Likewise, if the actual outcome is worse than the calculated expected outcome, the performance is poor.
Likewise, if the difference between the average actual outcomes is worse than the average expected outcomes, the healthcare system performance is poor.
There are a number of drawbacks associated with using the above-identified method for measuring performance for a healthcare system.
This is a major problem because it requires a substantial amount of resources (e.g., time, labor, expenses, etc.) to gather the

Method used


Image

  • Methods for risk-adjusted performance analysis
  • Methods for risk-adjusted performance analysis
  • Methods for risk-adjusted performance analysis

Examples


example 1

Quality Control of a Hospital System

[0141]The following is a scenario to illustrate an embodiment of this invention. Specific names, times and other identifying information may be changed due to privacy issues.

[0142]Cancer Healthcare System is a major cancer healthcare system consisting of a large major medical center, “Center”, and a smaller clinic located in a different geographical location “Remote Clinic”. Currently, measuring performance of the Remote Clinic is done through review of the financial performance and evaluation of the quality of care at the Remote Clinic and comparing it to the performance of the Center. However, comparing the performance of the Remote Clinic to the Center is problematic because the patient profile (i.e., cancer type and stage) at the Remote Clinic is substantially different than the patient profile at the Center. As a result, comparison of the performance of the Remote Clinic to the Center is difficult.

[0143]Currently, evaluation of quality of car...

example 2

Breast Cancer Treatment Performance

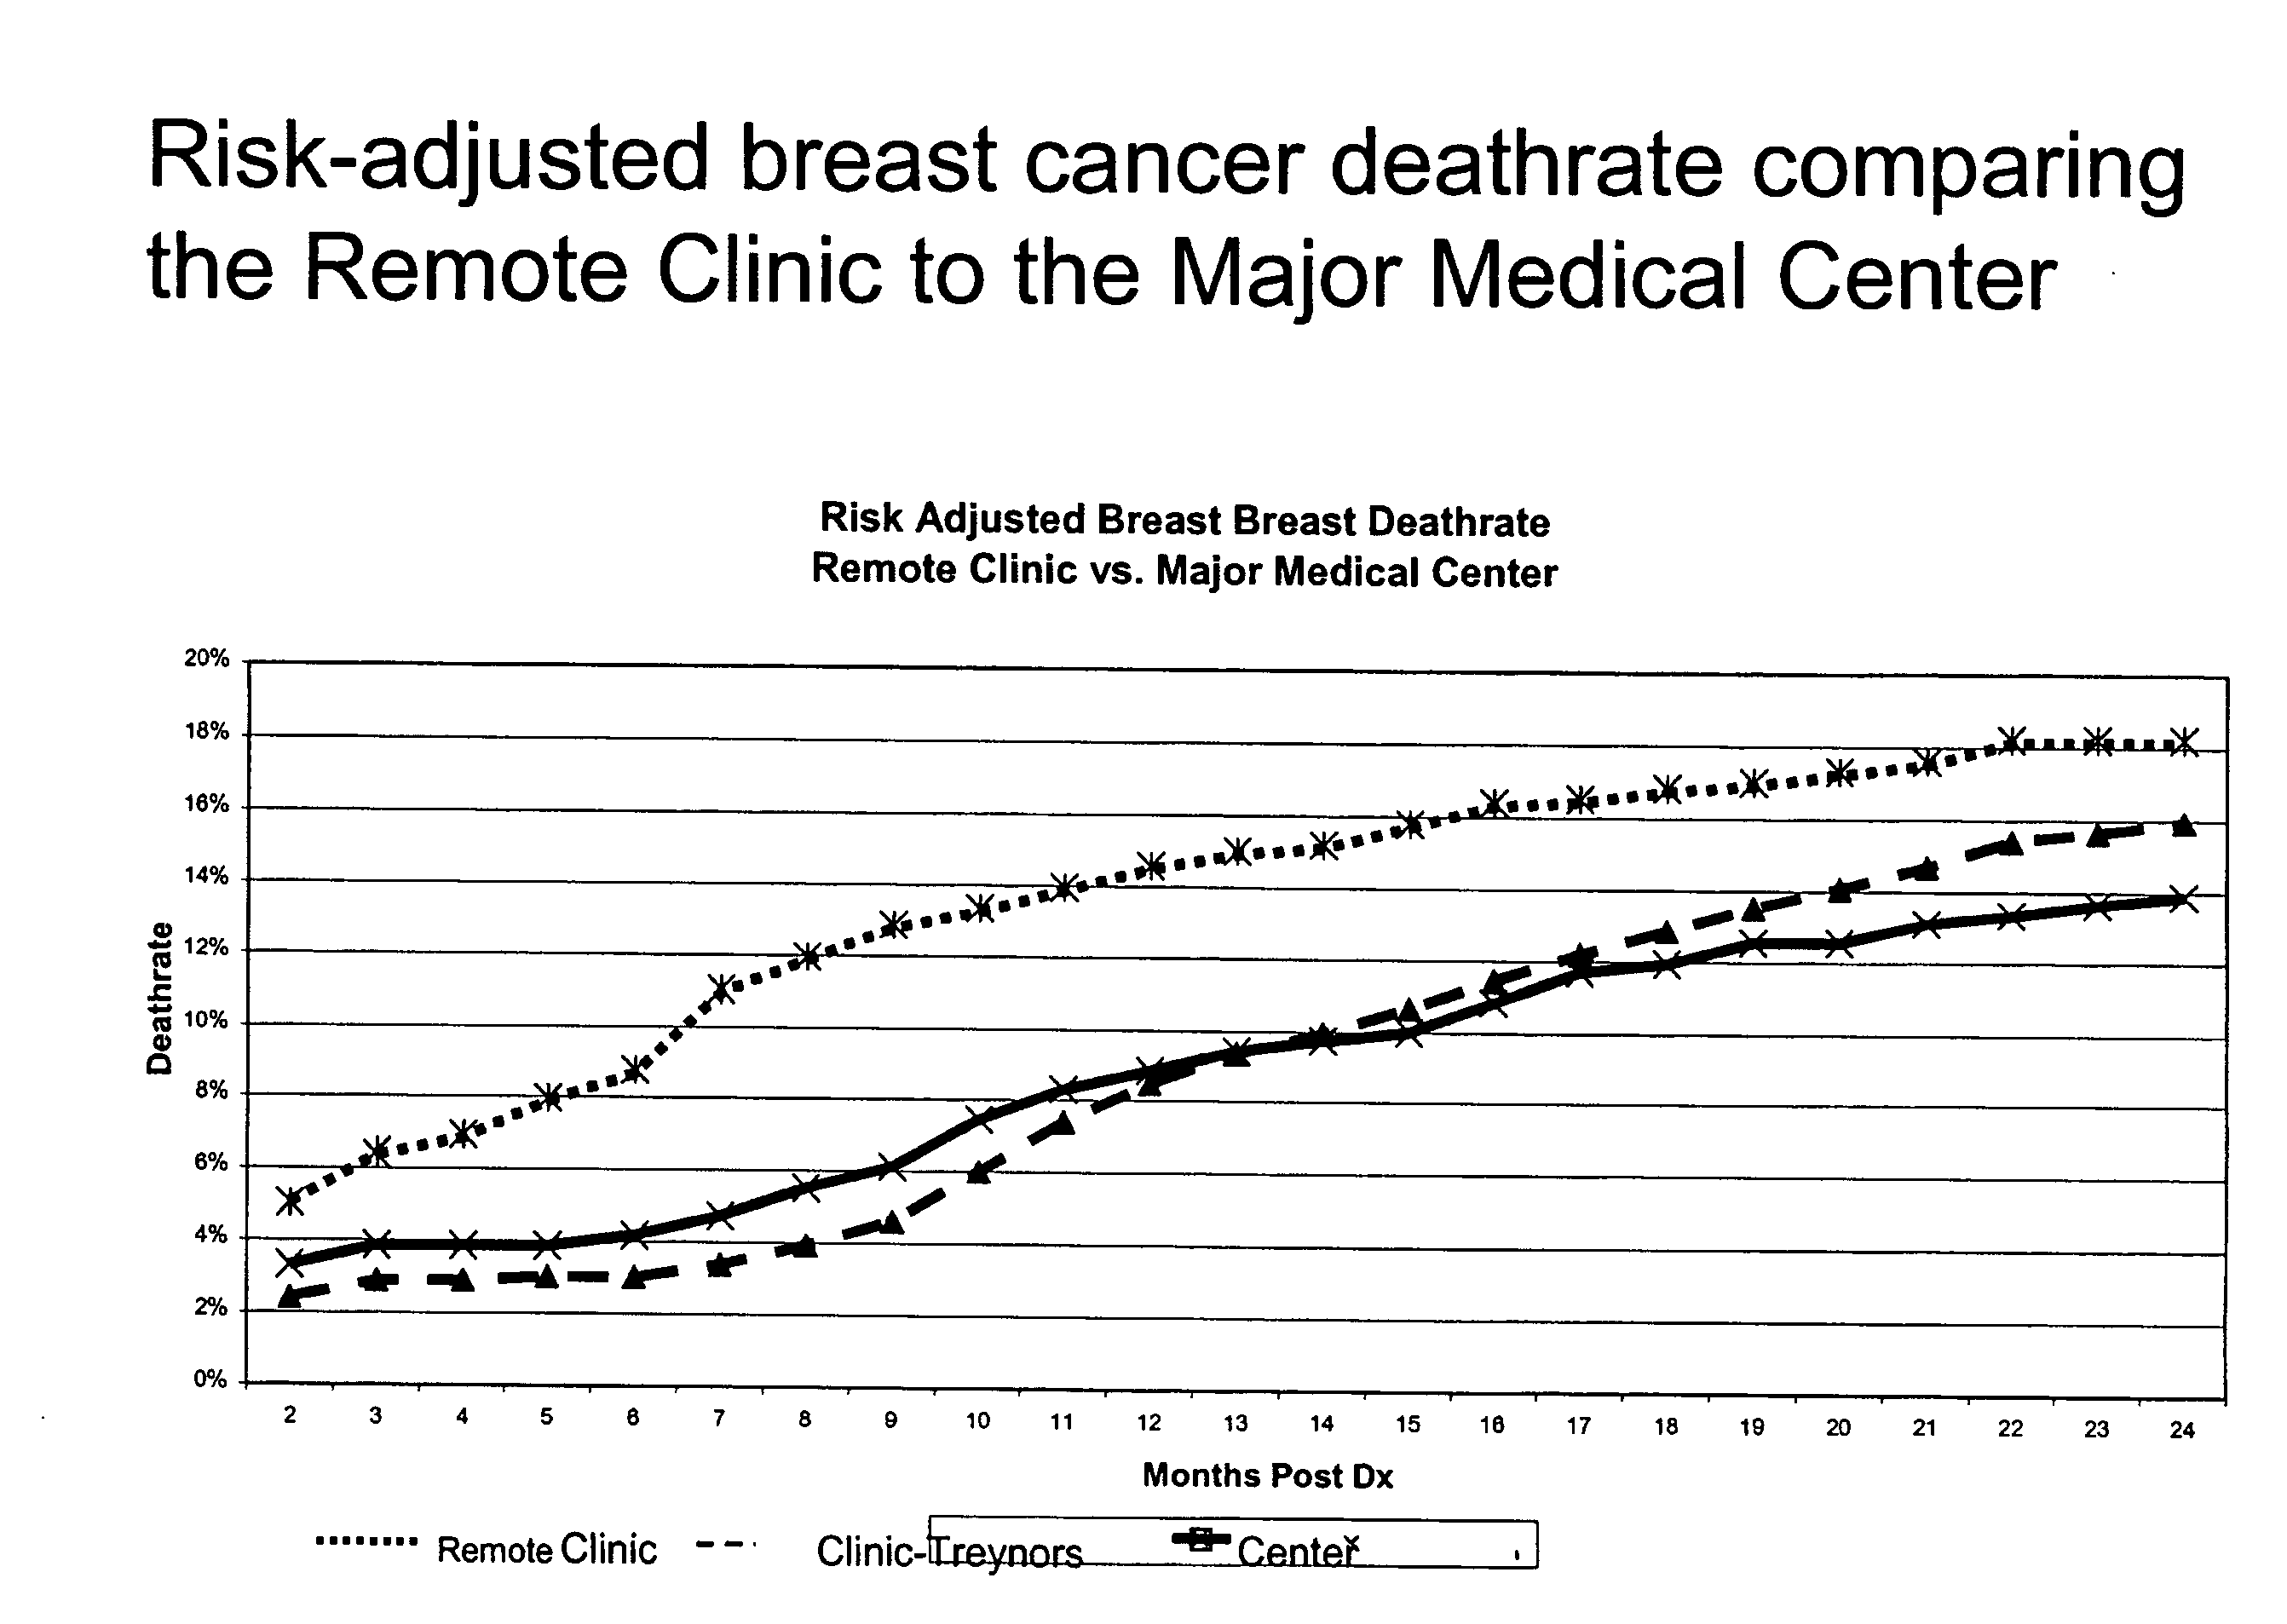
[0159]In the second example, the management from the Center is interested in how well the Remote Clinic is performing in terms of treatment for breast cancer. Specifically, the management from the Center is interested in comparing the breast cancer outcome, in terms of death rate, between the Remote Clinic and the Center.

[0160]FIG. 7 is a graph illustrating the breast cancer death rate between the Remote Clinic and the Major Medical Center over a period of 24 months post diagnosis of the patient's cancer. As depicted in FIG. 7, the Remote Clinic appears to have significantly poorer performance (i.e., higher death rate) in treating breast cancer than the Center. The Center's management is concerned that the physicians at the Remote Clinic may not be following the established guidelines or protocols established at the Center for the treatment of breast cancer. One issue that was brought to the attention of the Center's management is that the Remote C...

example 3

Pay-for-Performance

[0163]In addition to the Remote Clinic, the Center is associated with a small hospital (“MiniMed”) that has a number of physician groups including ten physician oncology groups (MD Group 1, MD Group 2, etc.). The management of the Center is interested in renegotiating the pay package it provides each of these community oncology groups based on performance. Initially, the Center's management based performance on the costs per patient seen by the different physician oncology groups at MiniMed.

[0164]FIG. 10 is a table that provides the performance of the ten physician oncology groups employed at MiniMed (column B). The differences between the performance of the ten physician oncology groups and the performance of MiniMed are shown in column C of the table. Based on this comparison, the performance of the 10 oncology physician groups at MiniMed had an averaged total treatment costs per patient of $142,417, which was better than MiniMed's average total treatment costs ...


PUM


Abstract

The present invention provides systems and methods for risk-adjusted performance analysis for a specific healthcare test, market or opportunity by evaluating patient outcomes against a real-time benchmark portfolio of patient outcomes. The risk-adjusted performance measures are based on financial methods such as CAPM, single-index model and arbitrage pricing theory methods. In place of examining the financial returns for a portfolio of companies against a financial benchmark, the outcomes for a patient or a portfolio of patients is compared to a benchmark portfolio of patient outcomes. The risk-adjusted performance measures including the Sharpe's measure, Treynor's measure, Jensen's measure and similar analysis tools are then used to compare different healthcare groups. The method has utility in many areas of healthcare including management of healthcare facilities, providing insurance reimbursement to a healthcare facility (e.g., “pay-for-performance”), making investment decisions in the healthcare marketplace and developing dynamic prognostic dynamic medical tests.

Description

CROSS-REFERENCE TO RELATED APPLICATIONS[0001]This application claims priority to U.S. Provisional Patent Application No. 60 / 876,675, filed Dec. 22, 2006, the contents of which is incorporated herein by reference in its entirety.FIELD OF THE INVENTION[0002]The present invention relates generally to providing risk-adjusted performance measurements for comparing various healthcare groups and opportunities and, in particular, to methods for determining and comparing different performance criteria as well as determining successful and not successful outcomes.BACKGROUND OF THE INVENTION[0003]Healthcare continues to evolve from single community hospitals to major hospital systems consisting of multiple hospitals and clinics in extended geographical locations. As the major hospital systems expand there is a need to provide a consistent level of quality care in the major hospital system's remote healthcare facilities. To provide a consistent level of quality care, healthcare institutions are...

Claims


Application Information

Patent Timeline
IPC IPC(8): G06Q50/00G06Q10/00G06Q40/00
CPCG06Q10/0635G06Q50/22G06Q40/00G16H40/20G16H50/30
Inventor CAPELLI, CHRISTOPHER C.LITTLE, WILLIAM T.
Owner BOARD OF RGT THE UNIV OF TEXAS SYST
Why Eureka
Try Eureka