
Sensory outputs for communicating data values

a technology of data values and sensory outputs, applied in the direction of repeater circuits, instruments, tactile signalling systems, etc., can solve the problems of visual impairment, difficulty in operating in the contemporary society of visually impaired persons, and a measure of eye sigh

Inactive Publication Date: 2010-06-03
MICROSOFT TECH LICENSING LLC
View PDF14 Cites 20 Cited by
  • Summary
  • Abstract
  • Description
  • Claims
  • Application Information

AI Technical Summary

Benefits of technology

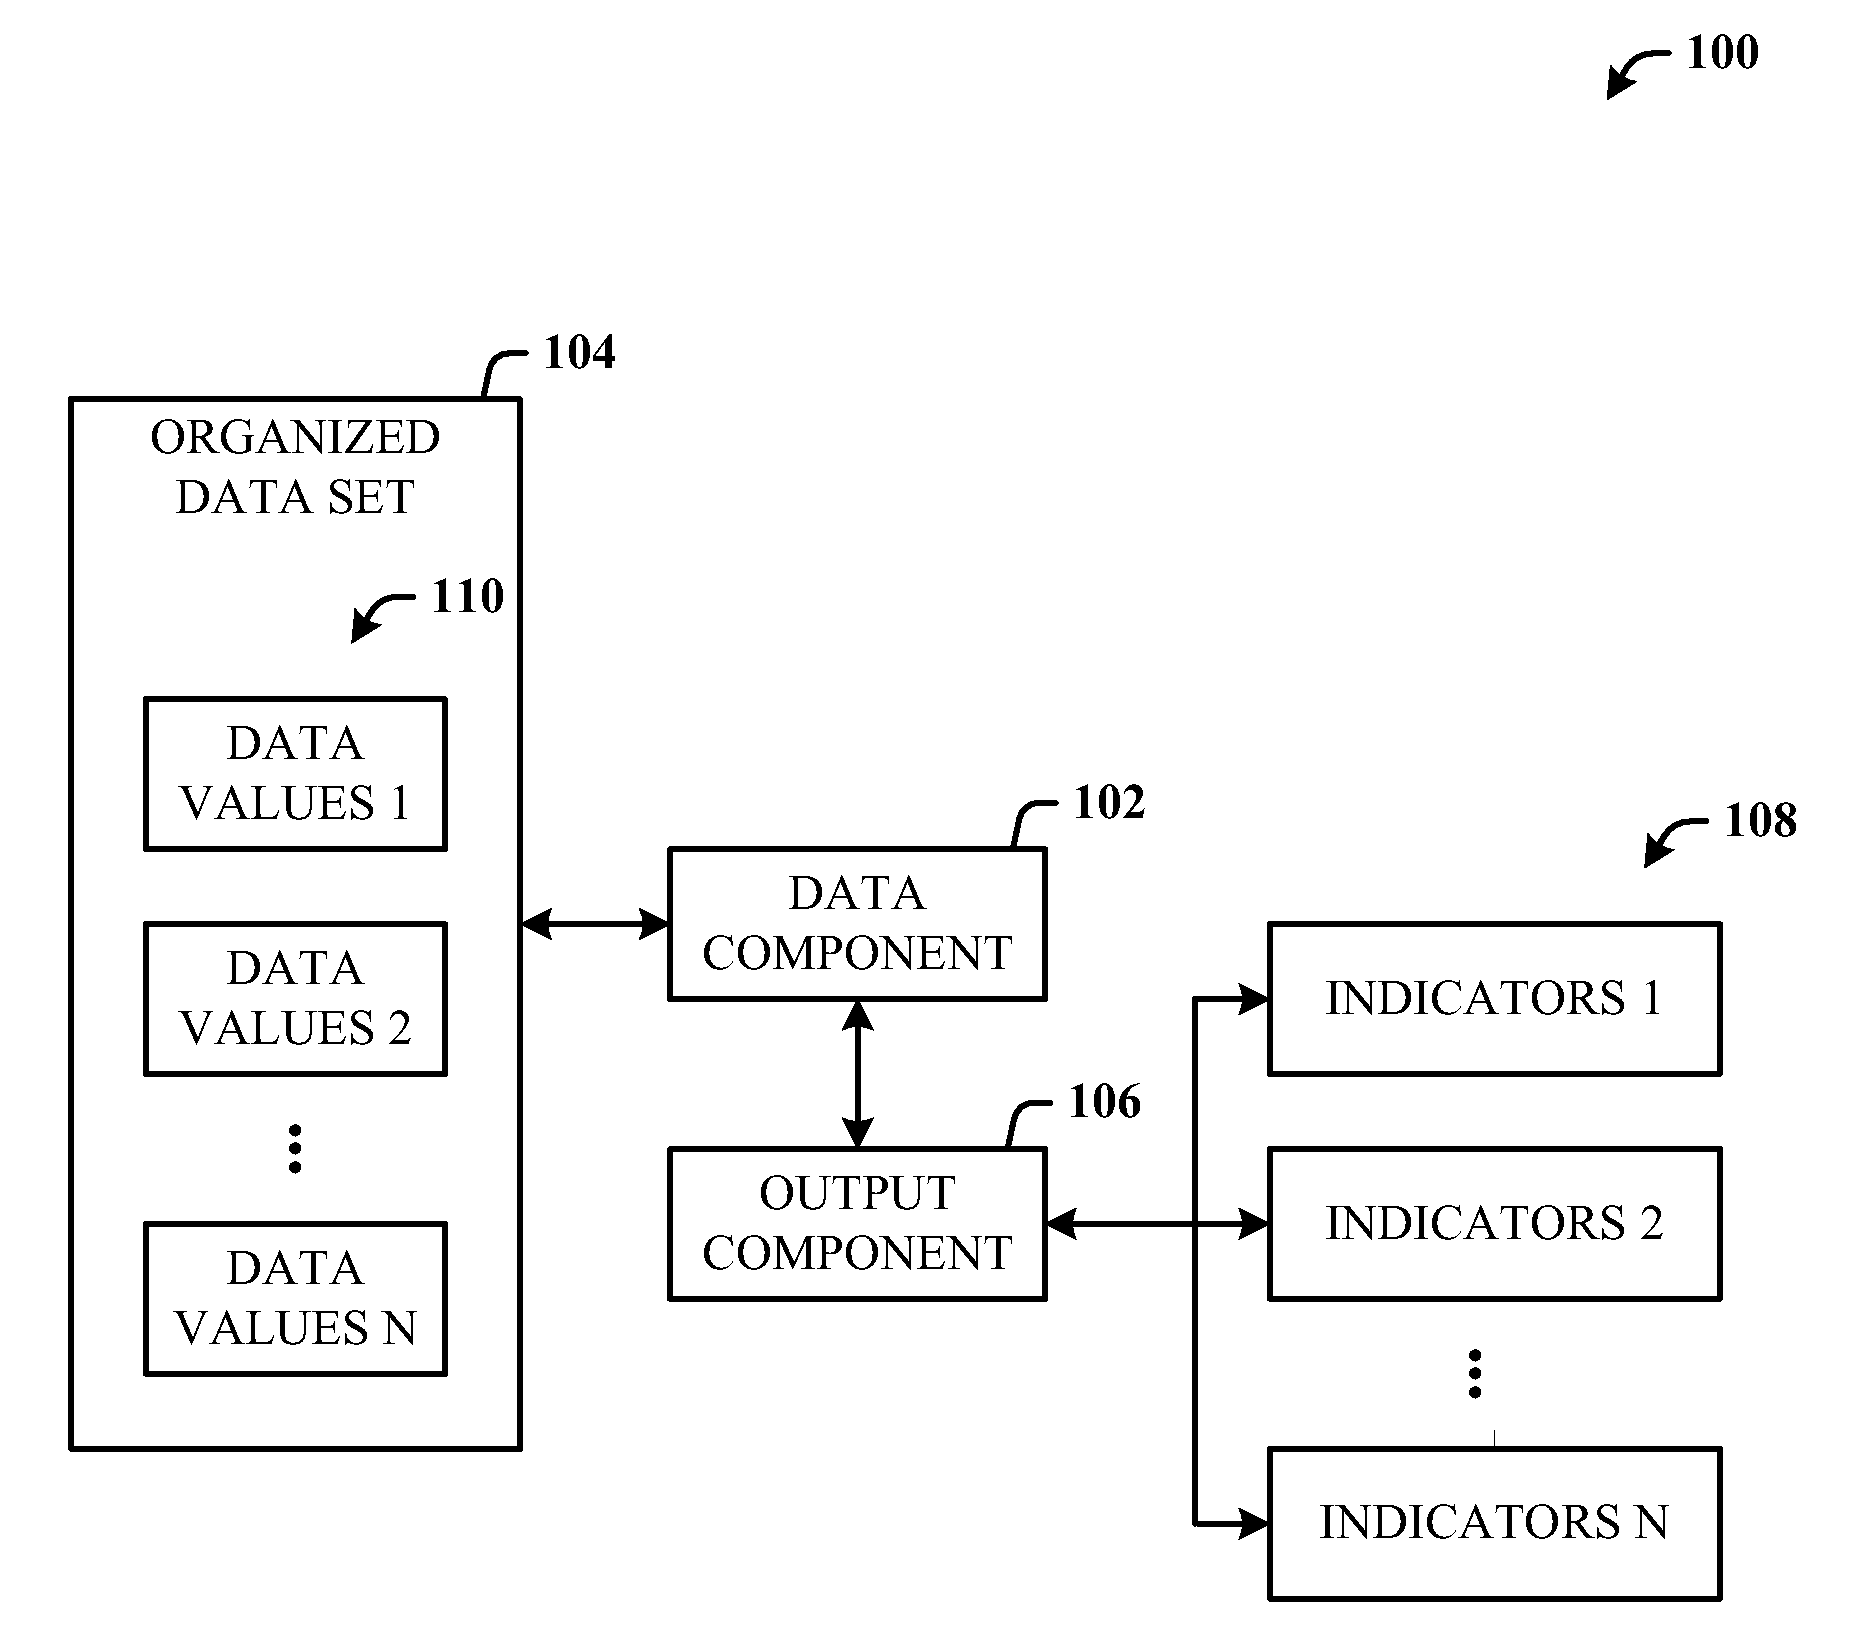
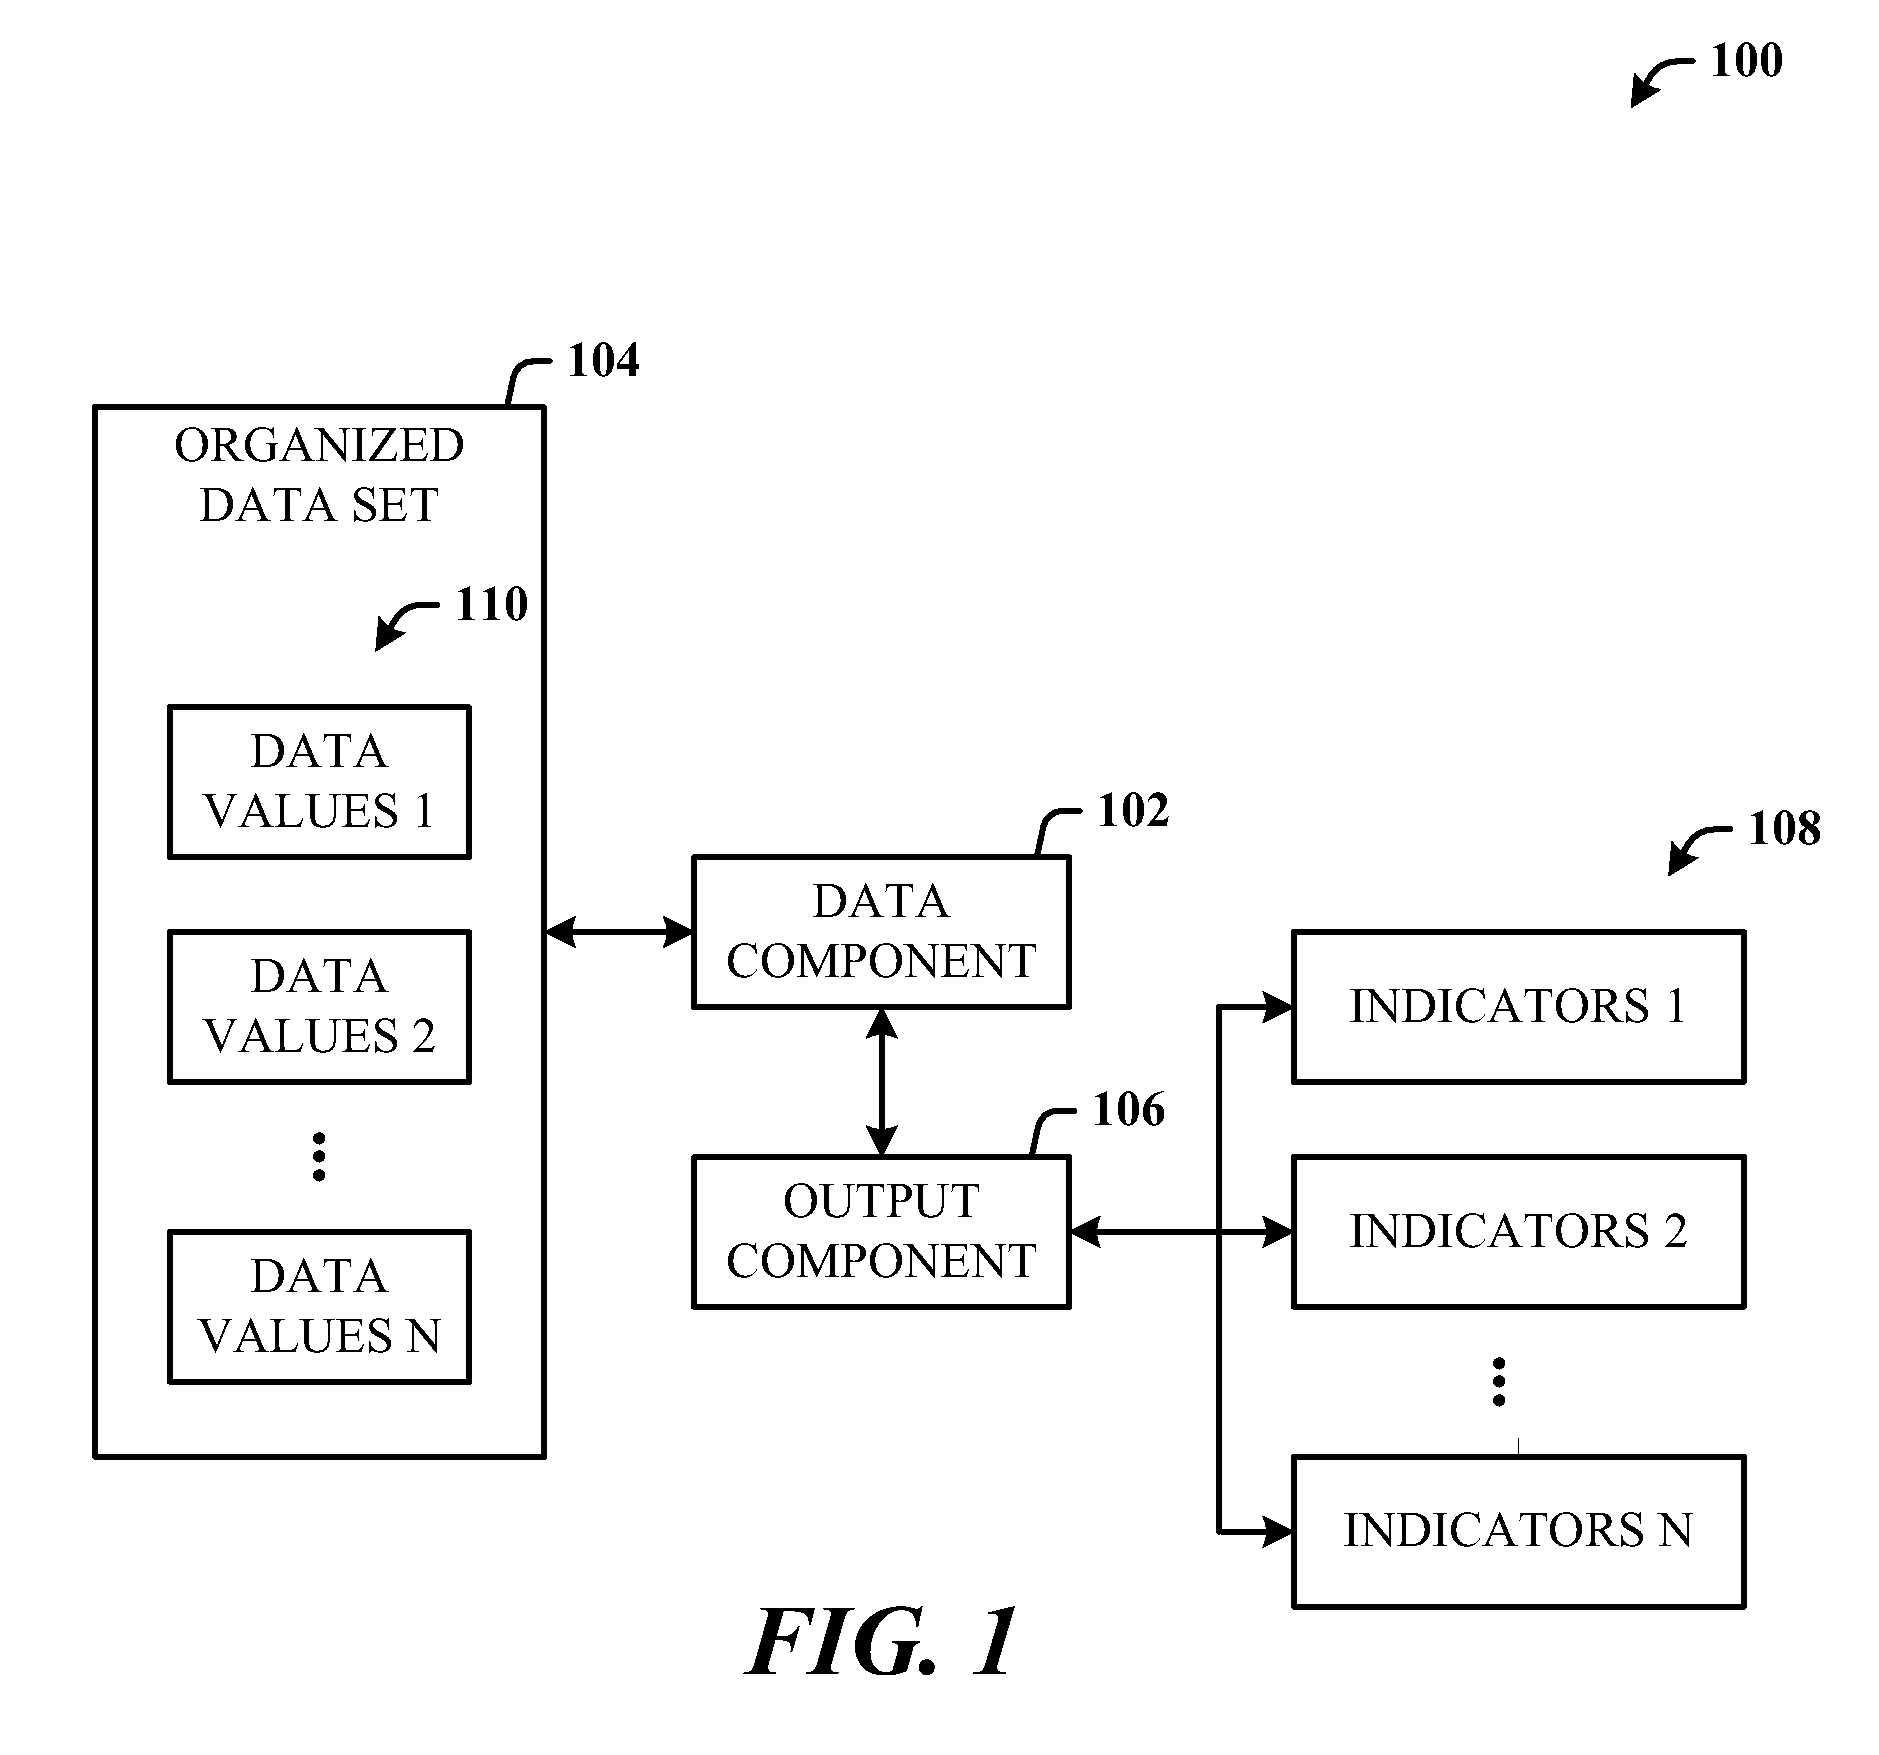
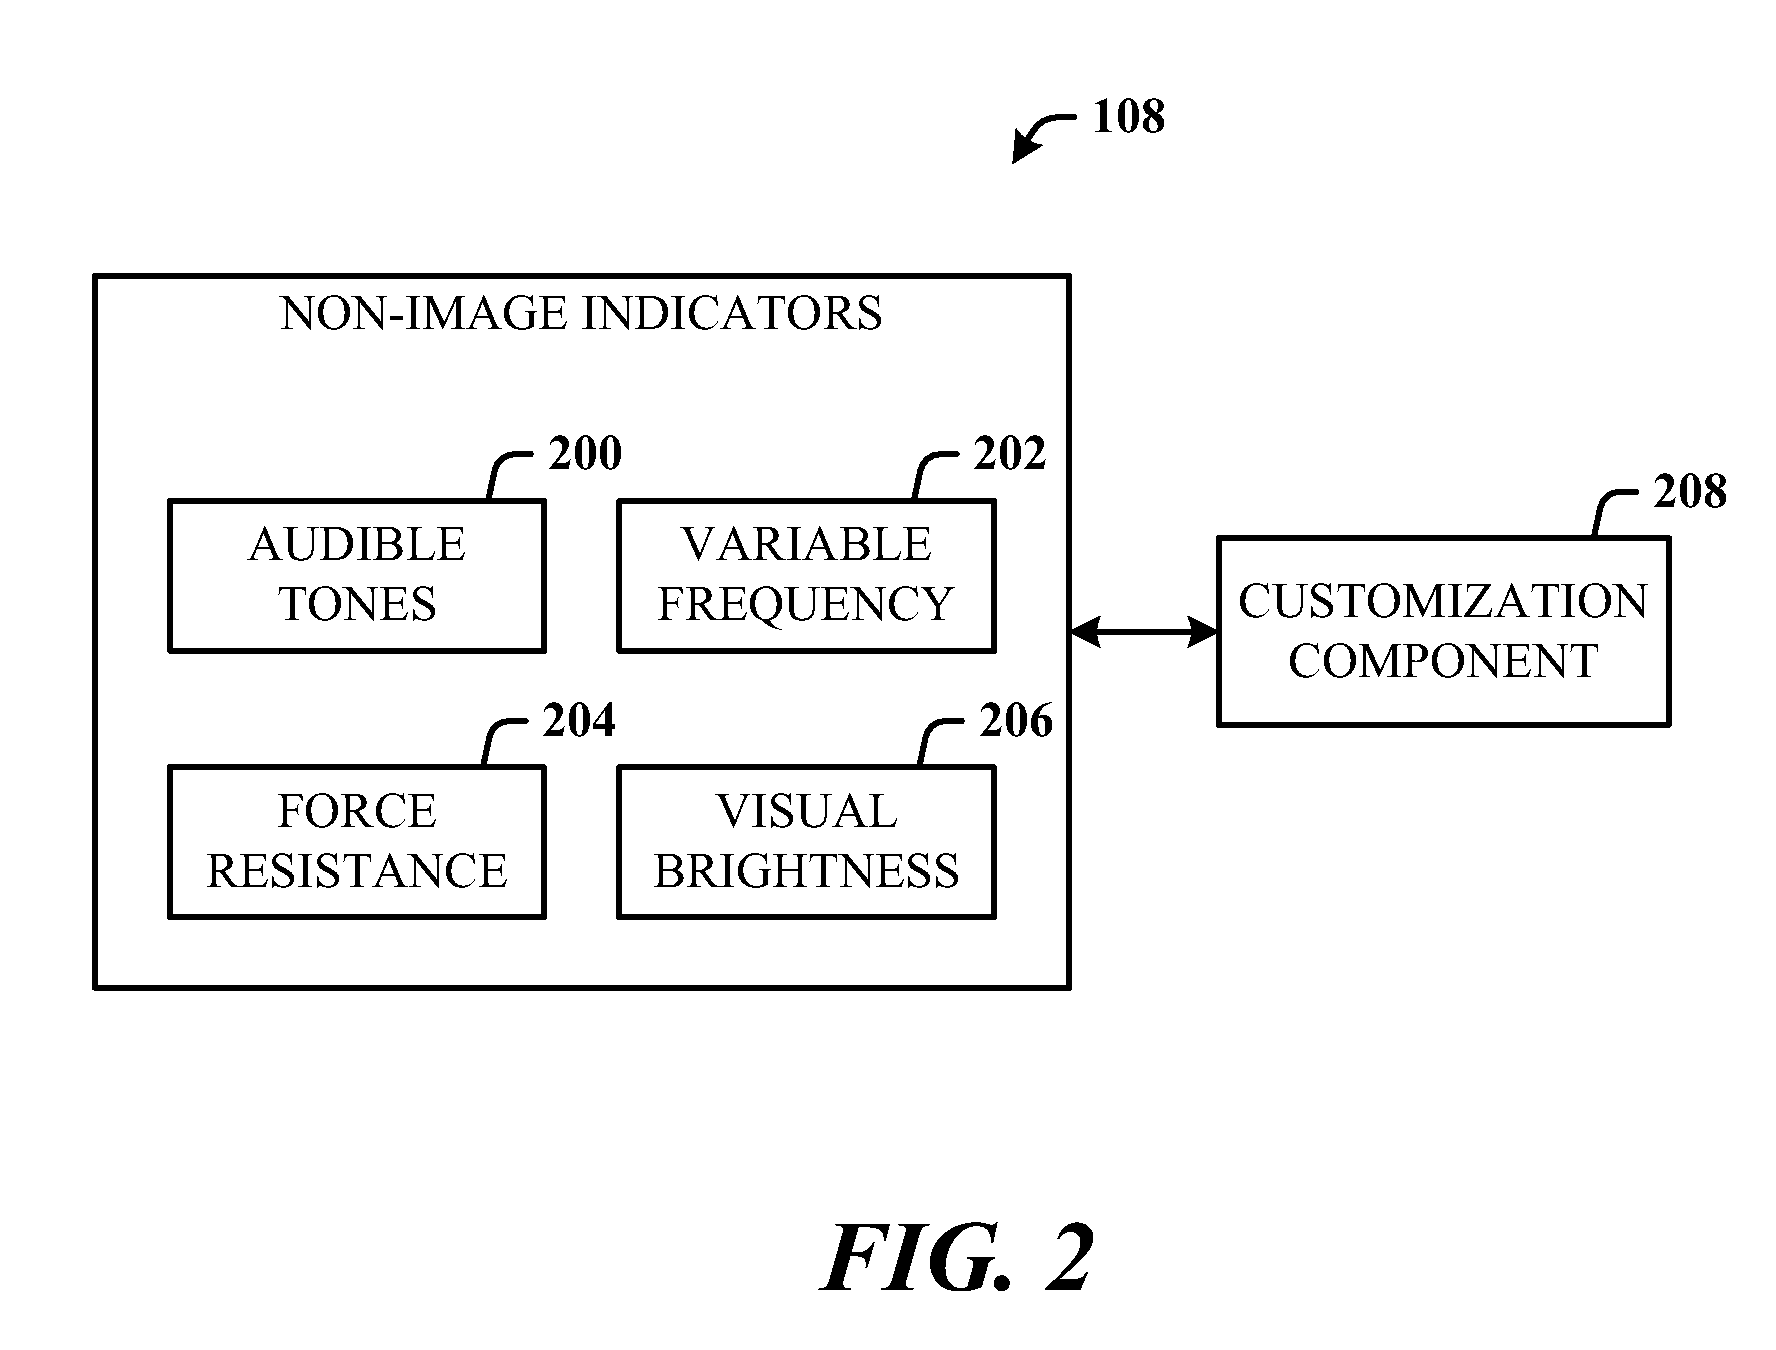
The patent describes a system that can take a set of organized data and turn it into a set of non-image indicators that correspond to the data values. These non-image indicators can be customized to the user's needs and can be in the form of audible tones that can be played based on the selected data values. The system can also allow the user to control the pitch variation between the tones. The technical effect of this system is that it provides a unique way for users to access and analyze data, making it easier to understand and interpret.

Problems solved by technology

Visually impaired persons have a measure of eyesight but cannot perceive a high level of detail as compared with people with fully-functioning eyesight.
Thus, visually impaired persons encounter a number of difficulties, especially with using a computer.
With the ubiquity of visually-oriented computer-based systems, visually impaired persons can find it increasingly difficult to operate in contemporary society.
However, visually impaired persons have difficulty analyzing numeric data presented on a computer monitor.
However, for visually impaired people, simply hearing numerical values spoken by a screen reader does not contribute to a cognitive appreciation of the relationships between various data points.
While listening to a string of numbers, it is difficult to comprehend a trend in those numbers or the proportional relationships between them.
Another problem with presenting numeric data to the visually impaired is conveying differences in numerical values that are small relative to the magnitudes of the numbers.
For example, it can be difficult to visually discern between data points that vary only slightly as viewed on a screen, where such differences can be represented by only one or two pixels.
However, such small differences are not easily discernable by visually impaired persons.

Method used


Image

  • Sensory outputs for communicating data values
  • Sensory outputs for communicating data values
  • Sensory outputs for communicating data values

Examples


Embodiment Construction

[0019]The disclosed architecture facilitates the communication of data values to visually-impaired users by generating for perception non-image indicators that correspond to the data values. For example, an organized data set such as a chart, a table, or a graph can be displayed on a computer monitor or other user interface output component. A user employs a mouse or other user input mechanism (e.g., cursor movement using a keyboard) to select a data value from the organized data set. One technique for more selective control of high density data points can be to allow the user to select a vertical line that extends the vertical limits of the chart, and which can be moved left or right along the x-axis of a graph, for example, such that the vertical line intersects each data point in a line or curve in the graph. In response thereto, a non-image indicator or signal such as an audible tone is generated that corresponds to the intersecting data point based on the corresponding data val...


PUM


Abstract

Architecture for communicating data values that enables visually impaired persons to perceive a non-image indicator corresponding to the data values. For example, an organized data set such as a chart or a graph can be displayed on a computer monitor or other user interface output component. A user employs a mouse or other user input component to select a data value from the organized data set. A non-image indicator such as an audible tone can be generated to correspond to the selected data value. A spread of audible tones corresponding to the organized data set is assigned across a range between a maximum data value and a minimum data value. A tonal separation is assigned between audible tones sufficient to enable the user to discern a pitch variation and corresponding change in data value.

Description

BACKGROUND[0001]Visually impaired persons have a measure of eyesight but cannot perceive a high level of detail as compared with people with fully-functioning eyesight. Thus, visually impaired persons encounter a number of difficulties, especially with using a computer. With the ubiquity of visually-oriented computer-based systems, visually impaired persons can find it increasingly difficult to operate in contemporary society.[0002]For people with functioning vision, viewing data on a chart or graph can be helpful for analyzing trends or observing differences between data points. However, visually impaired persons have difficulty analyzing numeric data presented on a computer monitor. Screen readers are known for helping the visually impaired interact with computers in general and in particular, to read numbers that appear sketchy. Screen readers can convert text on a screen into a simulated voice, thereby allowing an audible “reading” of the text.[0003]However, for visually impaire...

Claims


Application Information

Patent Timeline
Patent Type & Authority Applications(United States)
IPC IPC(8): G08B6/00G08B3/10
CPCG06F3/016G09B21/007G09B21/006G09B21/003G06F3/167
Inventor HEIMENDINGER, SCOTT M.
Owner MICROSOFT TECH LICENSING LLC
Learn More