Information Assisted Visual Interface, System, and Method for Identifying and Quantifying Multivariate Associations

a visual interface and information-aided technology, applied in the field of multivariate data analysis, can solve the problems of identifying environmental variables, seasonal hurricane activity has thus far been difficult, and conventional data analysis tools and techniques do not support the increasing quantity and number of different parameters of data for climate studies

Inactive Publication Date: 2010-07-29
THE UNITED STATES OF AMERICA AS REPRESENTED BY THE SECRETARY OF THE NAVY +1
View PDF18 Cites 37 Cited by
  • Summary
  • Abstract
  • Description
  • Claims
  • Application Information

AI Technical Summary

Benefits of technology

[0020]Further aspects of the present disclosure provide methods for identifying and / or quantifying sets of independent variables predictive of conditions of an identified dependent variable in a multivariate data set, as well as non-transitory computer readable medium having computer-executable instructions for implementing the methods. The methods include accessing a multivariate data set, rendering a parallel coordinates plot (PCP) view on a graphic display according to the multivariate data set using a processor-based system, where the PCP view includes a dependent variable portion including a dependent variable axis indicator visually displaying one or more attributes of a dependent variable of the data set and a plurality of independent variable portions individually including an independent variable axis indicator visually displaying one or more attributes of an independent variable of the data set, with the independent and dependent variable axis indicators being generally parallel and aligned with one another in an axis region of the PCP view. The methods further include receiving at least one user control input via a user interface, selectively modifying the PCP view according to the user control input, allowing the user to designate one of the axis indicators as being a selected axis indicator via the user control input, and allowing the user to select a particular axis indicator using an axis selection indicator via the user control input.

Problems solved by technology

In climate studies, for example, identifying environmental variables that have the greatest impact on the intensity and frequency of seasonal hurricane activity has thusfar been difficult due to uncertainty and complexity of dynamic, environmental data sets.
Conventional data analysis tools and techniques do not support the increasing quantity and number of different parameters in the data for climate studies.
As a result, the increased availability of additional environmental data has not lead to a commensurate improvement in the accuracy of seasonal forecasts or to improved preparedness to reduce the impact of natural disasters.
Regression analysis techniques are often complicated to establish, but provide an ordered list of the most important predictors for the dynamic parameters.
However, perceptual issues limit the effectiveness of this approach, particularly for large numbers of variables in a given multivariate data set.
This approach, however, requires a large amount of screen space, and forming multivariate associations is still mentally challenging.
Another alternative is to use layered plots, which condenses the information into a single display, but there are significant issues due to layer occlusion and interference, as demonstrated by C. G. Healey, L. Tateosian, J. T. Enns, and M. Remple. 2004.

Method used


Image

  • Information Assisted Visual Interface, System, and Method for Identifying and Quantifying Multivariate Associations
  • Information Assisted Visual Interface, System, and Method for Identifying and Quantifying Multivariate Associations
  • Information Assisted Visual Interface, System, and Method for Identifying and Quantifying Multivariate Associations

Examples


Embodiment Construction

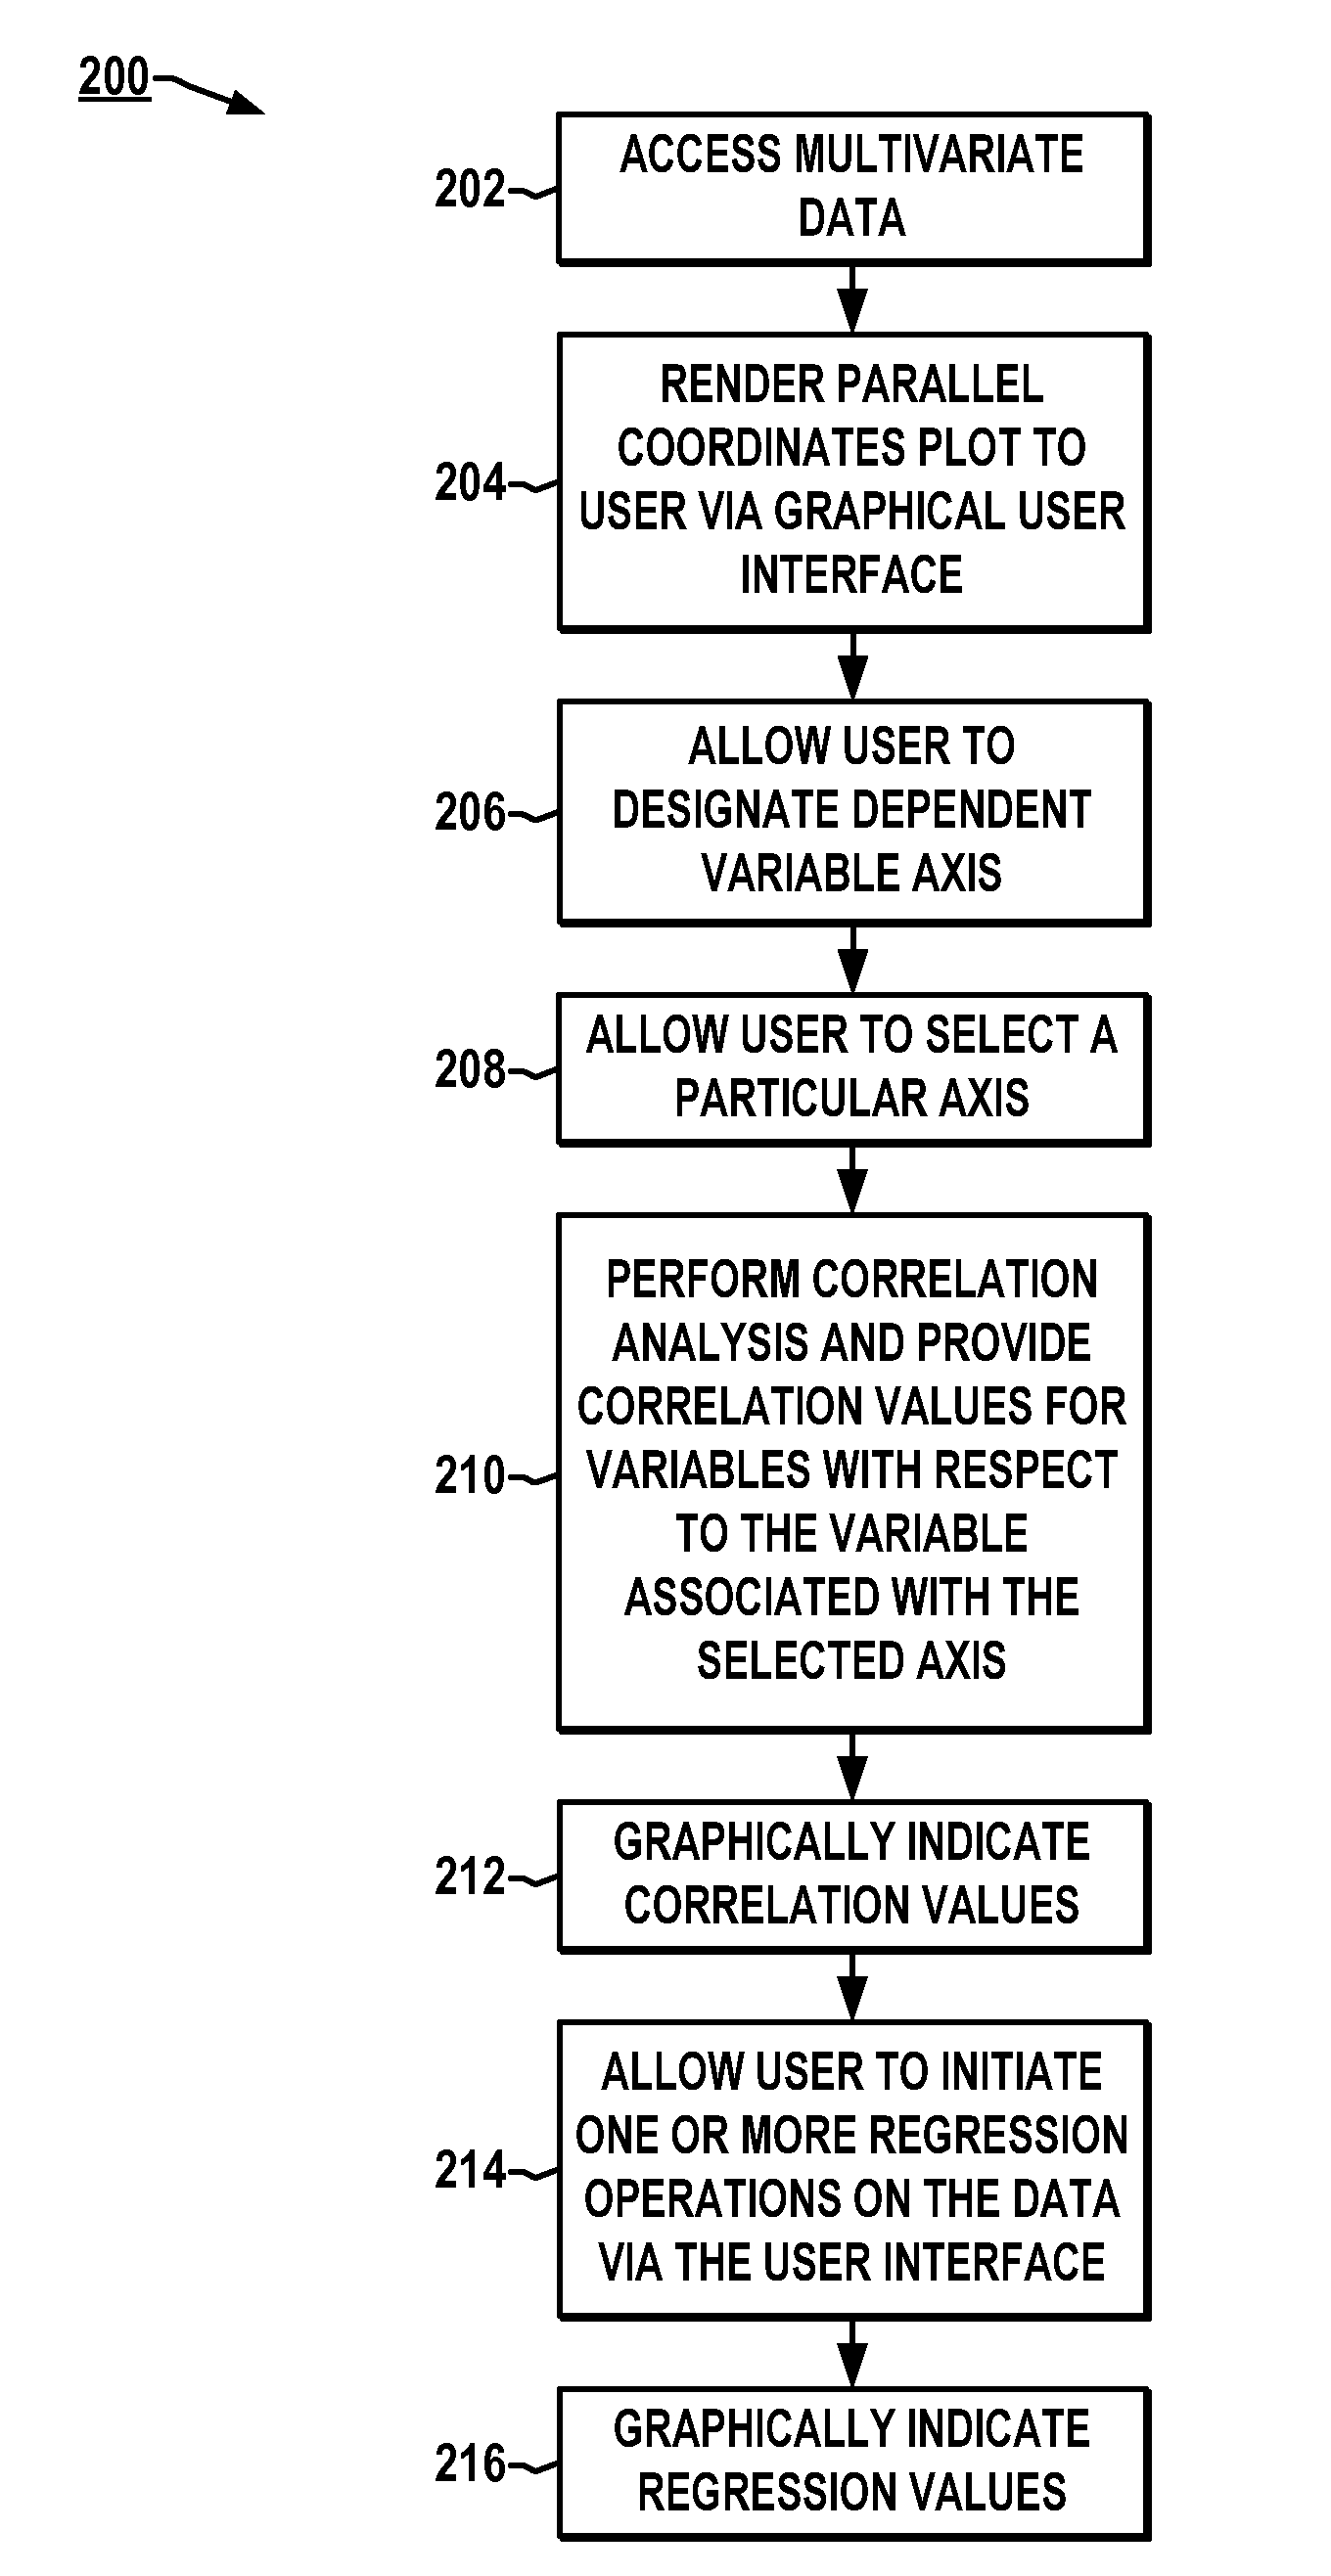
[0030]One or more embodiments or implementations are hereinafter described in conjunction with the drawings, where like reference numerals are used to refer to like elements throughout, and where the various features are not necessarily drawn to scale.

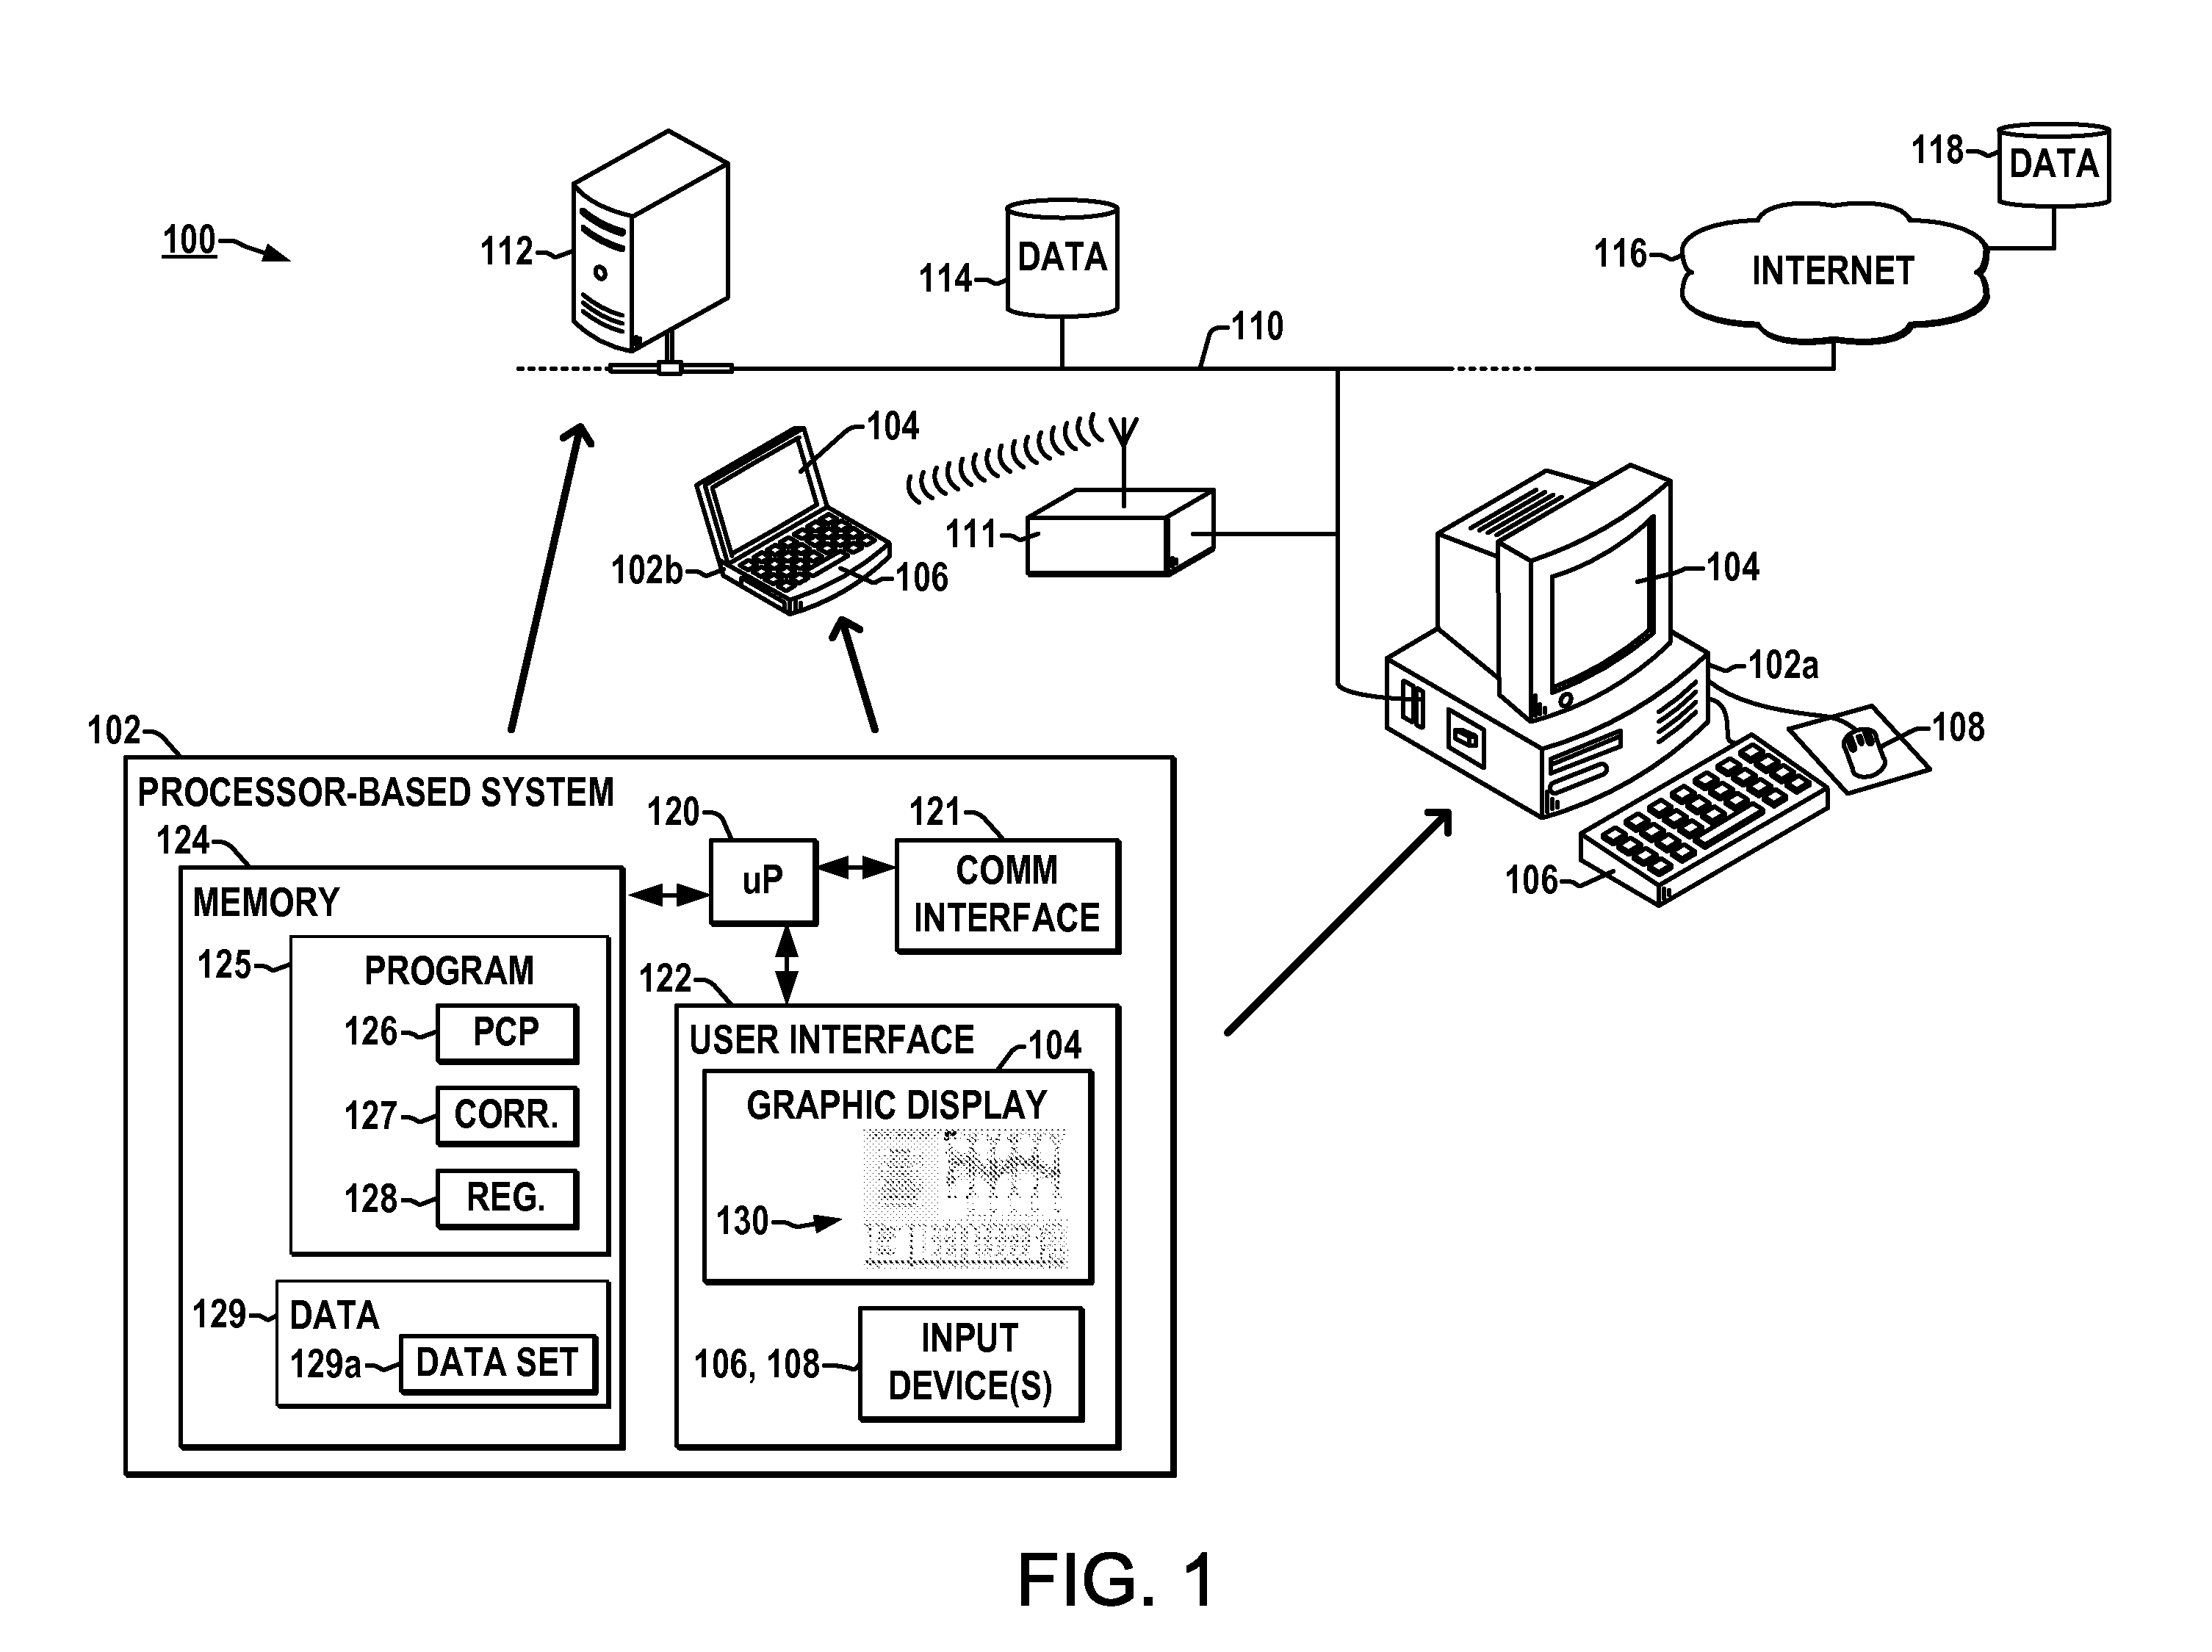
[0031]Referring initially to FIG. 1, an exemplary processing environment 100 is illustrated in which one or more aspects of the present disclosure may be practiced. The environment 100 includes one or more processor based systems 102 that may be implemented in a networked computing environment. In the illustrated example, a desktop computer 102a and a portable computer 102b are operatively coupled with a network 110, each of which including a graphical display 104 and one or more input devices, such as a keyboard 106, a mouse or other pointing device 108, microphones for speech commands, or other user input devices (not shown), where the portable computer 102b is coupled with the network 110 via a wireless transceiver 111. The network ...


PUM


Abstract

Systems and methods are presented in which interactive parallel coordinates capabilities are combined with automated correlation and regression tools providing advanced visual user interface utilities to facilitate identification of associations in multivariate data.

Description

CROSS-REFERENCE TO RELATED APPLICATION[0001]This application claims priority to and the benefit of U.S. Provisional Patent Application Ser. No. 61 / 146,717, filed Jan. 23, 2009, entitled “Parallel Coordinates Analytic Toolkit for Multivariate Data Analysis”, the entirety of which is hereby incorporated by reference.FIELD OF THE DISCLOSURE[0002]The present disclosure relates generally to multivariate data analysis and more particularly to systems and methods for identifying and / or quantifying sets of independent variables that are highly predictive of conditions of an identified dependent variable in a data set.BACKGROUND[0003]Analysis of multivariate data is useful for predicting environmental conditions such as cyclones and more generally for identifying and / or quantifying associations between a set of interrelated variables. In climate studies, for example, identifying environmental variables that have the greatest impact on the intensity and frequency of seasonal hurricane activit...

Claims


Application Information

Patent Timeline
Patent Type & Authority Applications(United States)
IPC IPC(8): G06F15/18G06F17/00G01W1/00
CPCG06T11/206
Inventor STEED, CHAD A.SWAN, II, J. EDWARDJANKUN-KELLY, T. J.FITZPATRICK, PATRICK J.
Owner THE UNITED STATES OF AMERICA AS REPRESENTED BY THE SECRETARY OF THE NAVY
Why Eureka
Try Eureka