Cluster mapping to highlight areas of electrical congestion

a technology of congestion and clustering information, applied in the field of information visualization methods, can solve the problems of difficult to effectively present these assets, difficult to achieve effective presentation, and difficult to create heat maps in electrical utility applications, so as to minimize the time, minimize the time, and minimize the time

Inactive Publication Date: 2013-01-17
ENGIE STORAGE SERVICES NA LLC
View PDF5 Cites 229 Cited by
  • Summary
  • Abstract
  • Description
  • Claims
  • Application Information

AI Technical Summary

Benefits of technology

[0016]The heat index clustering algorithms are designed to optimize electrical hotspot detection in the distribution grid, microgrid, or within a building in at least one of the following ways: (1) minimizing the time required to identify utility assets, microgrid subsystems, or building circuits under heavy loading, (2) minimizing the time required to for

Problems solved by technology

Heat maps are particularly challenging to create in electrical utility applications.
There are many assets and points of interest in an electrical distribution grid, but not many ways to effectively present info

Method used


Image

  • Cluster mapping to highlight areas of electrical congestion
  • Cluster mapping to highlight areas of electrical congestion
  • Cluster mapping to highlight areas of electrical congestion

Examples


Embodiment Construction

[0030]The detailed description set forth below in connection with the appended drawings is intended as a description of the presently preferred embodiments of systems and methods provided in accordance with aspects of the present invention and is not intended to represent the only forms in which the present invention may be constructed or utilized. The description sets forth the features and steps for making and using the test systems and methods of the present invention in connection with the illustrated embodiments. It is to be understood, however, that the same or equivalent functions and structures may be accomplished by different embodiments that are also intended to be encompassed within the spirit and scope of the invention.

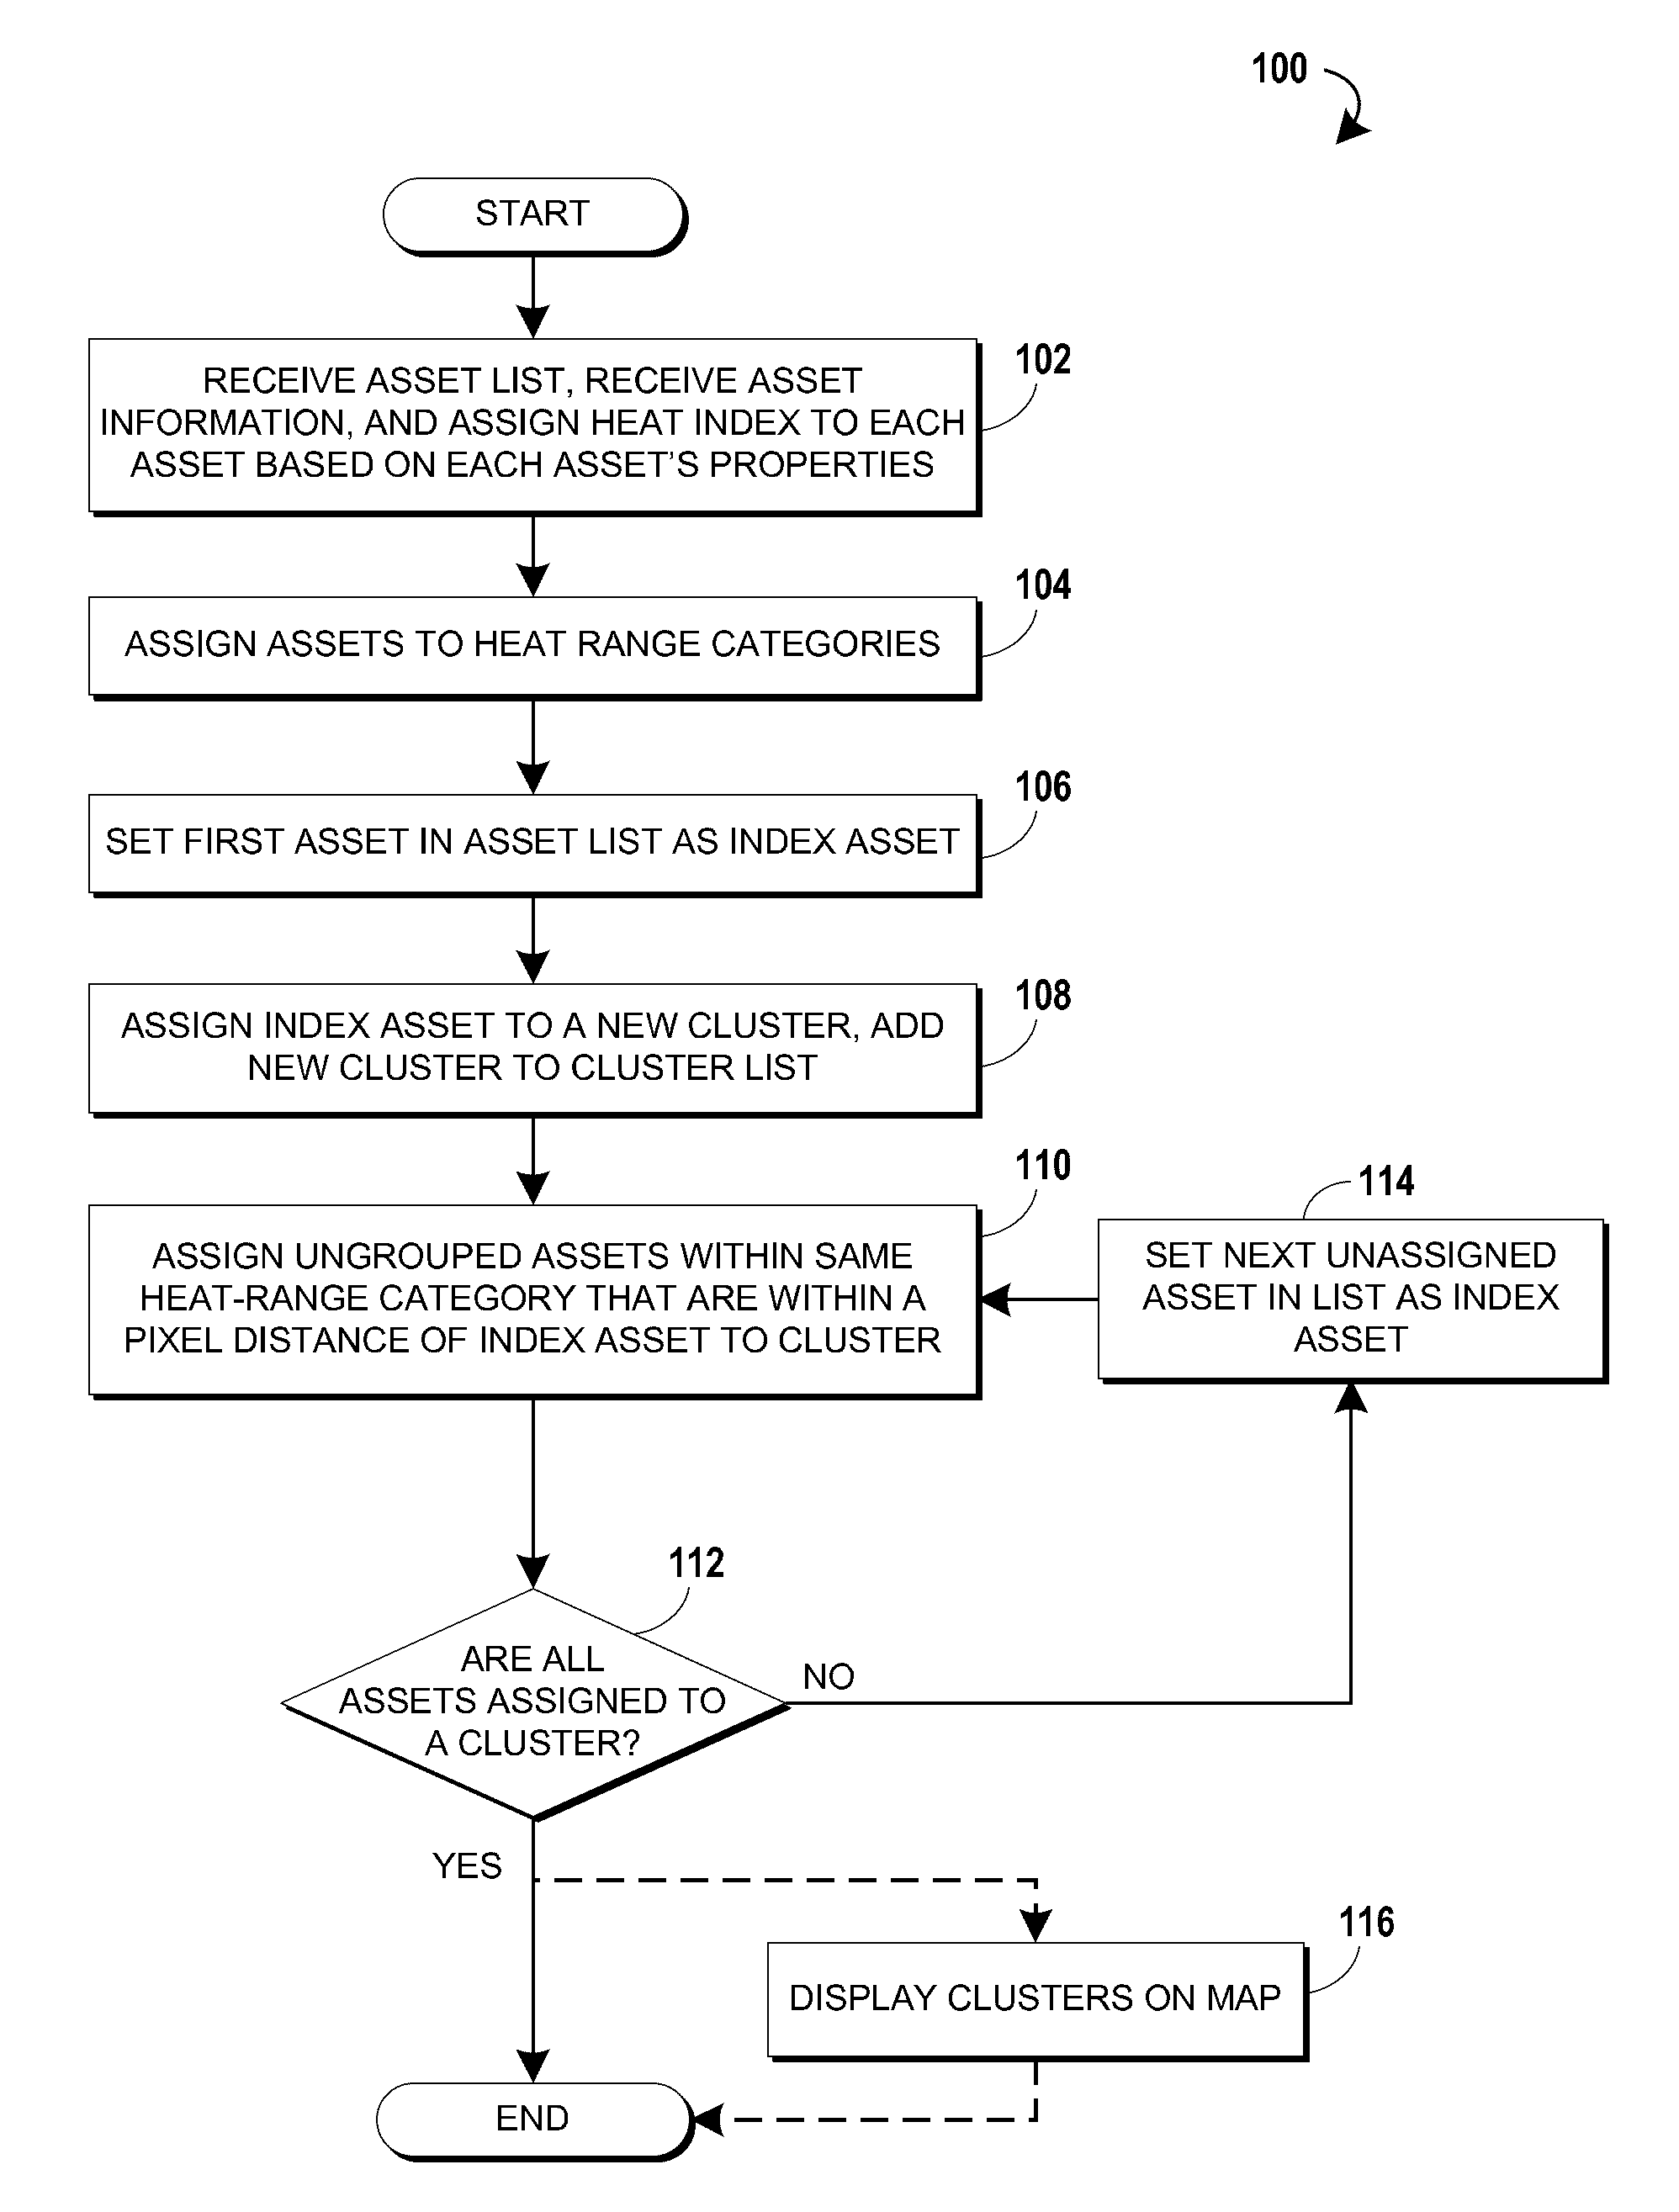
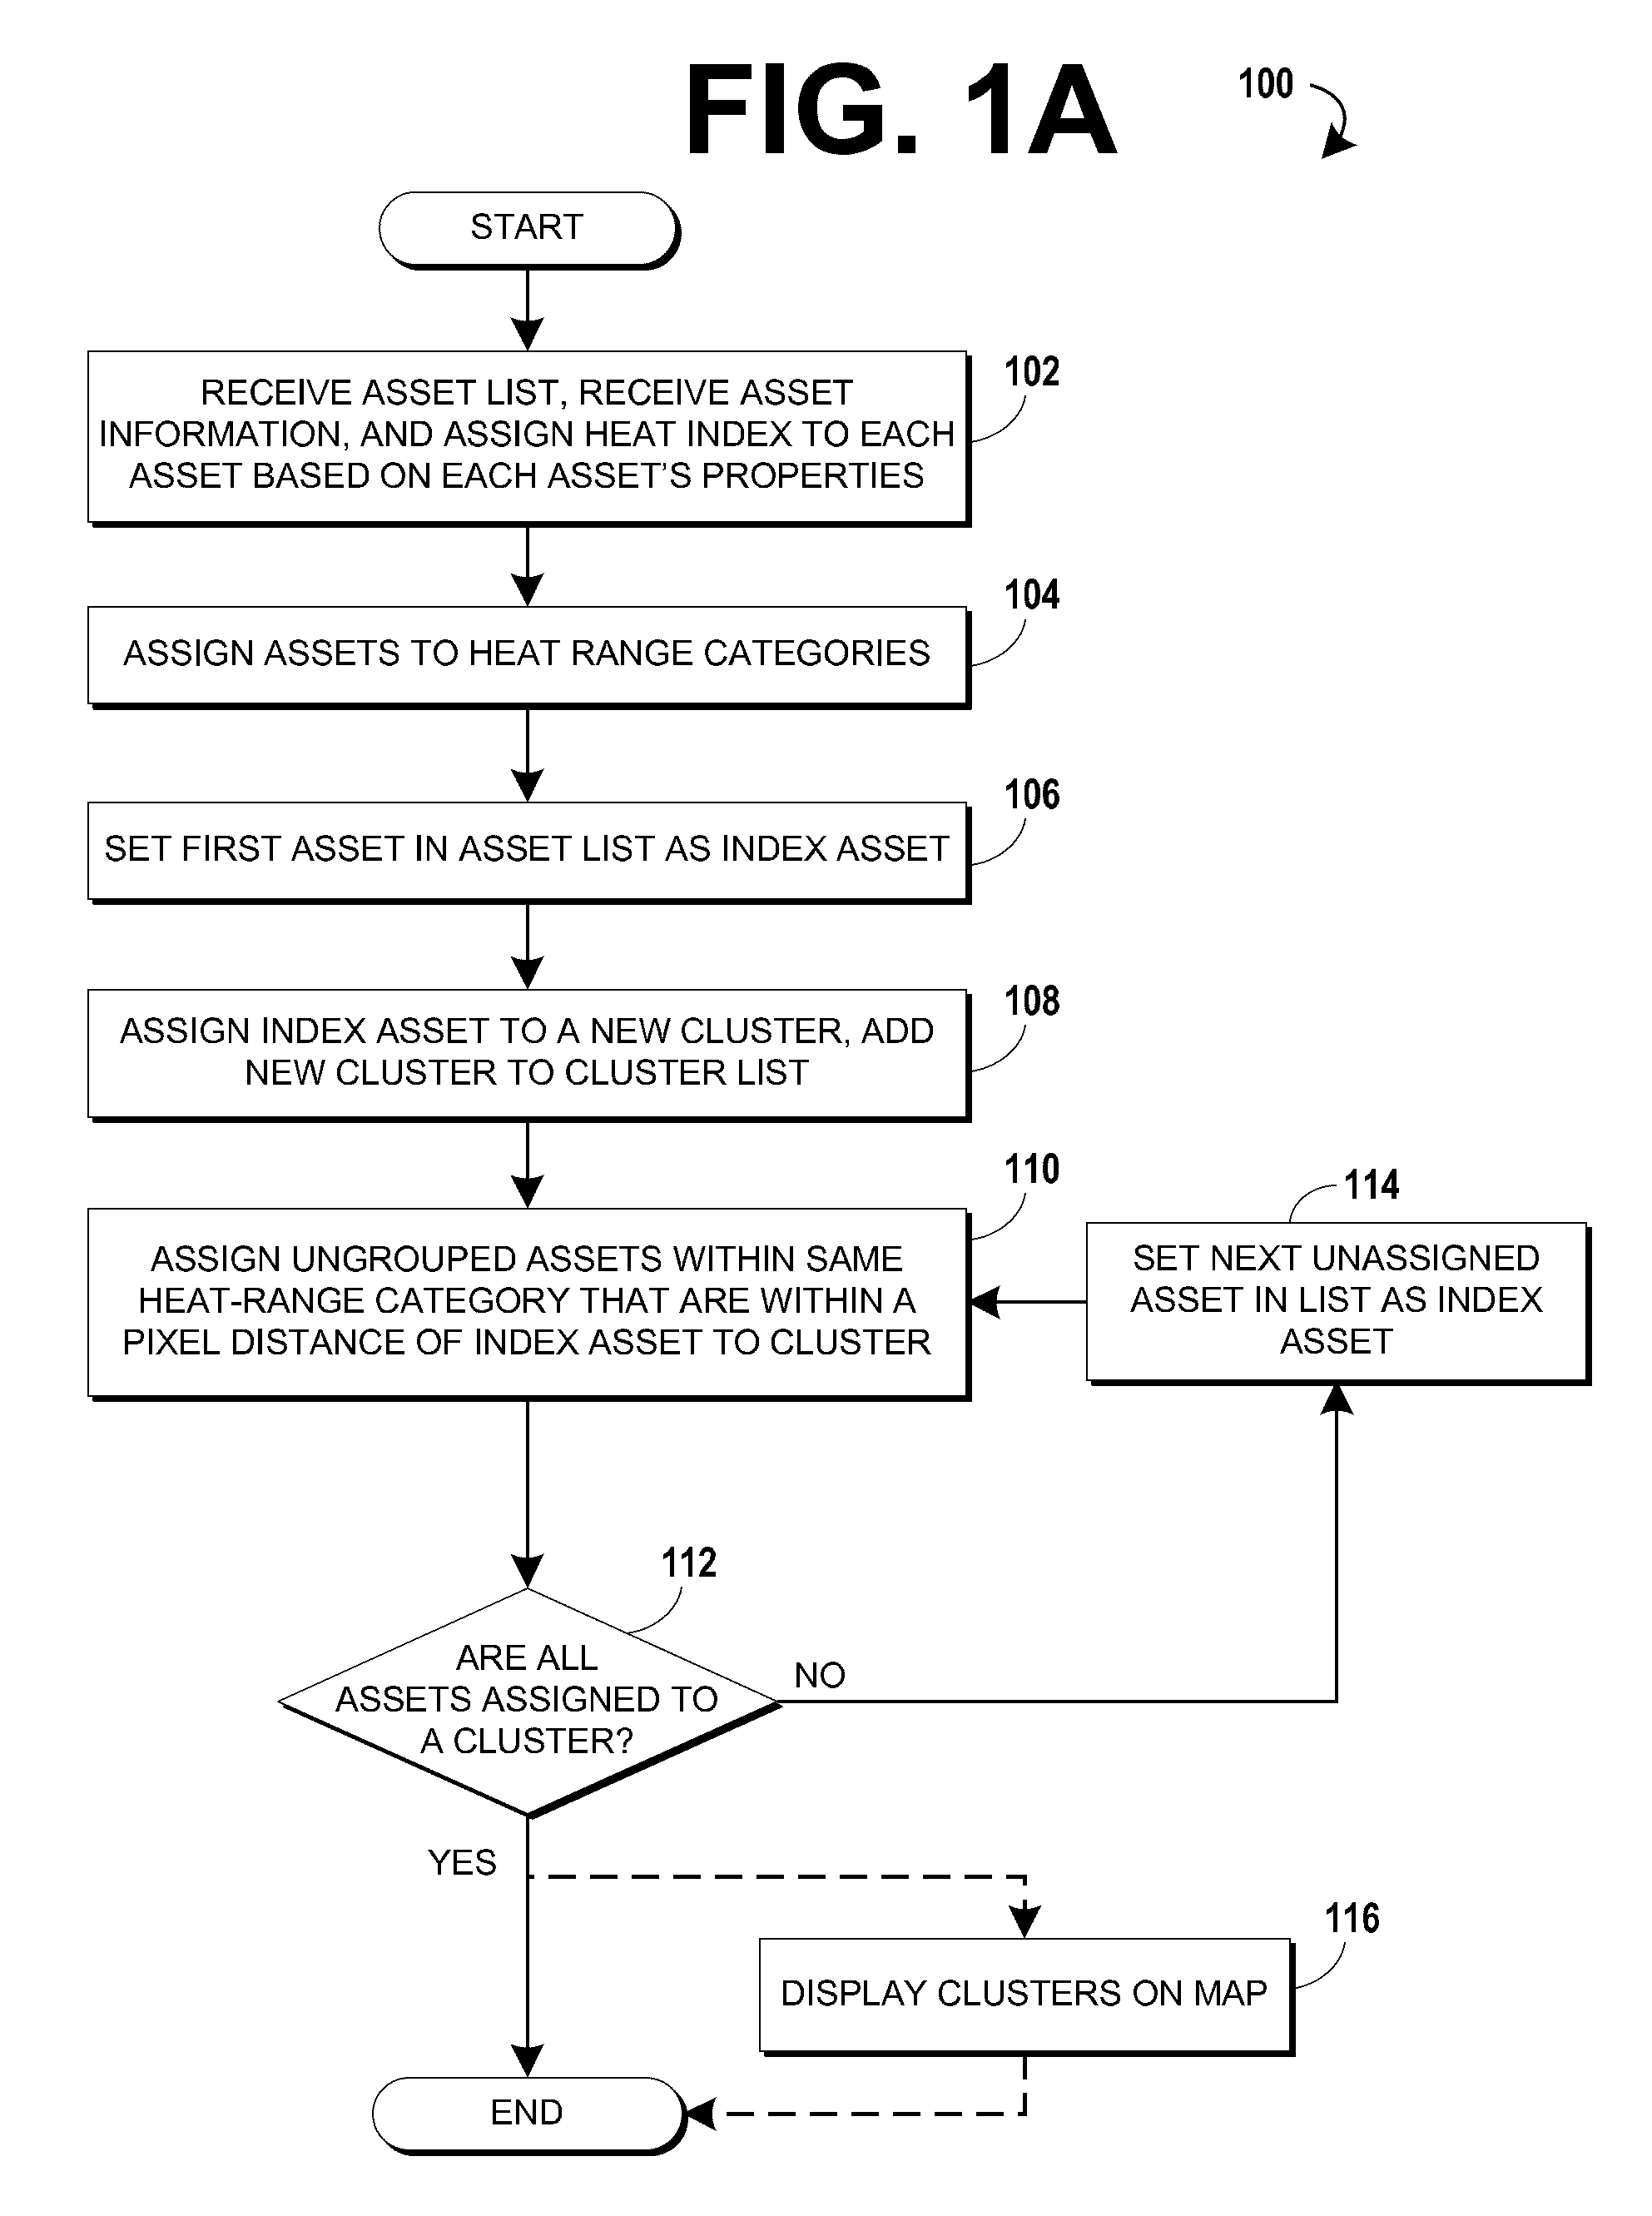
[0031]Referring now to the figures in detail, FIG. 1 A is a flowchart showing a heat index generation process 100 according to an embodiment of the invention. Starting at step 102, a list of assets and asset information are received, and a heat index is as...


PUM


Abstract

Methods of generating heat maps of assets using clustering of assets are disclosed. Some methods include receiving a list of assets, assigning the assets to one or more heat range categories based on the status of the assets, assigning assets operating within a zone to a zone cluster, assigning the assets of the zone cluster to category clusters based on the heat range categories assigned to the assets. The positions of the clusters may be calculated for mapping, and may be displayed on a map. Some embodiments of these methods allow a user to quickly detect and locate non-standard assets on a map while standard assets are consolidated to clusters that are less prominent to the user. This leads to minimizing the time required to form responses to de-load hotspots in an electrical grid, minimizing the cost of assets by reducing the need for hardware redundancy, and minimized equipment outages.

Description

CROSS REFERENCE TO RELATED APPLICATIONS[0001]Priority is claimed to the following related pending U.S. Provisional Patent Application, which is hereby incorporated by reference in its entirety: Ser. No. 61 / 508,530, filed Jul. 15, 2011.BACKGROUND[0002]The present invention relates to the field of information visualization methods, and more particularly to the field of clustering information on a map.[0003]A heat map is a graphical representation of data with values represented as colors or other visual symbols in a two-dimensional shape. Heat mapping gives the reader a representation of data that may be scanned visually to find “hot” and “cold” portions quickly and easily. Some heat maps are superimposed over geographical projections, such as temperature maps showing high and low temperatures across a region or political maps showing the frequency of voting for one party or another from state to state.[0004]Imprecision is an inherent problem with geographical heat maps. While a heat ...

Claims


Application Information

Patent Timeline
IPC IPC(8): G06T11/20
CPCG06T11/206G06F2203/04806G09B29/106G09B29/006
Inventor YIP, DENNISSHAO, VICTOR
Owner ENGIE STORAGE SERVICES NA LLC
Why Eureka
Try Eureka