Methods for diagnosis, prognosis and treatment

a prognosis and treatment technology, applied in the field of diagnosis, prognosis and treatment, can solve the problems of low cost of cytometers and mass spectrometers, and insufficient node state data for single cell activation, etc., to reduce inefficient use of resources, improve patient outcomes, and monitor the effect of treatment over tim

Inactive Publication Date: 2013-04-18
NODALITY
View PDF2 Cites 15 Cited by
  • Summary
  • Abstract
  • Description
  • Claims
  • Application Information

AI Technical Summary

Benefits of technology

[0017]Embodiments of the present invention further include kits for treating cells according to standardized methods with standardized modulators or antibodies. The subject invention also provides kits for use in determining the physiological status of cells in a sample, the kit comprising one or more modulators, inhibitors, specific binding elements for signaling molecules, and may additionally comprise one or more therapeutic agents. Embodiments further include calibration kits for performing standardized flow cytometry analysis on the treated cells. The standardized methods and reagents for evoking cell signaling and performing the flow cytometry analysis and data analysis will allow comparisons between samples / patients and across time.
[0018]In some embodiments, the present invention is a method for drug screening, diagnosis, prognosis and prediction of disease treatment. Reports generated by the present invention may be used to measure signaling pathway activity in single cells, identify signaling pathway disruptions in diseased cells, including rare cell populations, identify response and resistant biological profiles that guide the selection of therapeutic regimens, monitor the effects of therapeutic treatments on signaling in diseased cells, and monitor the effects of treatment over time. These reports can enable biology-driven patient management and drug development, improving patient outcome, reducing inefficient uses of resources, and improving the speed of drug development cycles.
[0019]A specific embodiment includes the use of a technology that is able to analyze events at a single cell level, such as the performance of multi-parametric flow cytometry, mass spectrometry, or laser spectrometry as examples, to analyze cell signaling pathways using standardized methods, equipment, and reagents. One embodiment of the invention uses evoked responses to probe signaling. By standardizing protocols, reagents, and analysis tools, the present invention can be used for patient monitoring. For example, clinicians may monitor patients over time as a tumor evolves by receiving reports for the patient comprises formed on responsive and resistant biological profiles as well as ensuring adequate accuracy and completeness to enable biology-driven patient management.
[0022]One embodiment of the present invention is a method for generating reports including association metrics that serve diagnoses, prognoses and values used to guide decision making such as values used to guide patient treatment. Samples comprising fresh or frozen cells may be used depending on the time between acquisition and analysis. The method of generating the associated metric can comprise correlating the node state data derived from a sample with a statistical model for a clinical outcome or surrogate marker thereof, such as the prognosis and / or diagnosis of a condition, or can correlate with the response to a therapy, such as complete response, partial response, remission, no response, progressive disease, stable disease, hematologic improvement, cytogenetic response and adverse reaction. The method can also involve generating association metrics based on statistical models of samples associated with “stages” wherein the “stages” associated with the samples are selected from the group consisting of: WHO classification, FAB classification, IPSS score, WPSS score, aggressive, indolent, benign, refractory, limited stage, extensive stage, including information that may inform on time to progression, progression free survival, overall survival, and event-free survival. Treatments or therapies may include chemotherapy, biological therapy, radiation therapy, small molecules, antibodies, bone marrow transplantation, peripheral stem cell transplantation, umbilical cord blood transplantation, autologous stem cell transplantation, allogeneic stem cell transplantation, syngeneic stem cell transplantation, surgery, induction therapy, maintenance therapy, watchful waiting, and other therapy. The association metric for a sample may also be based on statistical models generated based on samples with minimal residual disease or emerging resistance.

Problems solved by technology

Additionally, cytometers and mass spectrometers are expensive to purchase and maintain.
Consequently, node state data characterizing activatable elements and pathways in single cells is not widely produced by researchers and clinicians.
This lack of node state data serves as a barrier to the utility of this data in research.
Therefore, the lack of node state data serves as a barrier to the generation of accurate statistical models used to perform diagnosis or prognosis.
A related barrier to the utility of node state data in research is the lack of standardization in the production and analysis of node state data.
These variations may cause node state data generated in different experiments to be incomparable.
Because of these variations, node state data produced in different laboratories often cannot be combined and used to generate statistical models.
Differences in data analysis protocols and instrument calibration also lead to incomparable or inconsistent node state data.
This iteration leads to large labor costs incurred by parties attempting to generate consistent node state data.

Method used


Image

  • Methods for diagnosis, prognosis and treatment
  • Methods for diagnosis, prognosis and treatment
  • Methods for diagnosis, prognosis and treatment

Examples


specific embodiments

[0343]Payers use the terminology “payback” or “return on investment (ROI)” as criteria for assessing the economic impact of adopting a new technology. ROI means not only the point at which breakeven occurs, if at all, but also the short-, intermediate- and long-term financial consequences on operational budgets and overall disease treatment costs and revenues. Medical specialists desire both improvement in clinical outcomes but also minimal difficulties in securing reimbursement from private and public third-parties. Patients want to live longer, but also face substantial copayments and coinsurance rates (20% on Medicare “Part B” for outpatient drugs that are, by definition, unsafe for patient self-administration) and wish to know the value for money in addition to clinical risks and benefits. In some embodiments, the methods of the invention can be used at the individual patient level to provide more detailed and valid information than can be derived from gross categorizations of p...

example 1

Diagnosis, Prognosis and Therapeutic Response Typing in AML

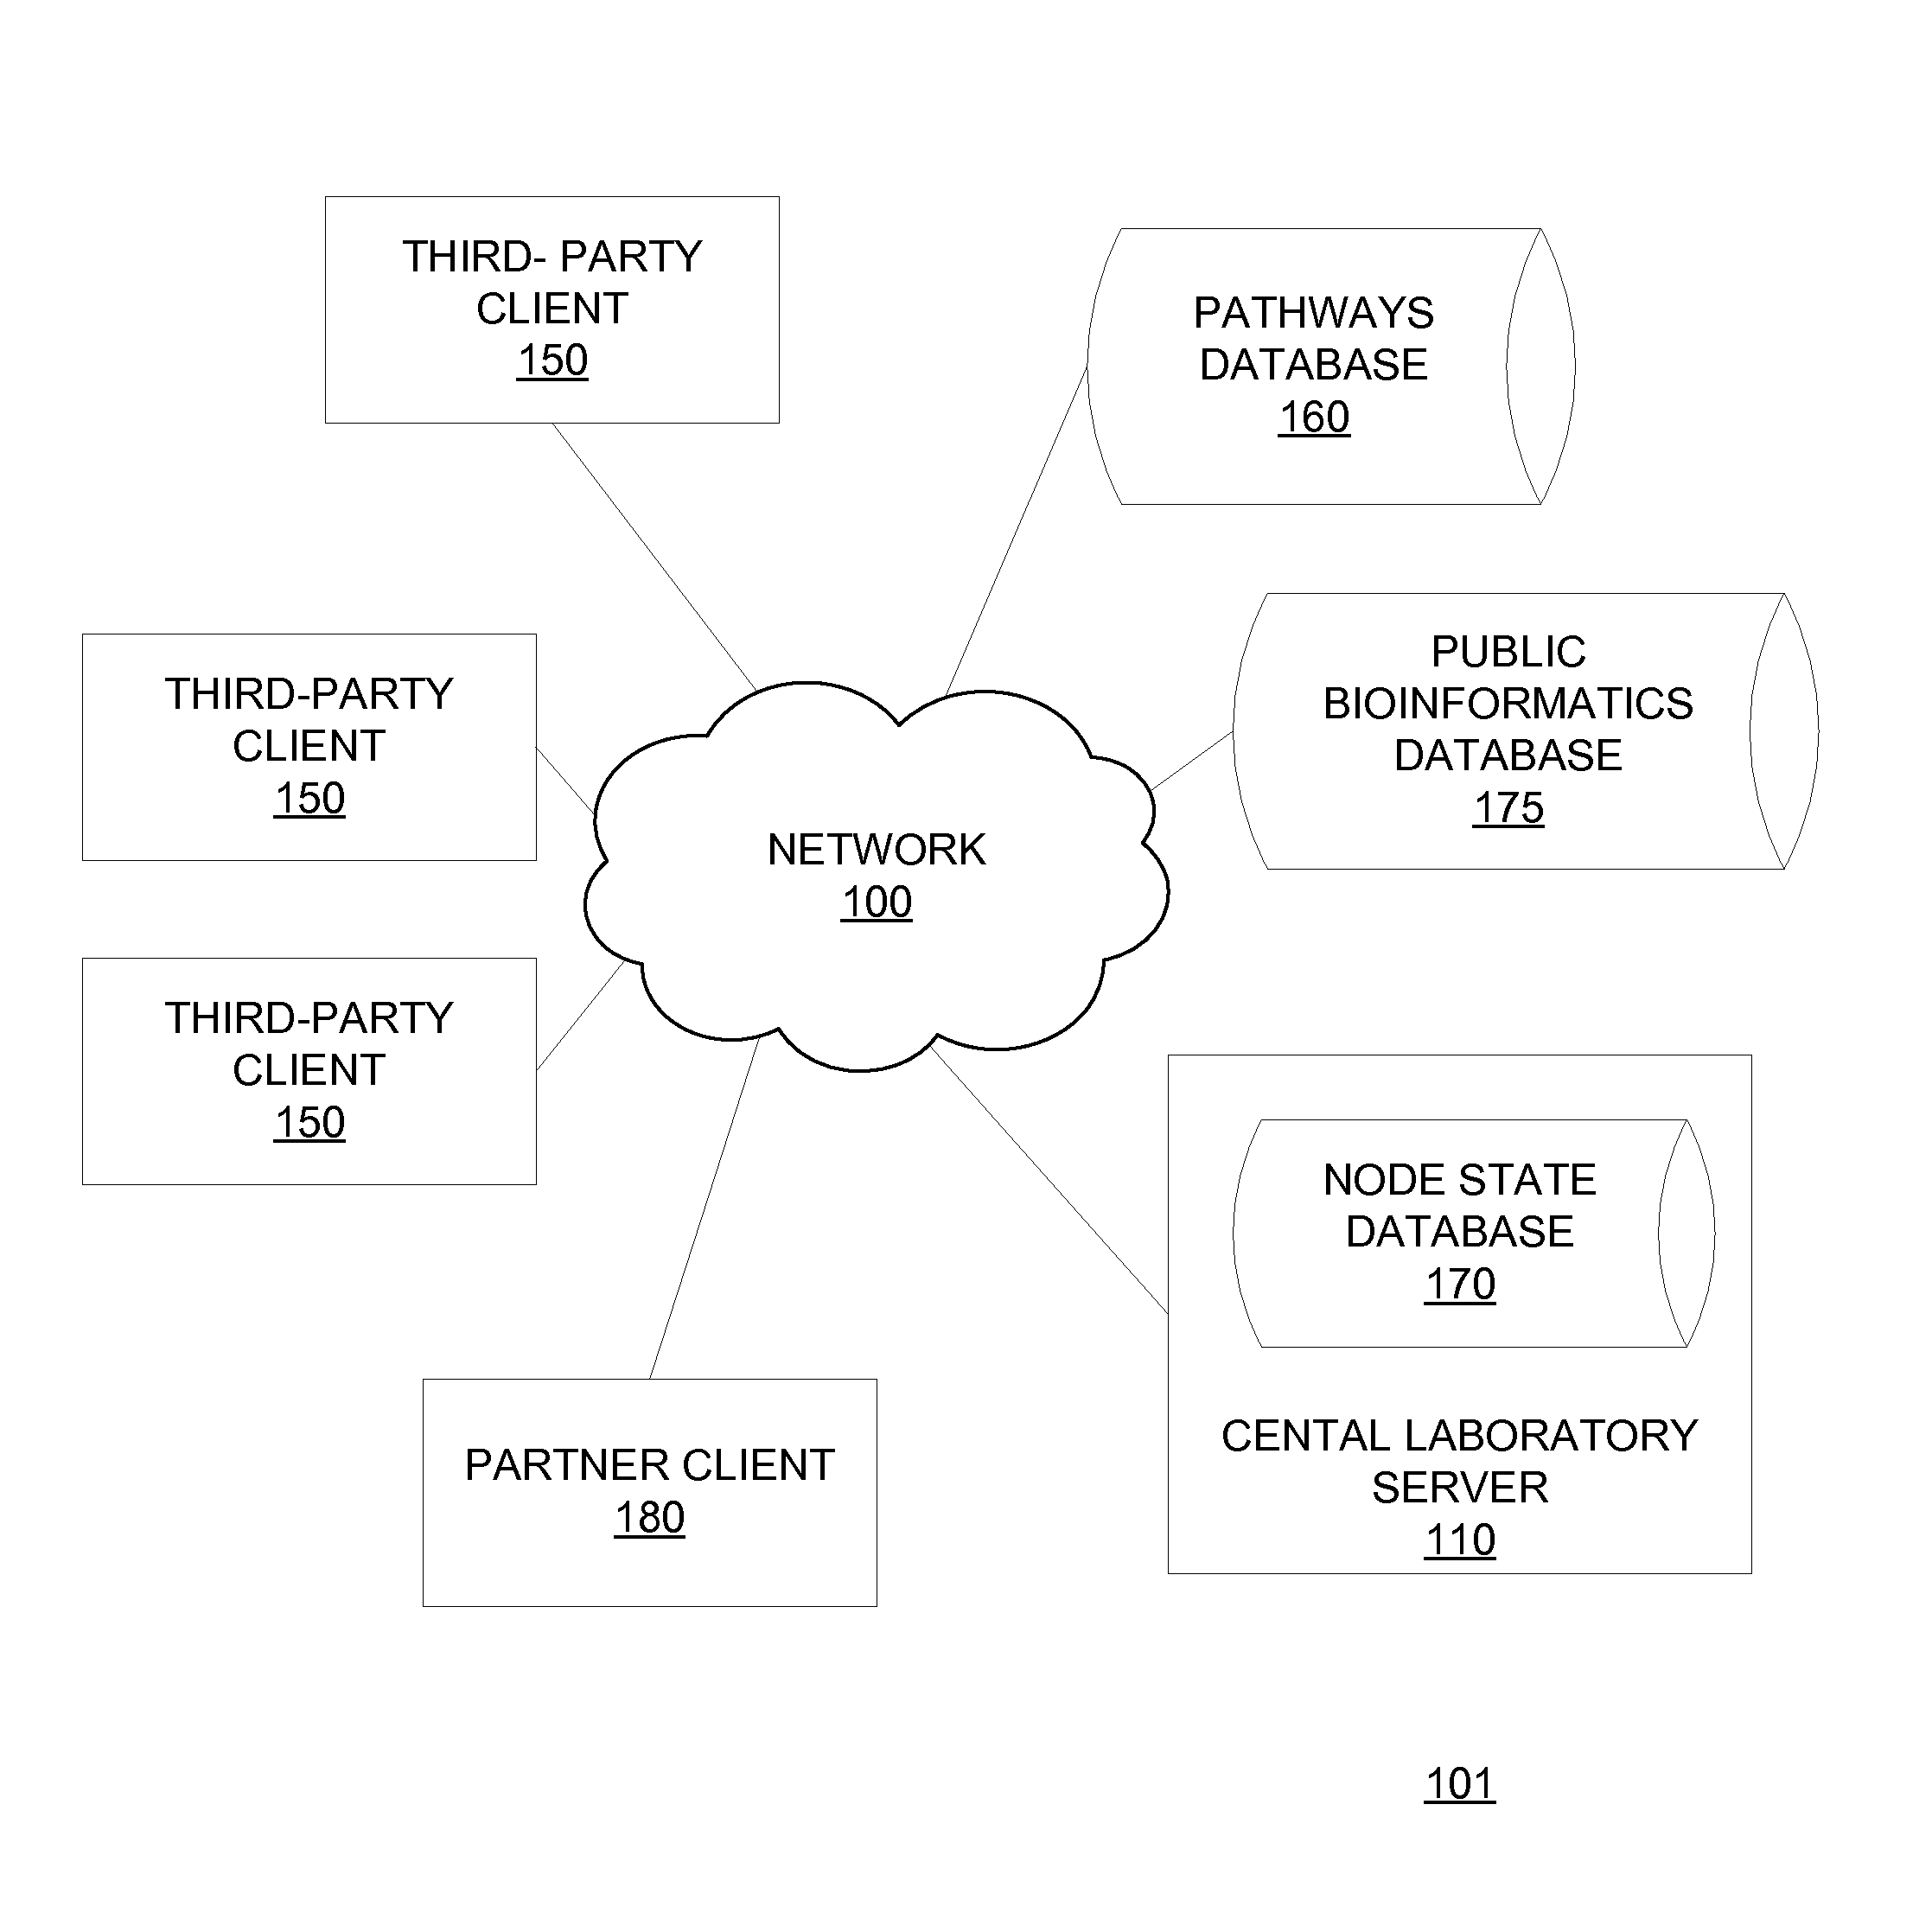
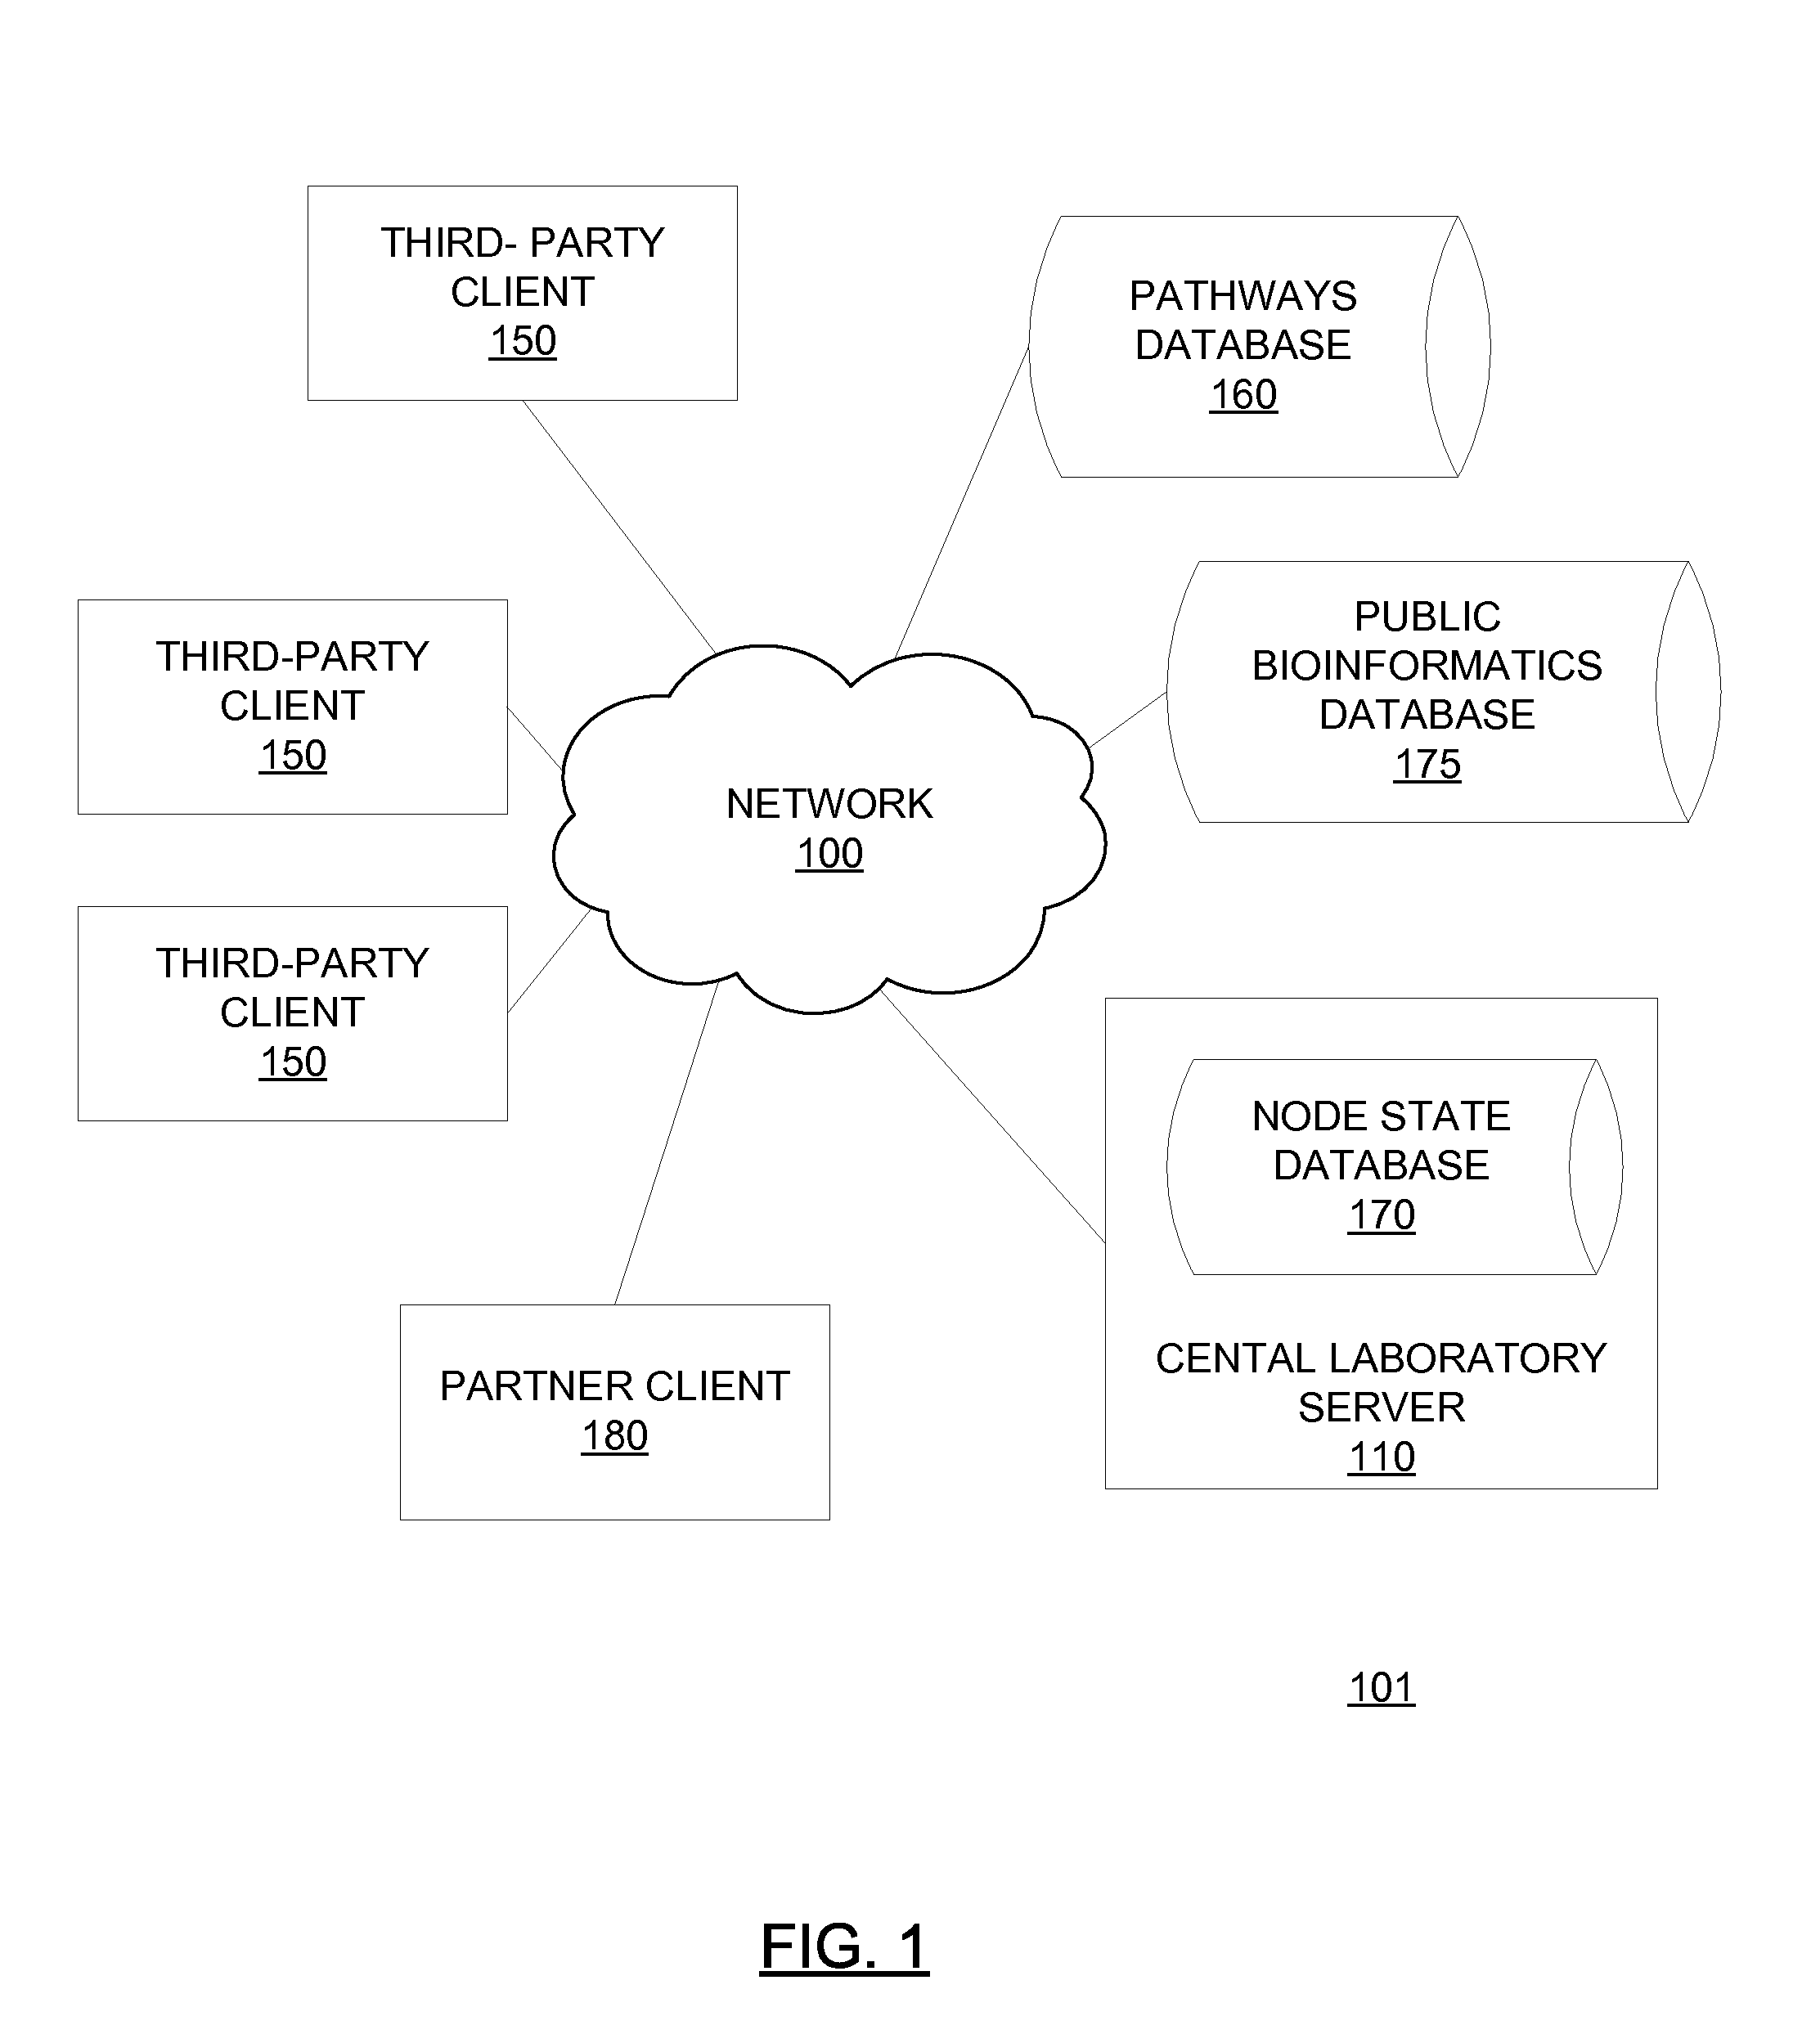
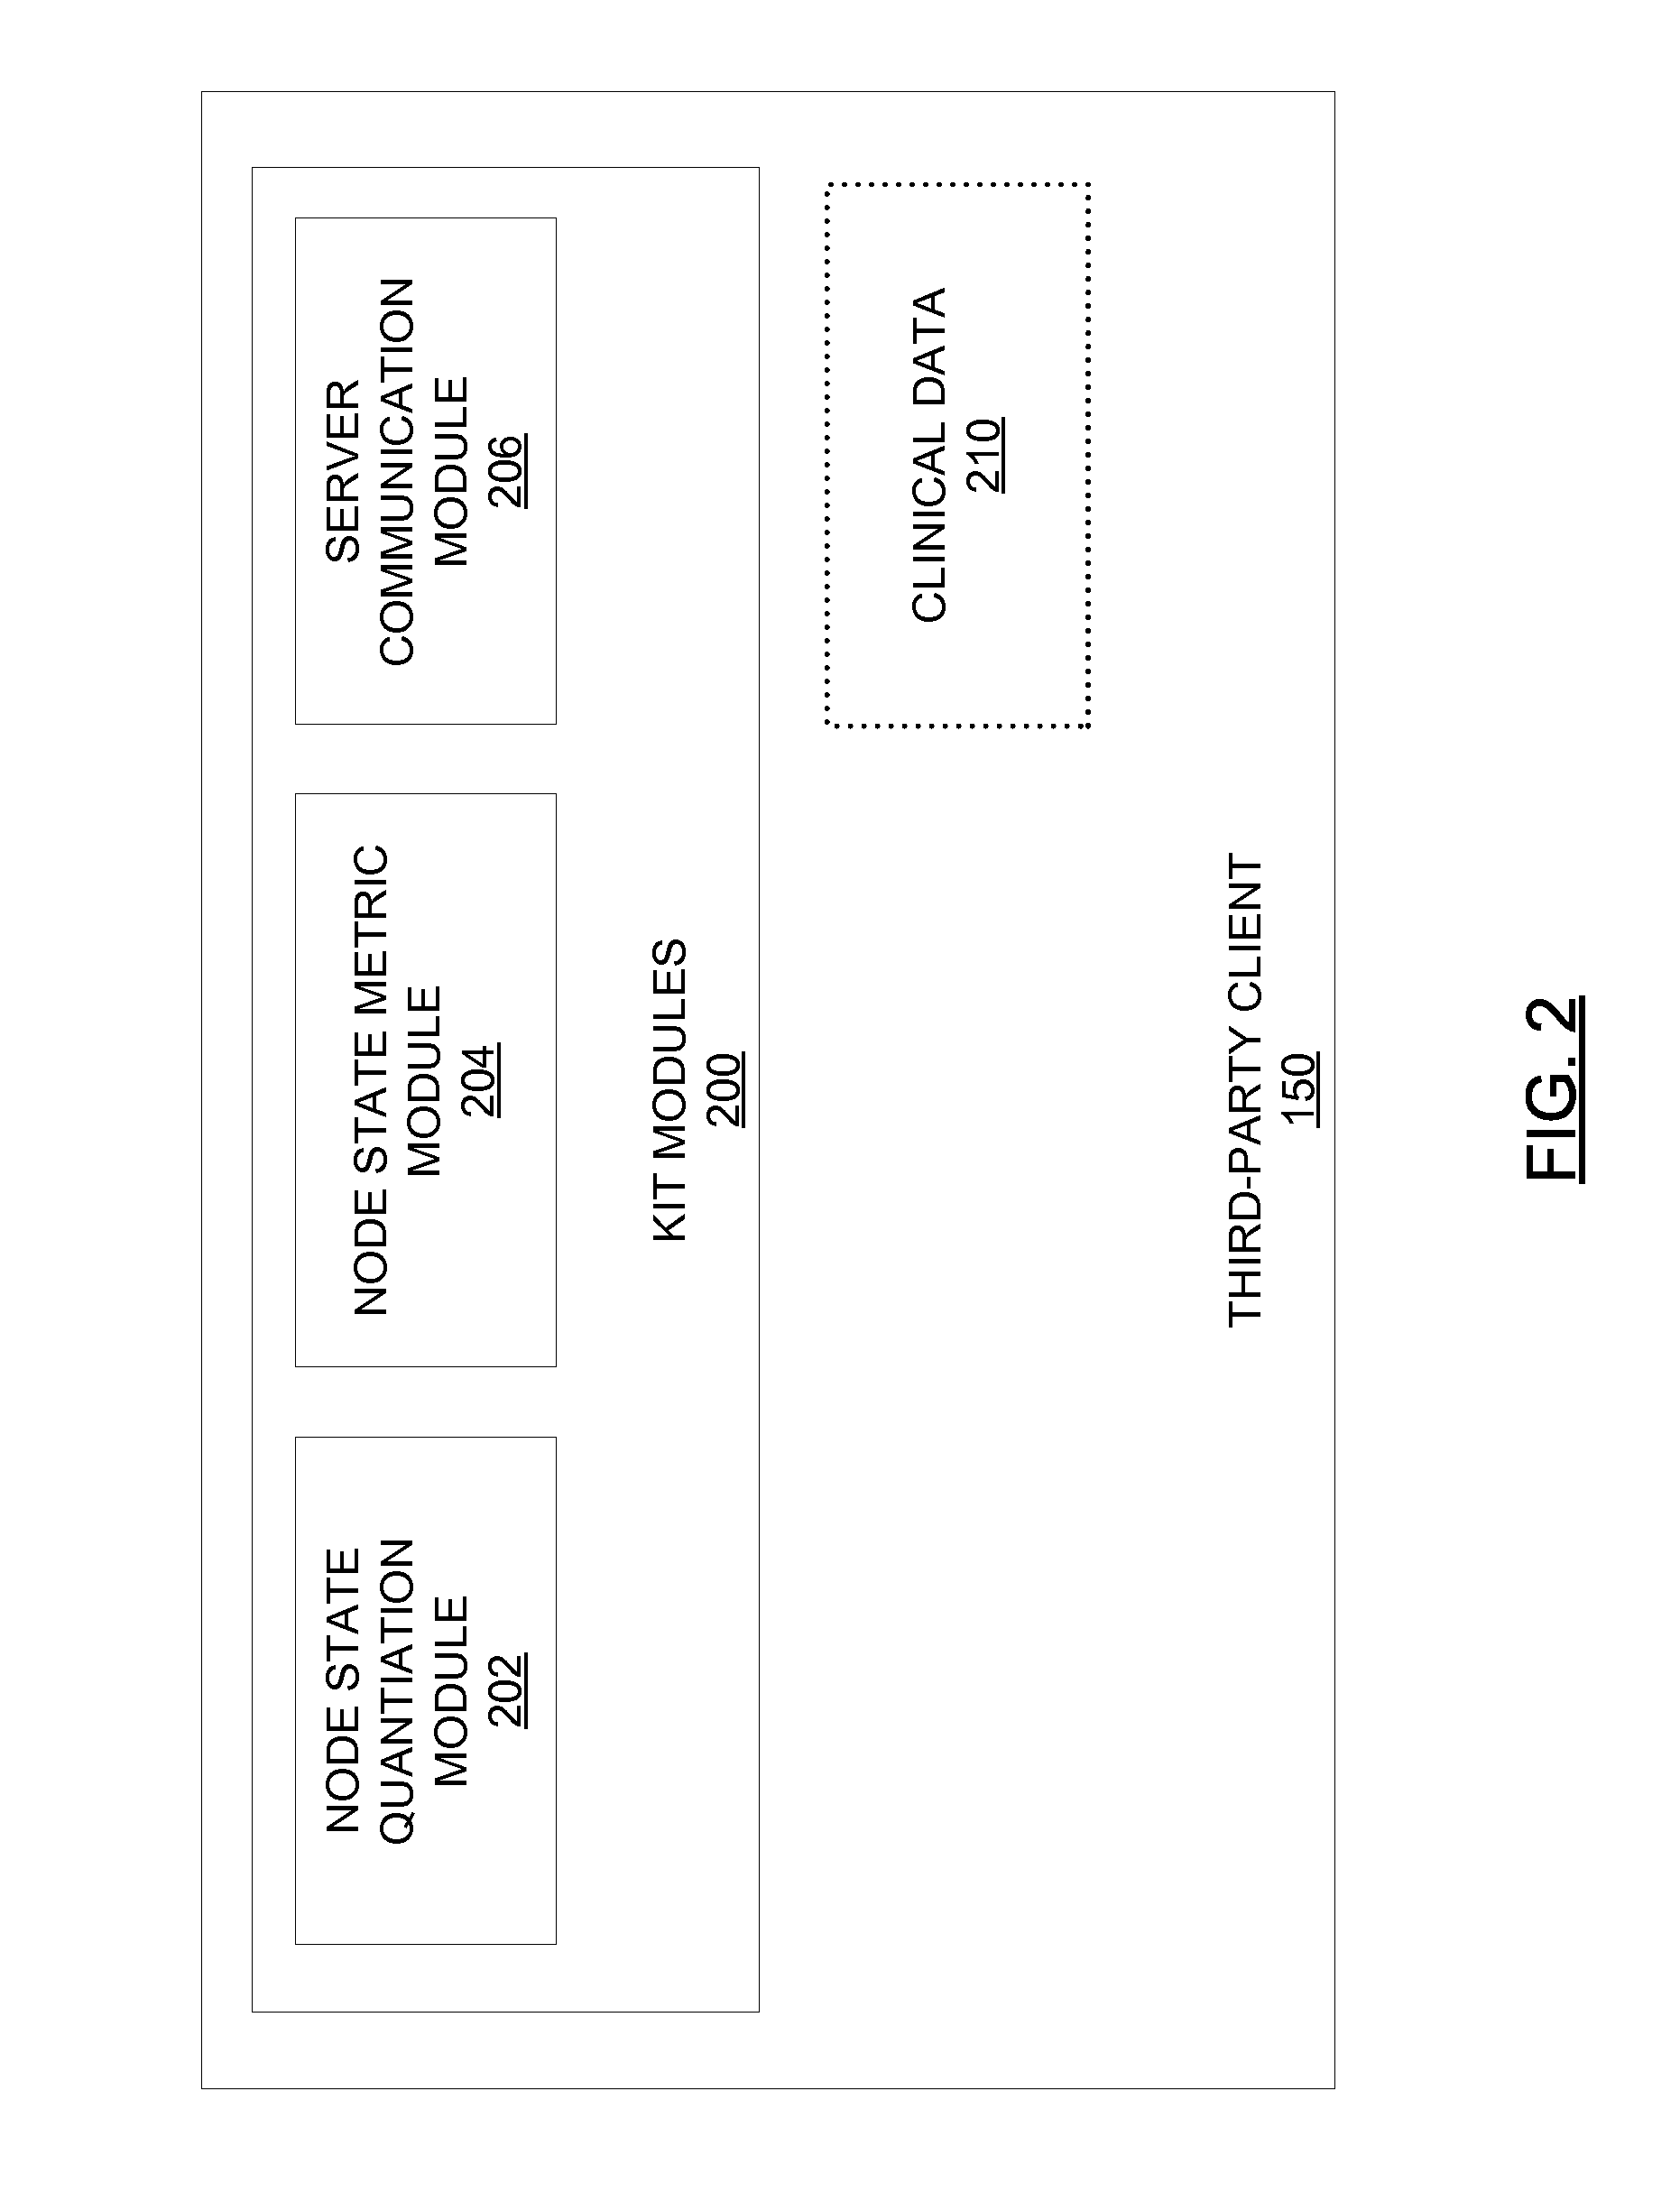
[0358]A third party physician or medical center purchases, from the central laboratory, kits containing reagents standardized by the central laboratory to minimize sample damage and produce reproducible results. The third party physician or medical center collects a blood sample from a patient suspected of having AML and treats the blood sample with a reagent. The third party transmits the physical sample to the central laboratory. The third party further transmits requisition data specifying that the third party is to be tested for AML, sub-typed for AML if positive for AML and typed according to therapeutic response. The third party further transmits anonymized clinical data associated with the patient to the central laboratory server 110 via the client 150 operated by the third party using kit software 200.

[0359]The central laboratory processes the physical sample by stimulating the sample with one or more modulators, fix...

example 2

Candidate Drug Testing for Pharmaceutical Companies

[0364]A third party pharmaceutical company purchases, from the central laboratory, kits containing reagents standardized by the central laboratory to minimize sample damage and produce reproducible results. The pharmaceutical company collects blood samples from individuals. The individuals may or may not be patients in a particular disease state that a test compound (e.g. candidate kinase inhibitor) is used to treat. The pharmaceutical company transmits the physical samples to the central laboratory with the test compound. The pharmaceutical company further transmits requisition data specifying that the physical samples are to be treated with the test compound and other modulators over a series of specified concentrations and a pre-defined set of antibodies are to be used to quantify activation levels of specified activatable elements (e.g. activatable elements in the JAK / STAT, PI3 kinase, mTor, Ras / Rap and / or Ehf receptor pathways)...


PUM

PropertyMeasurementUnit
pore sizesaaaaaaaaaa
temperatureaaaaaaaaaa
concentrationaaaaaaaaaa

Abstract

An embodiment of the present invention is a method of generating a report based on an association metric. The method involves identifying node state data associated with a sample, and generating an association metric based on the node state data.

Description

CROSS REFERENCE[0001]This application claims priority as a continuation of U.S. Ser. No. 12 / 688,851 filed Jan. 15, 2010 which claims the benefit of U.S. Provisional Application Nos. 61 / 144,955, filed on Jan. 15, 2009 and 61 / 146,276, filed on Jan. 21, 2009, all of which applications are incorporated herein by reference.BACKGROUND OF THE INVENTION[0002]Methods such as multi-parameter flow cytometry use flow-based proteomic characterization of single cells to capture rare cell populations and evoke signaling measures in response to extracellular challenges. Antibodies against state-specific epitopes are used to measure activatable elements characterizing phospho-protein signaling networks, cell cycle progression, apoptotic pathways, protein expression (e.g. transporters, growth factor receptors), other post-translational modifications (e.g. acetylation, methylation, ubiquitination, sumoylation), or conformational changes. Different antibodies may be used in combination with modulators ...

Claims


Application Information

Patent Timeline
Patent Type & Authority Applications(United States)
IPC IPC(8): G06F19/00G16B50/30
CPCC12Q1/6883G06F19/3487G06F19/28C12Q2600/158G16H15/00G16B50/00G16B50/30
Inventor PARKINSON, DAVIDFANTL, WENDY J.CESANO, ALESSANDRASPELLMEYER, DAVID
Owner NODALITY
Why Eureka
Try Eureka