Method and Apparatus for Quantitative Analysis of a Tree of Recursively Splitting Tubular Organs

a tree and recursive splitting technology, applied in the field of quantitative analysis of a tree of recursively splitting tubular organs, can solve the problems of not solving the above limitations, stenosis related parameters cannot be computed for a single artery, and the piece of prior art cannot solve the above limitations

Active Publication Date: 2013-06-20
PIE MEDICAL IMAGING
View PDF4 Cites 15 Cited by
  • Summary
  • Abstract
  • Description
  • Claims
  • Application Information

AI Technical Summary

Benefits of technology

[0012]It is therefore an object of the invention to extend prior art and to provide a more accurate and reproducible method and system for 3D quantitative analysis of a tree of recursively splitting tubular organs.

Problems solved by technology

This has drawbacks as not only may lead to masking of information that is present and may only be observed in 3D, but also renders the analysis dependent on the imaging modalities used for obtaining the 3D dataset.
Currently no piece of prior art has solved the above limitations.
However, stenosis related parameters can only be computed for a single artery which can be detected by analysis of 2D angiographic images, which were used to construct a 3D model.
Hence also this document fails to disclose a full 3D analysis of a tree of recursively splitting organs.
This poses a problem in case there is a lot of overlap near the bifurcation.
However, certainly in case a vascular tree will be analysed, this is undesirable with respect to the patient in terms of X-ray exposure and contrast agent usage.

Method used


Image

  • Method and Apparatus for Quantitative Analysis of a Tree of Recursively Splitting Tubular Organs
  • Method and Apparatus for Quantitative Analysis of a Tree of Recursively Splitting Tubular Organs
  • Method and Apparatus for Quantitative Analysis of a Tree of Recursively Splitting Tubular Organs

Examples


Embodiment Construction

[0088]For purposes of description herein, the following terms are defined as follows:

[0089]“proximal” is a term meaning the side of a vessel or tube or tubular organ from which a fluid comes; for example the proximal side of the aorta is the side of the aorta closest to the heart;

[0090]“distal” is a term meaning the side of a vessel or tube or tubular organ where the fluid flows to; for example the distal side of the aorta is the side of the aorta furthest from the heart;

[0091]“lumen” is a term meaning the interior of a vessel or tube or tubular organ through which a fluid flows or the external boundary of the vessel wall, or any position in-between;

[0092]“healthy” is a term meaning the estimated tubular organ dimension as if it were without obstruction or dilation.

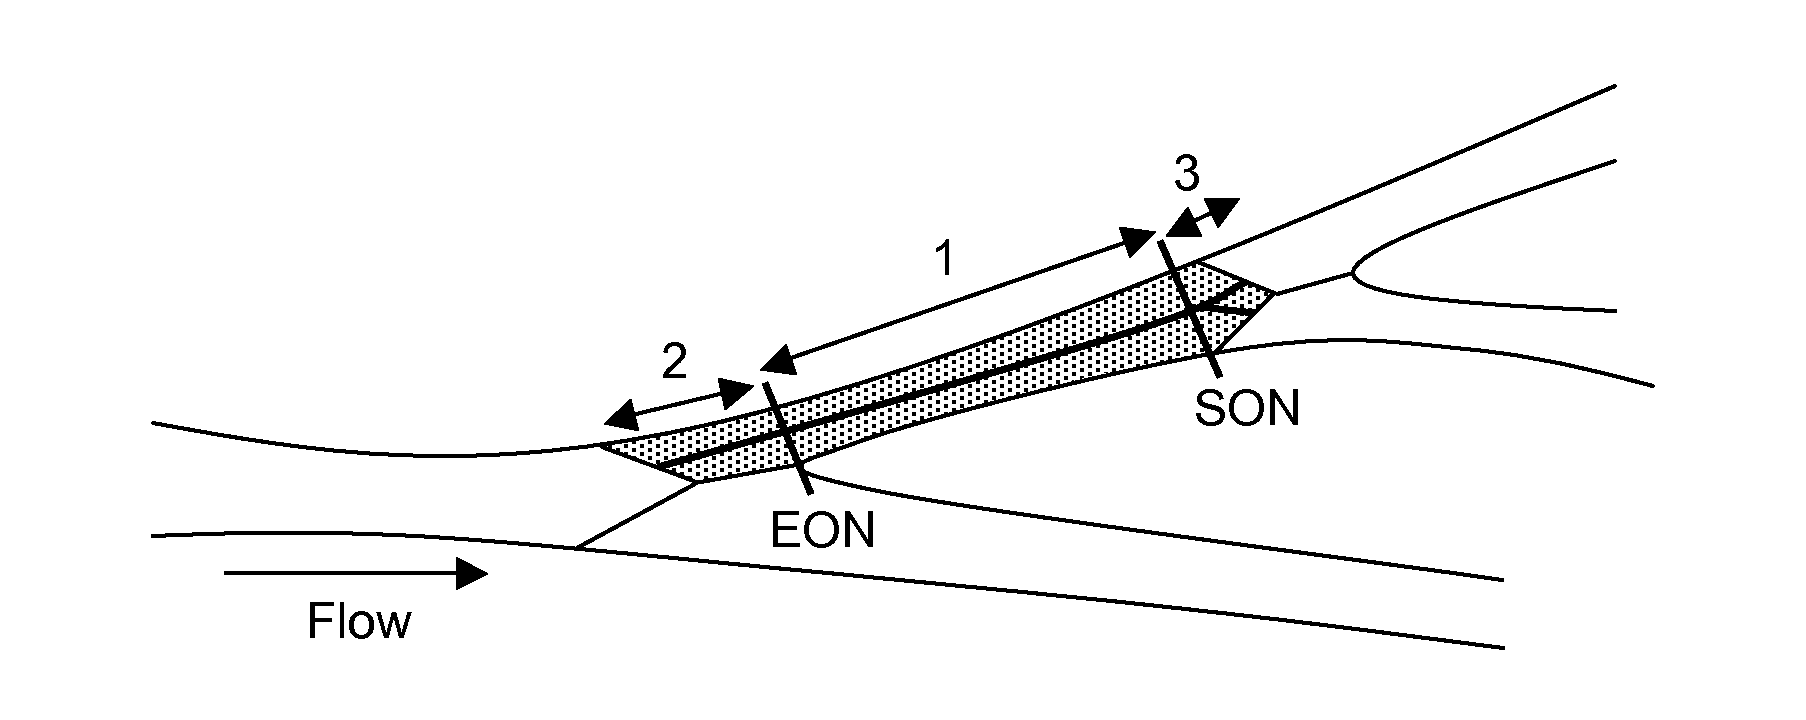
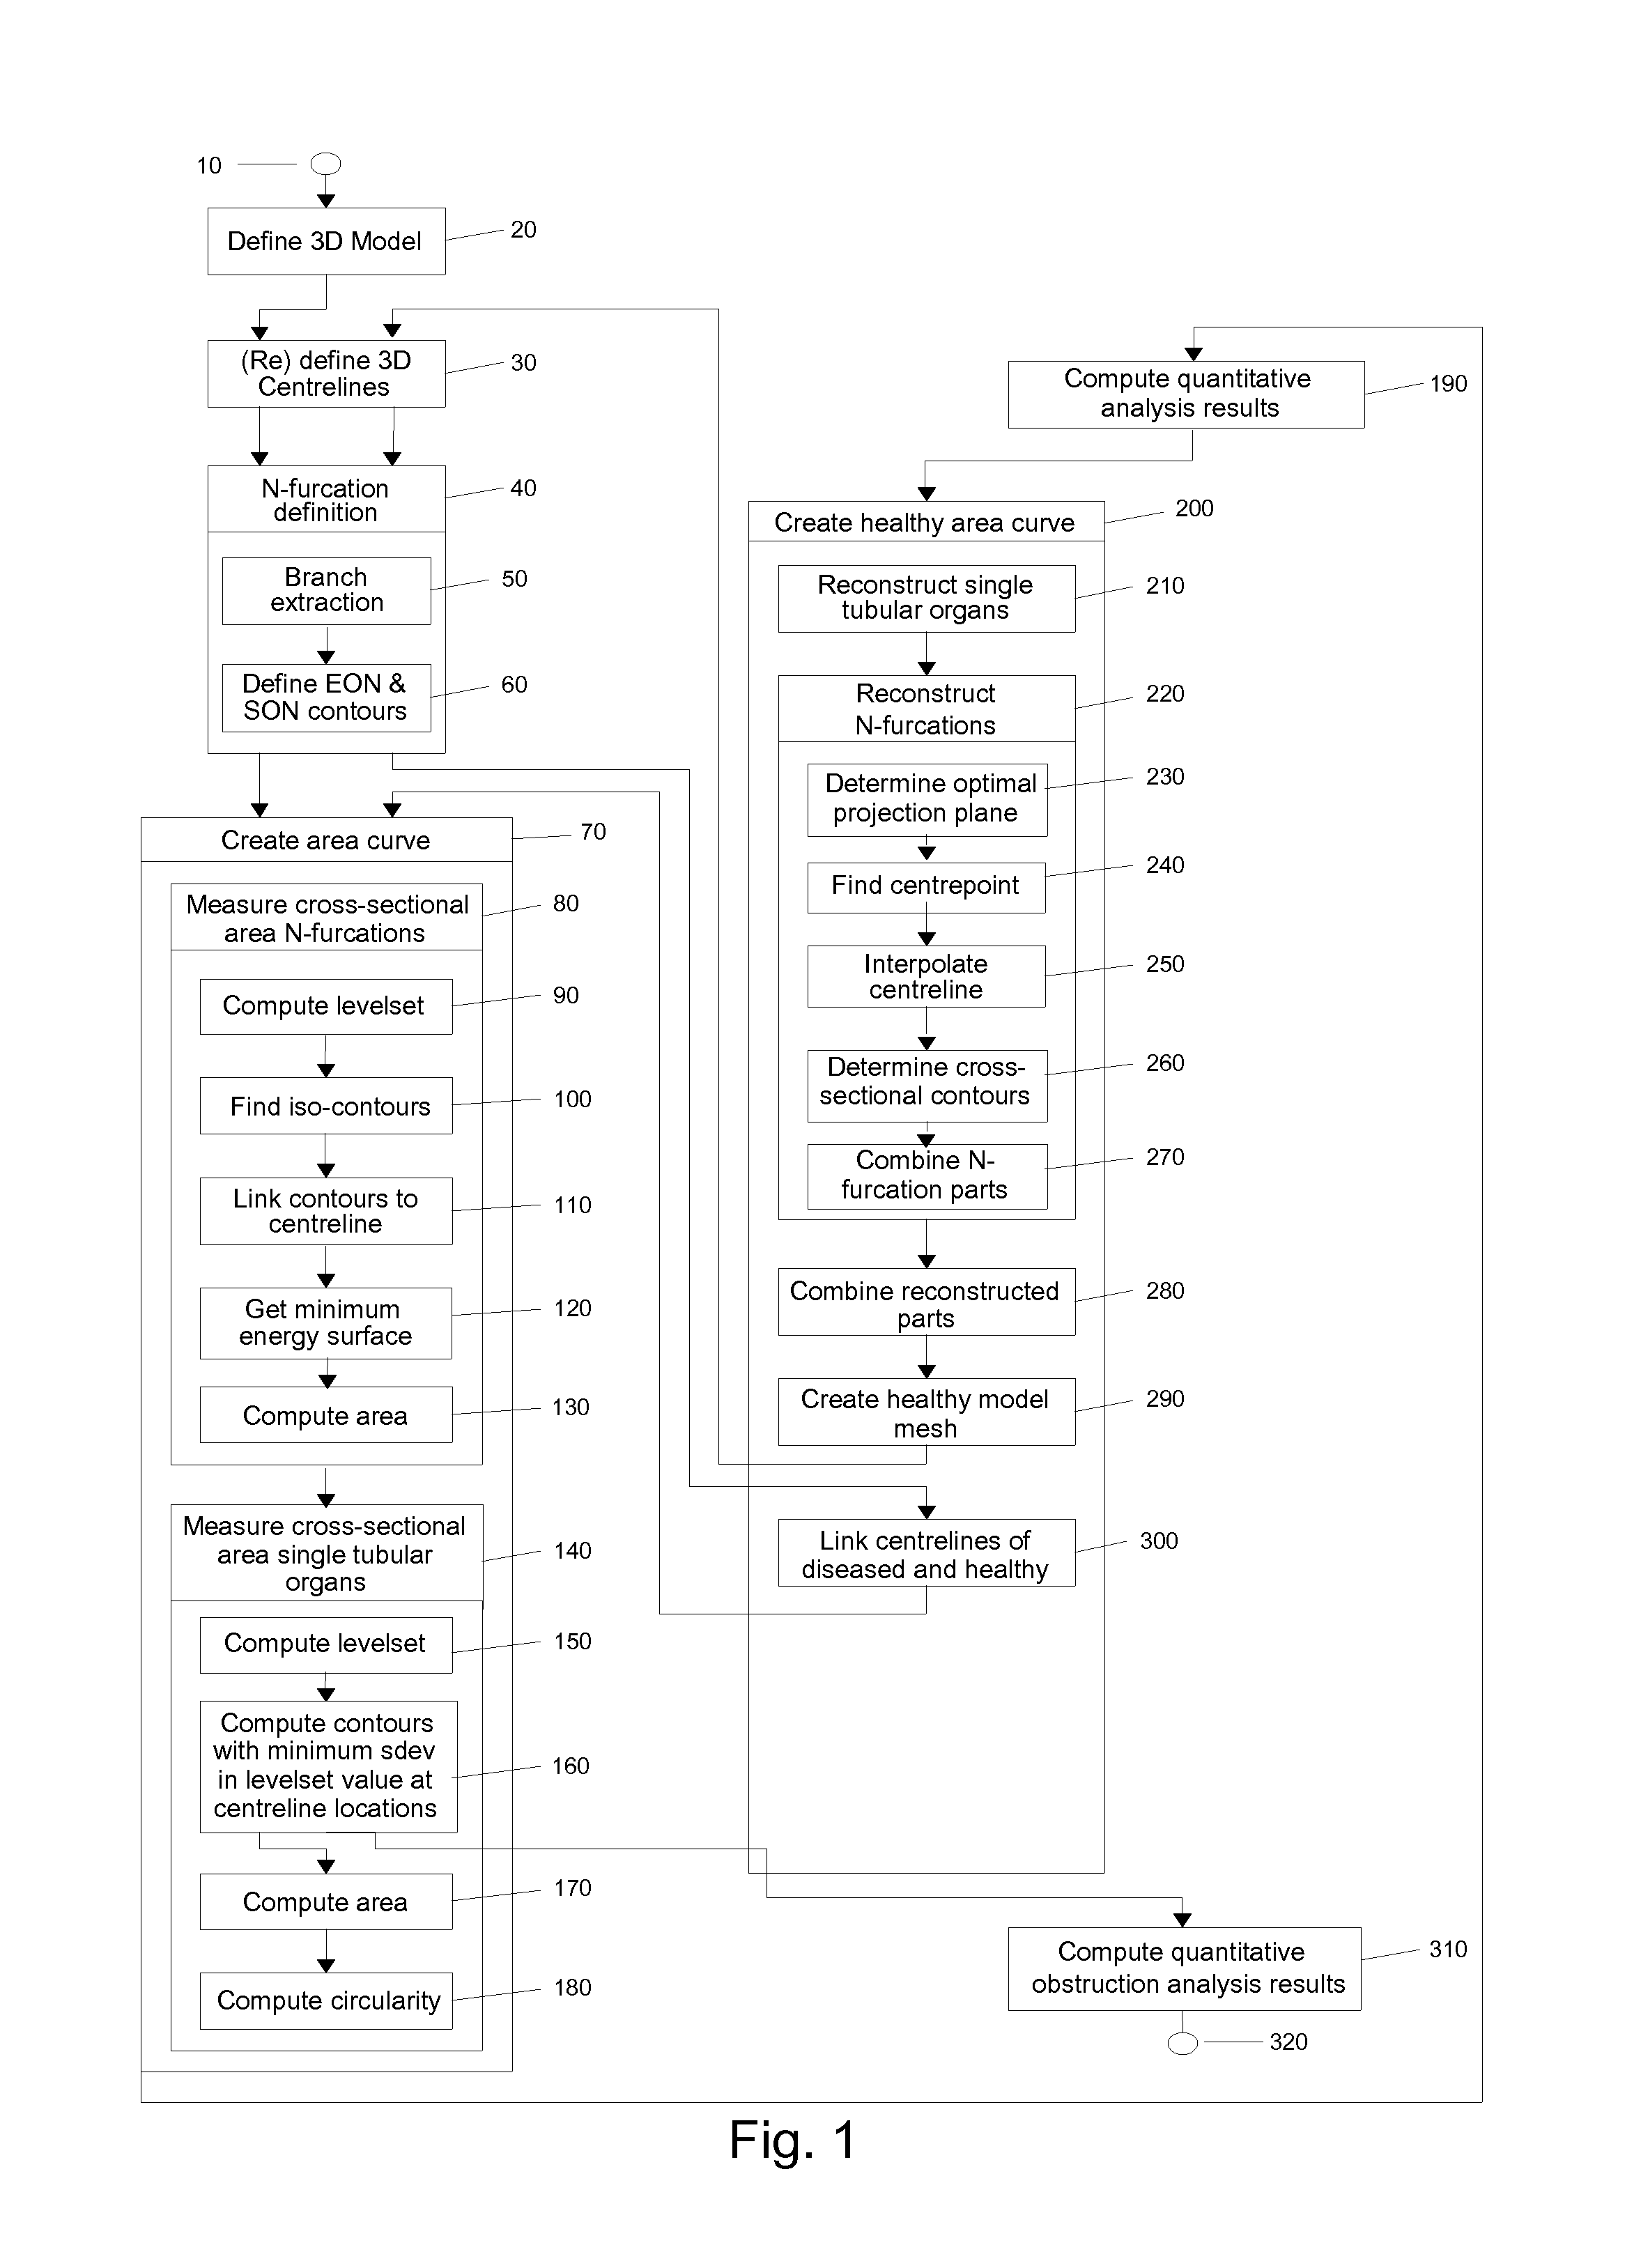
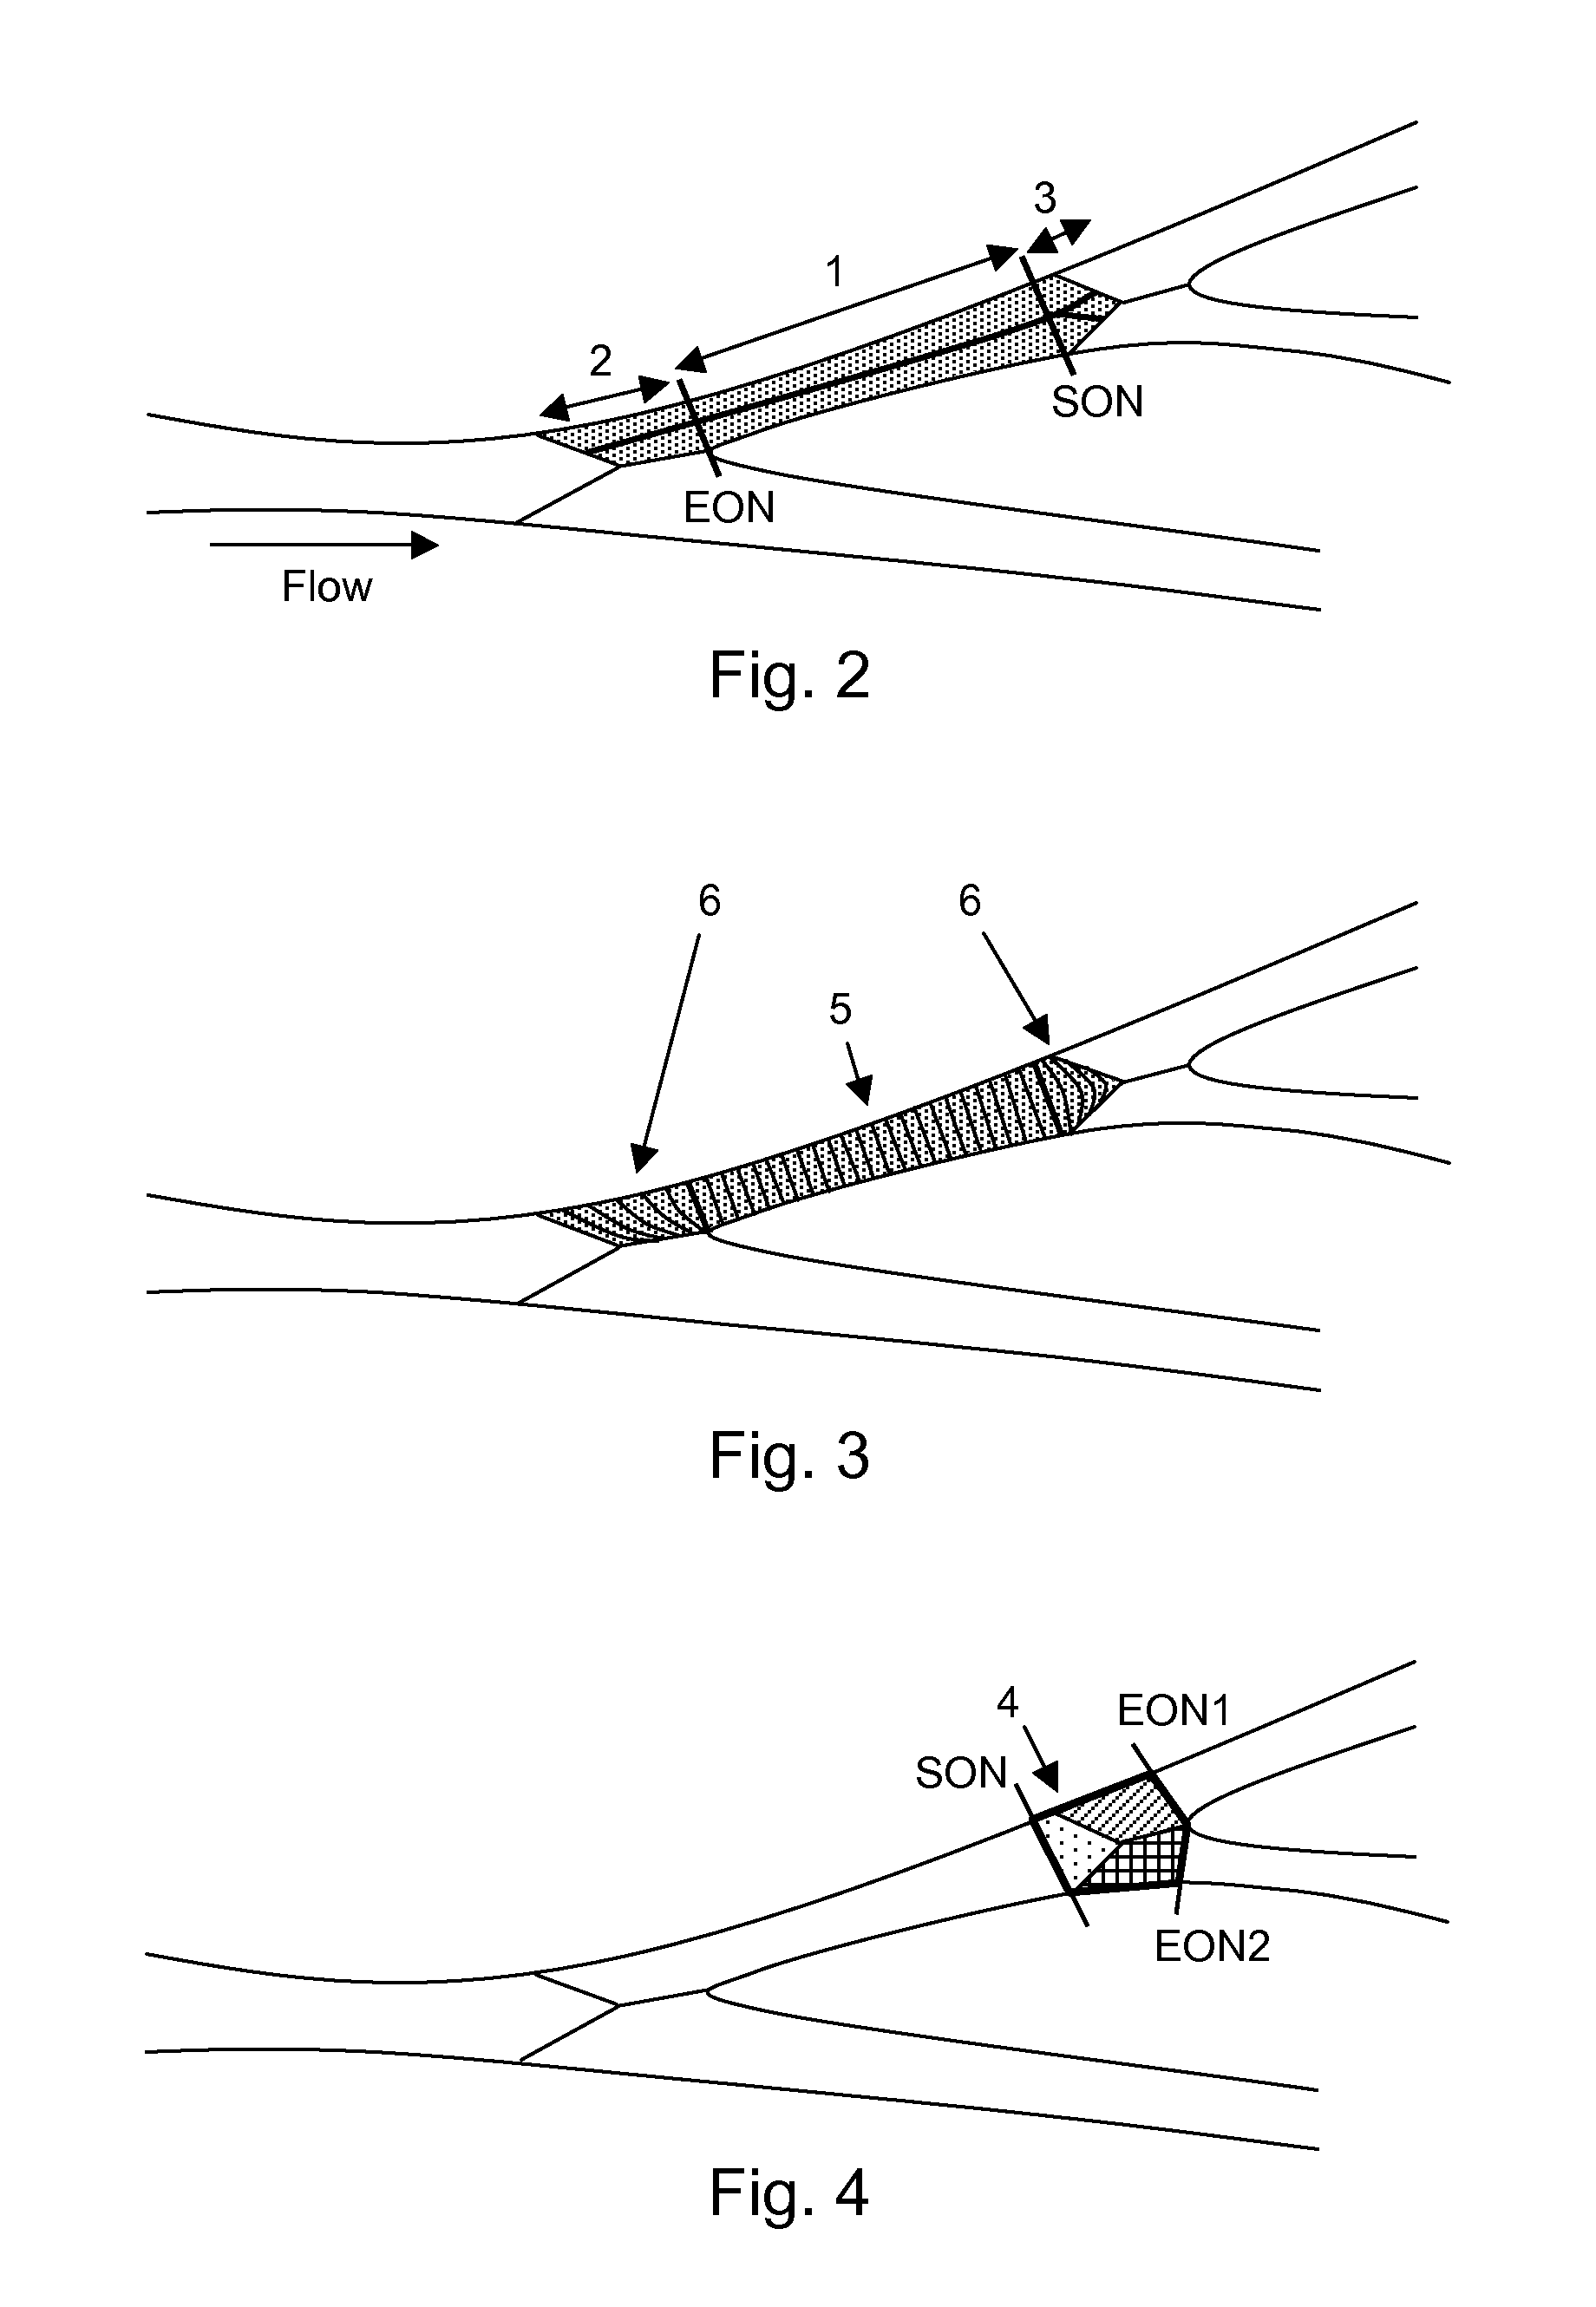
[0093]With reference to the block diagram of FIG. 1, an embodiment of the invention is now described.

[0094]Prior art teaches the definition of the 3D lumen wall of the vessels as represented by block 20 in FIG. 1. This is...


PUM


Abstract

Method for quantitative analysis of a tree or part of a tree of recursively splitting tubular organs, the method comprising the following steps:—providing a 3D model of said tree or part of said tree, such 3D model giving a representation of the surface of the lumen wall of the tubular organs forming the tree or part of the tree;—defining the 3D centrelines of said tree or part of the tree;—identifying the branches of the tree;—identifying N-furcations of the tree or part of the tree, an N-furcation being a part of the tree where a proximal tubular organ branches into two or more distal tubular organs, further comprising the step of:—dividing, independently from the modality used for obtaining the 3D model, each branch in one or more regions, such regions being of two different types, named single vessel region and splitting region, different cross-section surfaces being defined in such regions, wherein the splitting regions can exist at the proximal side of a branch as well as at the distal side of said branch and each N-furcation comprises the distal splitting region of a branch and the proximal splitting regions of the N branches directly distal to said branch. A corresponding apparatus and computer program are also disclosed.

Description

FIELD OF THE INVENTION[0001]The present invention relates to a method and apparatus for a generic and accurate 3D quantitative vascular analysis of a tree of recursively splitting tubular organs.STATE OF THE ART[0002]Vascular image analysis refers to the process of investigating arteries. In clinical practice it is particularly used to determine the severity of any narrowing that may exist, such as by finding obstructed arteries. Quantitative Coronary analysis (QCA) of single arteries has become a standard for objective quantitative assessment of the severity of the obstruction. It is also widely used in clinical trail studies. A clinical trail aims to collect data about the efficacy of a treatment.[0003]Quantitative analysis of an N-furcation, i.e. the splitting of a proximal tubular organ into two or more distal tubular organs, has become of increasing clinical interest as obstructions not only arise in single tubular organs, but also in regions where they split up. Quantitative a...

Claims


Application Information

Patent Timeline
Patent Type & Authority Applications(United States)
IPC IPC(8): G06F19/12G16B15/00G16B5/00
CPCG06T7/0083G06T7/0089G06T17/00G06F19/12G06T7/0012G06T2200/04G06T2207/30101G06T2207/30172G06T7/12G06T7/149G16B5/00G16B15/00
Inventor HOF, JACOBUS ADRIANUS ENGELBERTUS JOHANNESDIEREN, SJOERDSCHORMANS, RON HUBERTUS
Owner PIE MEDICAL IMAGING
Why Eureka
Try Eureka