Intelligent visualisation in the monitoring of process and/or system variables

a monitoring system and intelligent visualization technology, applied in the direction of process and machine control, testing/monitoring control system, instruments, etc., can solve the problems of not being able to avoid a certain level of disturbance and irregularities, not being able to simply specify, and less useful display

Active Publication Date: 2013-09-26
ABB (SCHWEIZ) AG
View PDF1 Cites 2 Cited by
  • Summary
  • Abstract
  • Description
  • Claims
  • Application Information

AI Technical Summary

Problems solved by technology

In large technical systems, for example, power plants, it is frequently not simply possible to specify which of the often many thousands of process and system variables can be important for a visualization.
Nonetheless, given the surrounding circumstances of the process or the states of the system components and measuring points, because of noise, it may not be possible to avoid a certain level of disturbance and irregularities, even during normal operation of the system or the course of the process without any malfunctions or external influencing factors.
The greater the irregularity and disturbance due to noise, the less useful the display will be, for example, on a display of a monitor of the higher control level of an automation system.
The expense of monitoring them can increase relatively substantially with the amount of available process and / or system data.
Since humans are able to monitor only a limited amount of data in parallel, the primary limitations can be the ability of system operators to absorb the information and the available monitor space.
However, fluctuations are often not recognized as such by the system operator and are therefore often interpreted as misalignment.
For example, rapid fluctuations of the system or process values can cause disturbance in the mass data display.

Method used


Image

  • Intelligent visualisation in the monitoring of process and/or system variables
  • Intelligent visualisation in the monitoring of process and/or system variables
  • Intelligent visualisation in the monitoring of process and/or system variables

Examples


Embodiment Construction

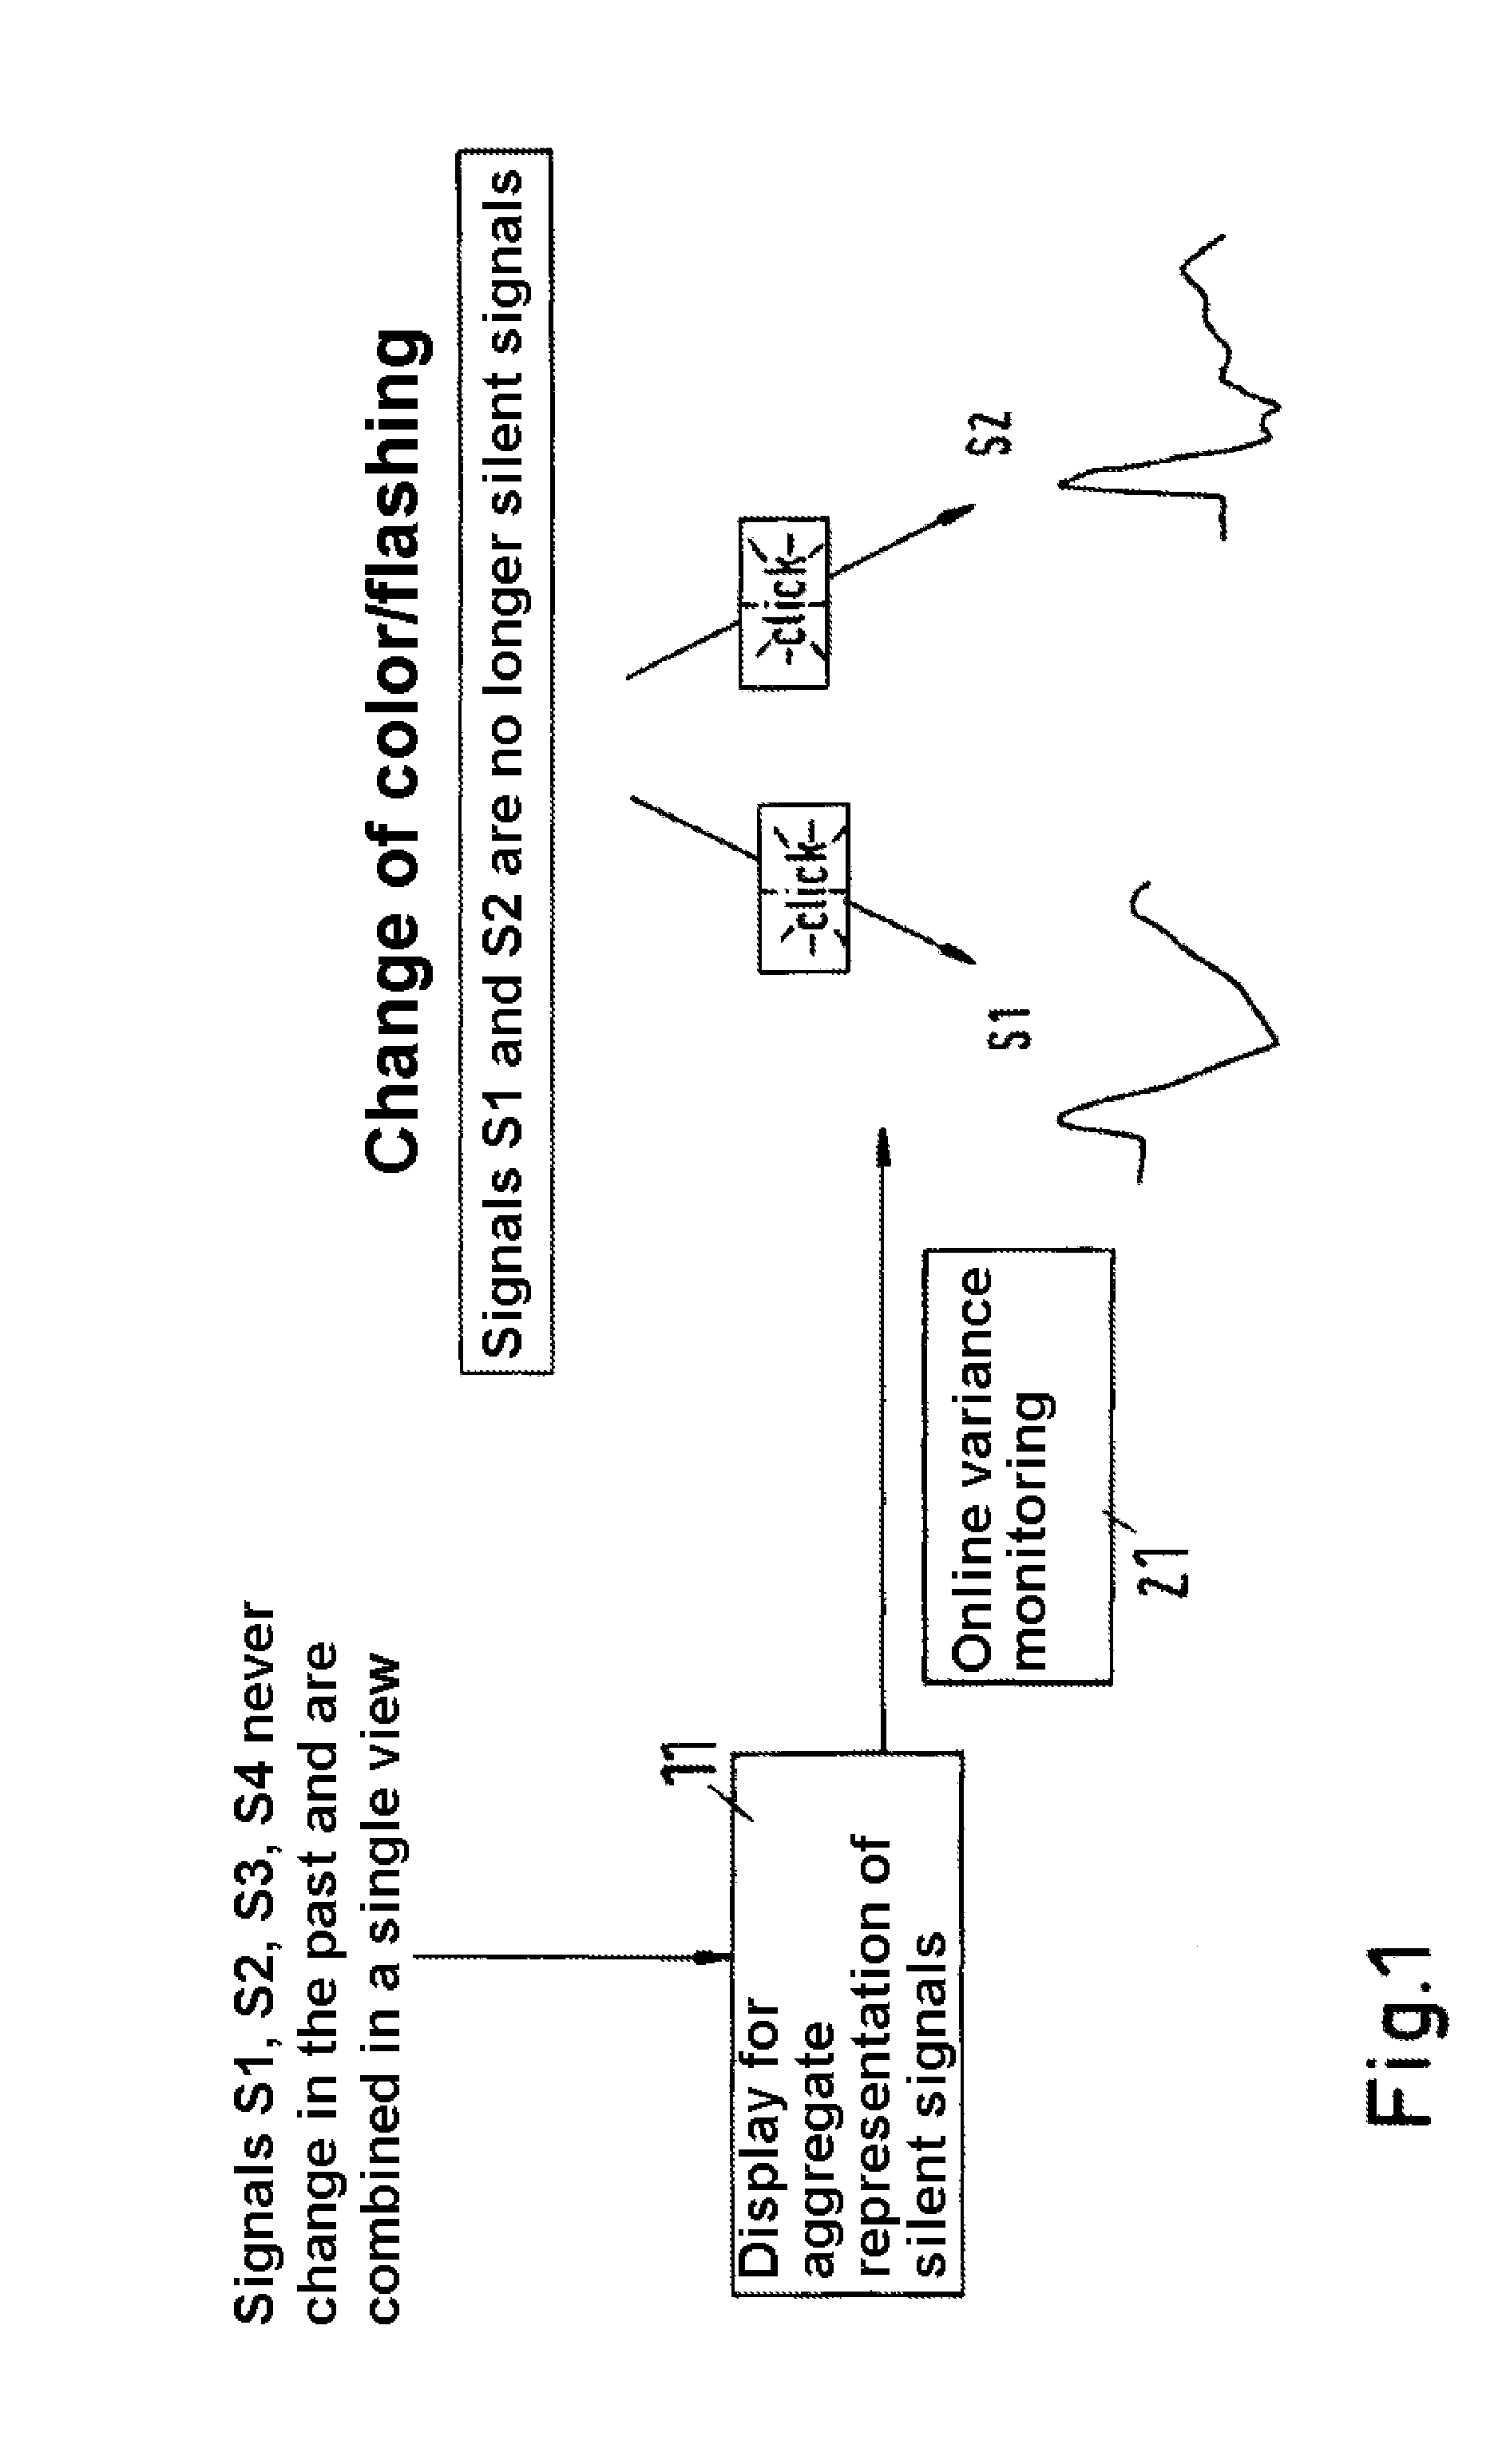
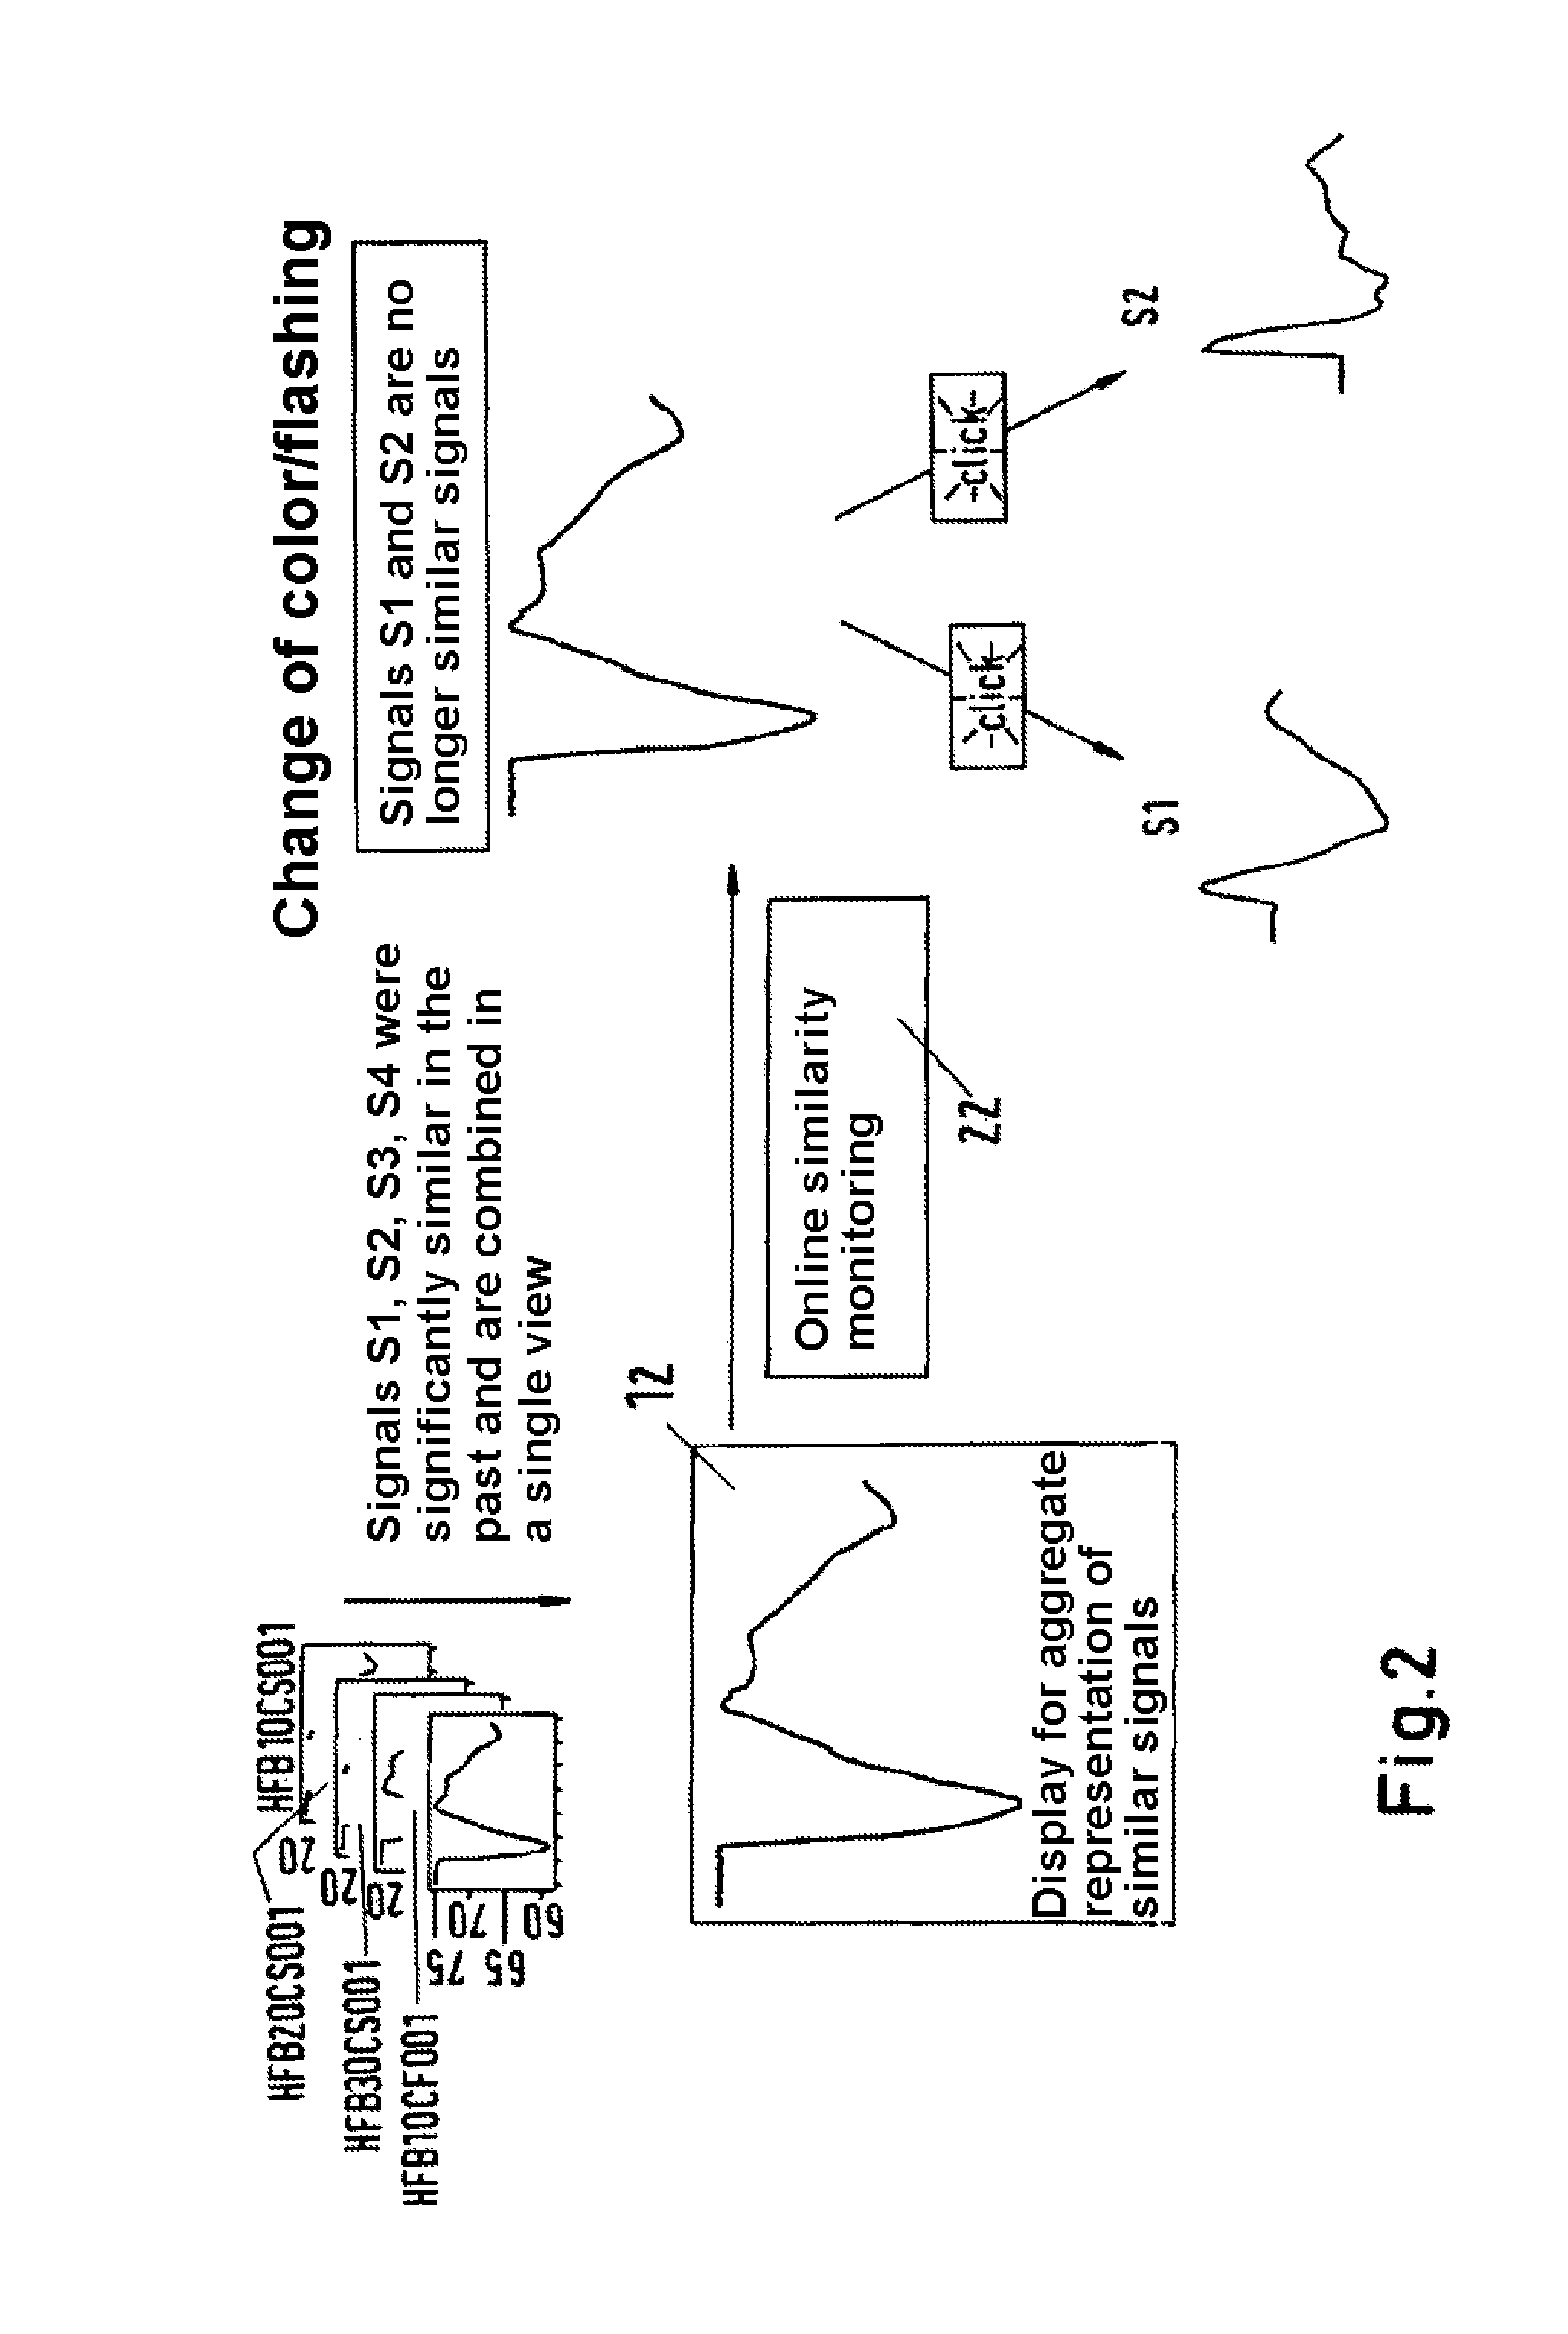
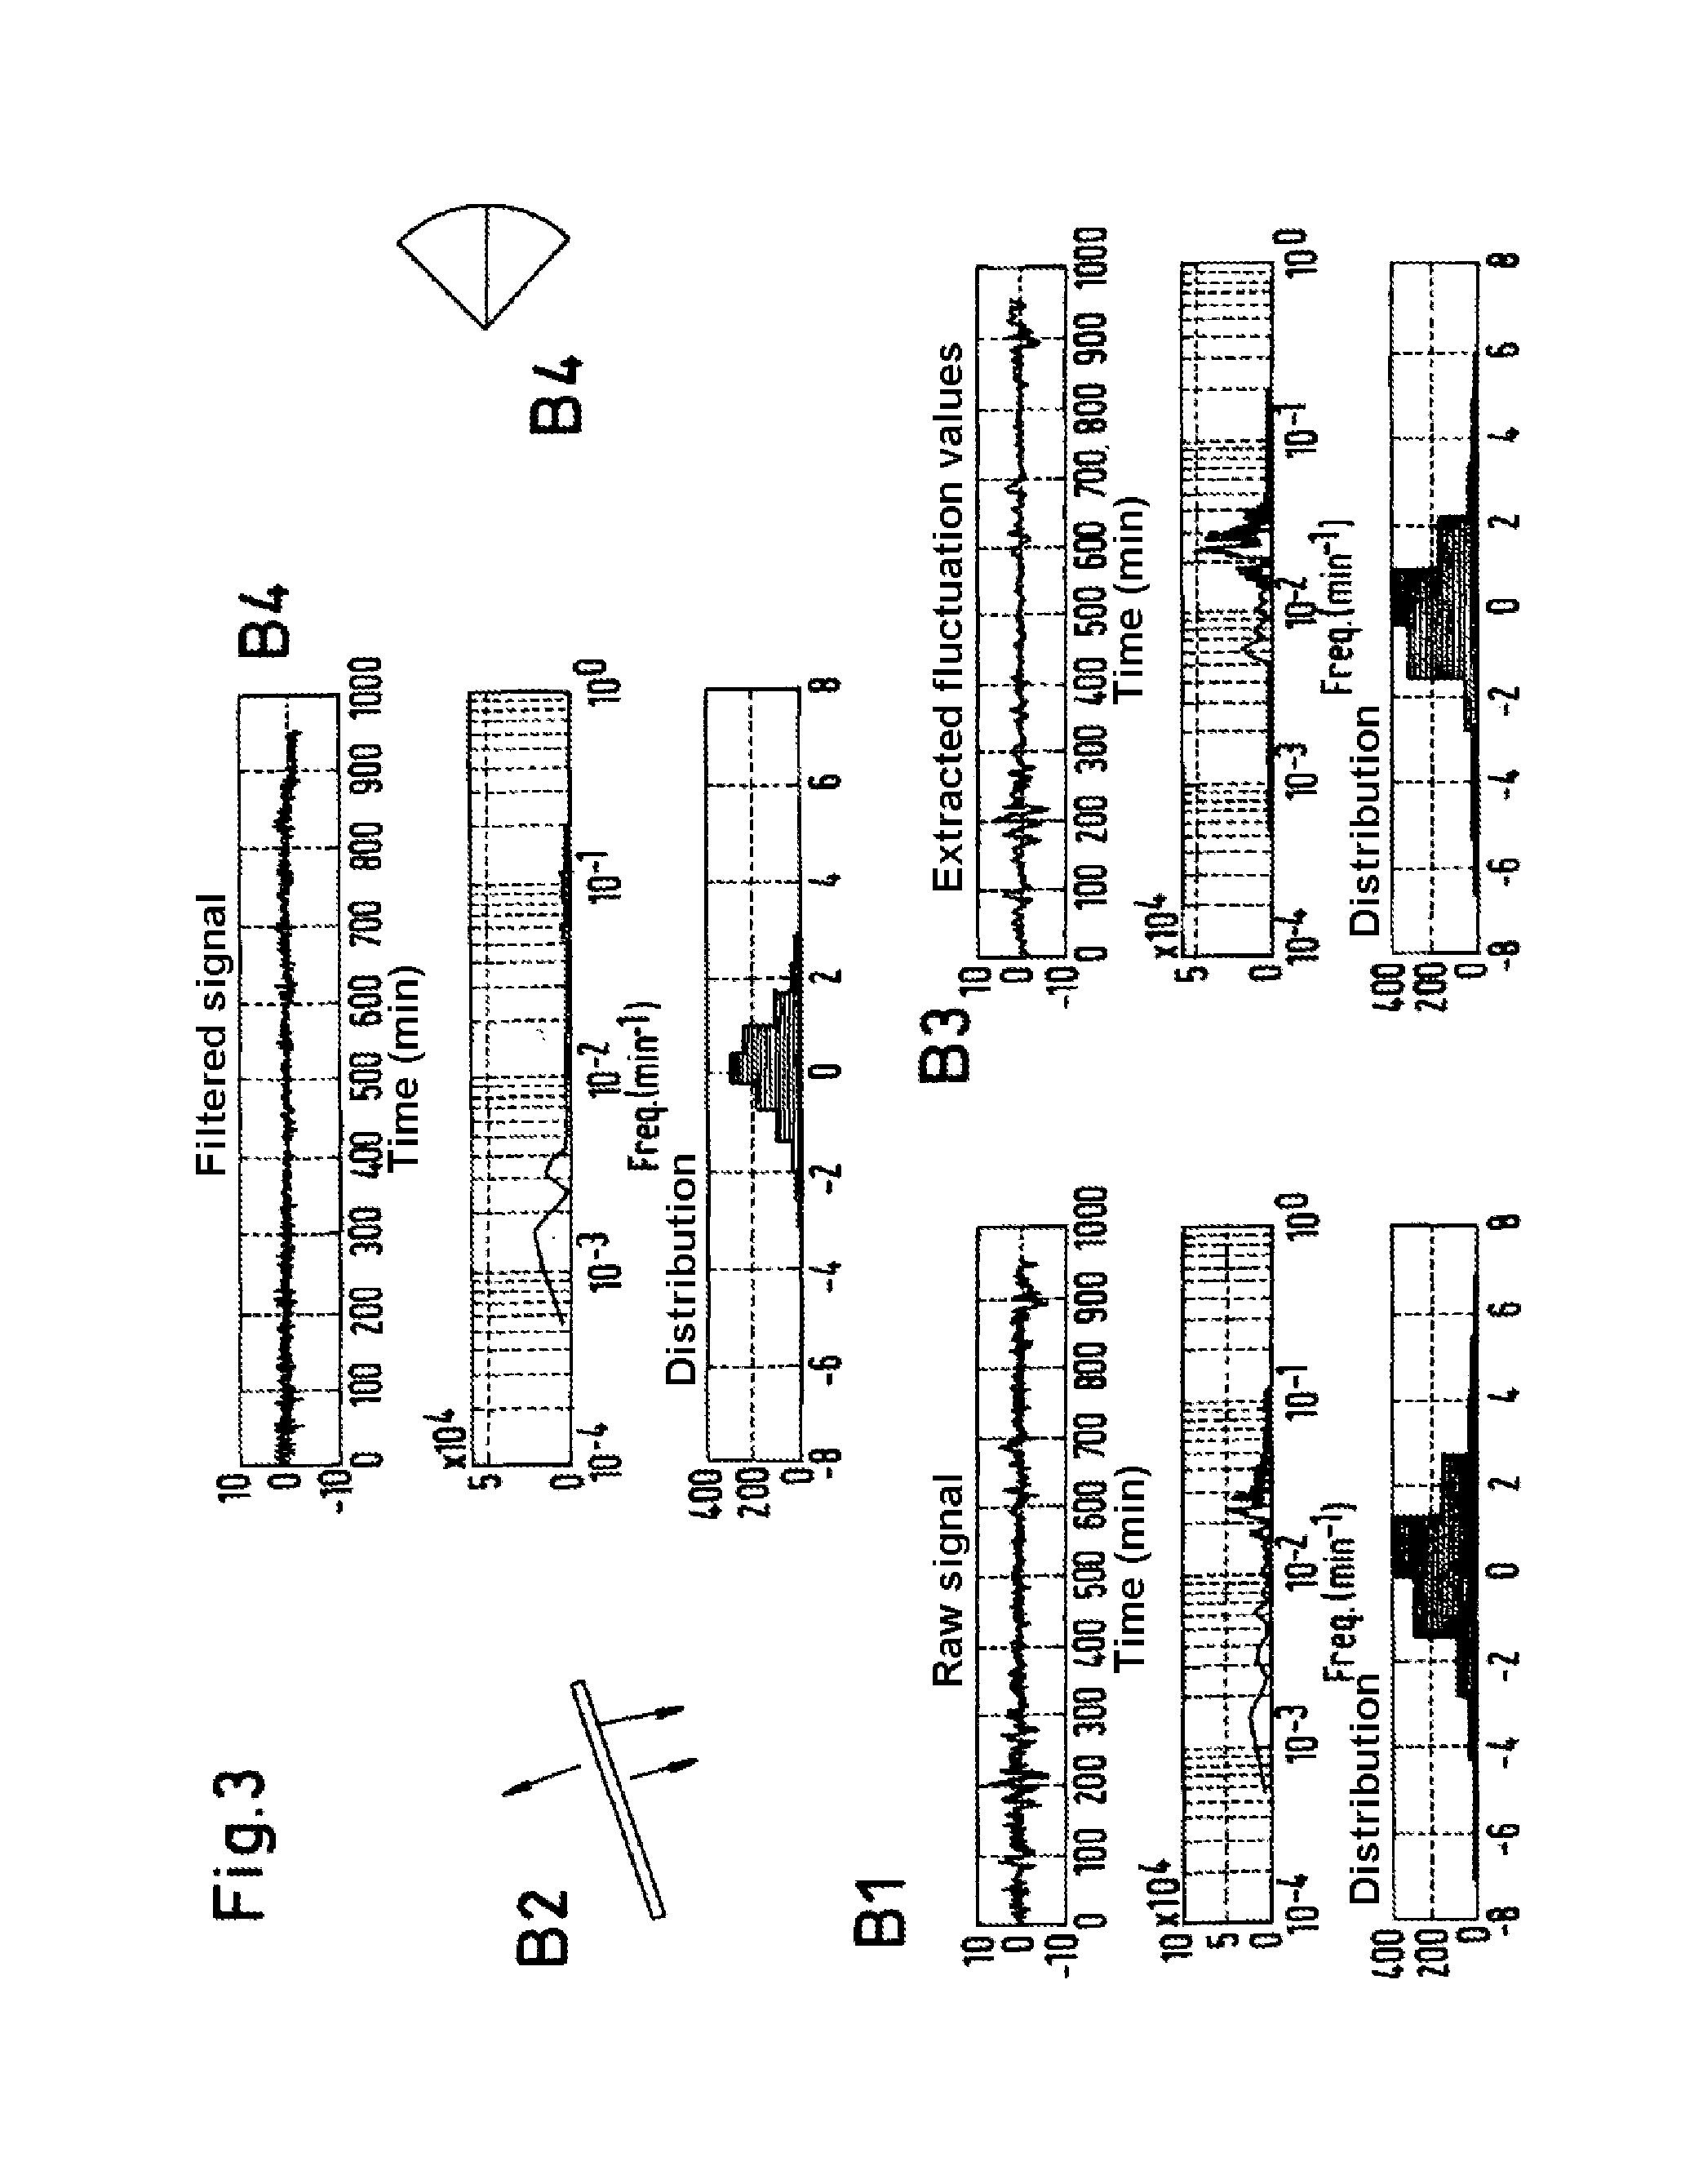
[0016]The disclosure relates to a method and a system for intelligent visualization in the monitoring of process and / or system variables, for example, of so-called mass data, for example, a plurality of process and / or operating data, which appear during the operation of technical systems or during the course of technical processes. The disclosure can be suitable for the graphical representation of process data, for example, of mass data, on a display device, hereinafter also called a display, for example, in plant engineering, control and instrumentation, and process planning.

[0017]In accordance with an exemplary embodiment, the detected characteristics can be used to optimize the view or representation form for displaying the mass data. In accordance with an exemplary embodiment, a method for intelligent visualization in the monitoring of process and / or system variables, for example, so-called mass data is disclosed, which can limit the effort needed for calibration to a reasonable...


PUM


Abstract

The disclosure relates to a method and system for intelligent visualization in the monitoring of process and/or system data used in technical processes and in the operation of technical systems. The behavior of signals in the past is analyzed and used for a future optimized visualization. Continuously running online algorithms support the system operator by detecting and correspondingly highlighting deviations from the historically observed signal patterns.

Description

RELATED APPLICATION(S)[0001]This application claims priority as a continuation application under 35 U.S.C. §120 to PCT / EP2011 / 004175, which was filed as an International Application on Aug. 19, 2011 designating the U.S., and which claims priority to European Application 10014593.7 filed in Europe on Nov. 13, 2010. The entire contents of these applications are hereby incorporated by reference in their entireties.FIELD[0002]The disclosure relates to a method and a system for intelligent visualization in the monitoring of process and / or system variables.BACKGROUND INFORMATION[0003]So-called mass data displays can represent a large number of standardized process variables in comparatively little monitor space. In large technical systems, for example, power plants, it is frequently not simply possible to specify which of the often many thousands of process and system variables can be important for a visualization. Therefore, the configuration and calibration of mass data displays can be ...

Claims


Application Information

Patent Timeline
Patent Type & Authority Applications(United States)
IPC IPC(8): G01R13/00
CPCG01R13/00G05B23/0216G05B23/0272
Inventor CHIOUA, MONCEFHOLLENDER, MARTIN
Owner ABB (SCHWEIZ) AG
Why Eureka
Try Eureka