System and Method for Visualisation of Behaviour within Computer Infrastructure

a technology of computer infrastructure and monitoring system, applied in knowledge representation, instruments, computing models, etc., can solve problems such as negative impact on at least one device of computer infrastructure, abnormal performance, etc., and achieve the effect of time-consuming manual data mining

Active Publication Date: 2013-10-03
ELASTICSEARCH BV
View PDF39 Cites 109 Cited by
  • Summary
  • Abstract
  • Description
  • Claims
  • Application Information

AI Technical Summary

Benefits of technology

[0021]The present disclosure enables the functionality and performance of the computer infrastructure and / or at least of one device to be visualized in an intuitive way. The teachings of the present disclosure allow the displaying of the analysed behaviour of at least one device or the computer infrastructure itself An IT-administrator could detect easily abnormal behaviours, such as possible malfunctions or underperformances of at least one of the devices and / or within the computer infrastructure, by investigating the display of grouped graphic elements related to performances of devices and / or the computer infrastructure. This helps to avoid expensive and time-consuming data mining by the IT-administrator within a plurality of messages as an indicator for the performances of at least one device and / or the computer infrastructure itself
[0023]Graphic elements are linked to the relationships within the computer infrastructure and are visualized on a display. The graphic elements help the IT-administrator in an easy and intuitive way to analyse at least the relationships, especially in case of abnormal behaviour. The graphic elements may vary in relation to detected abnormal types of behaviours. In this case the IT-administrator could view in an easy and quick way possible abnormal functionalities, malfunctions and abnormal performances of at least one device or of computer infrastructure. Further, at least some of the graphic elements are selectable for opening directly the related types of system parameters and the log file data entries within the computer infrastructure. According to this aspect of the invention, the IT-administrator could select directly and intuitively the relevant graphic element and therefore obtain at least one of the related information. According to the present disclosure, a time-consuming manually data mining of the IT-administrator for finding the relevant messages or log data related to the abnormal performance within the computer infrastructure is reduced.

Problems solved by technology

A possible deviation of the recent and / or future functionally of the computer infrastructure in comparison with a multi-dimensional model of the computer infrastructure is expected to be an abnormal performance, which may have a negative impact on at least one device of the computer infrastructure.
The detection of abnormal messages within the computer infrastructure, such as a shutdown-message of at least one device and / or performance deviations above a certain threshold of at least one device are expected to be abnormal performances within the computer infrastructure.

Method used


Image

  • System and Method for Visualisation of Behaviour within Computer Infrastructure
  • System and Method for Visualisation of Behaviour within Computer Infrastructure
  • System and Method for Visualisation of Behaviour within Computer Infrastructure

Examples


Embodiment Construction

[0030]The invention will now be described on the basis of the drawings. It will be understood that the embodiments and aspects of the invention described herein are only examples and do not limit the protective scope of the claims in any way. The invention is defined by the claims and their equivalents. It will be understood that features of one aspect or embodiment of the invention can be combined with a feature of a different aspect or aspects and / or embodiments of the invention.

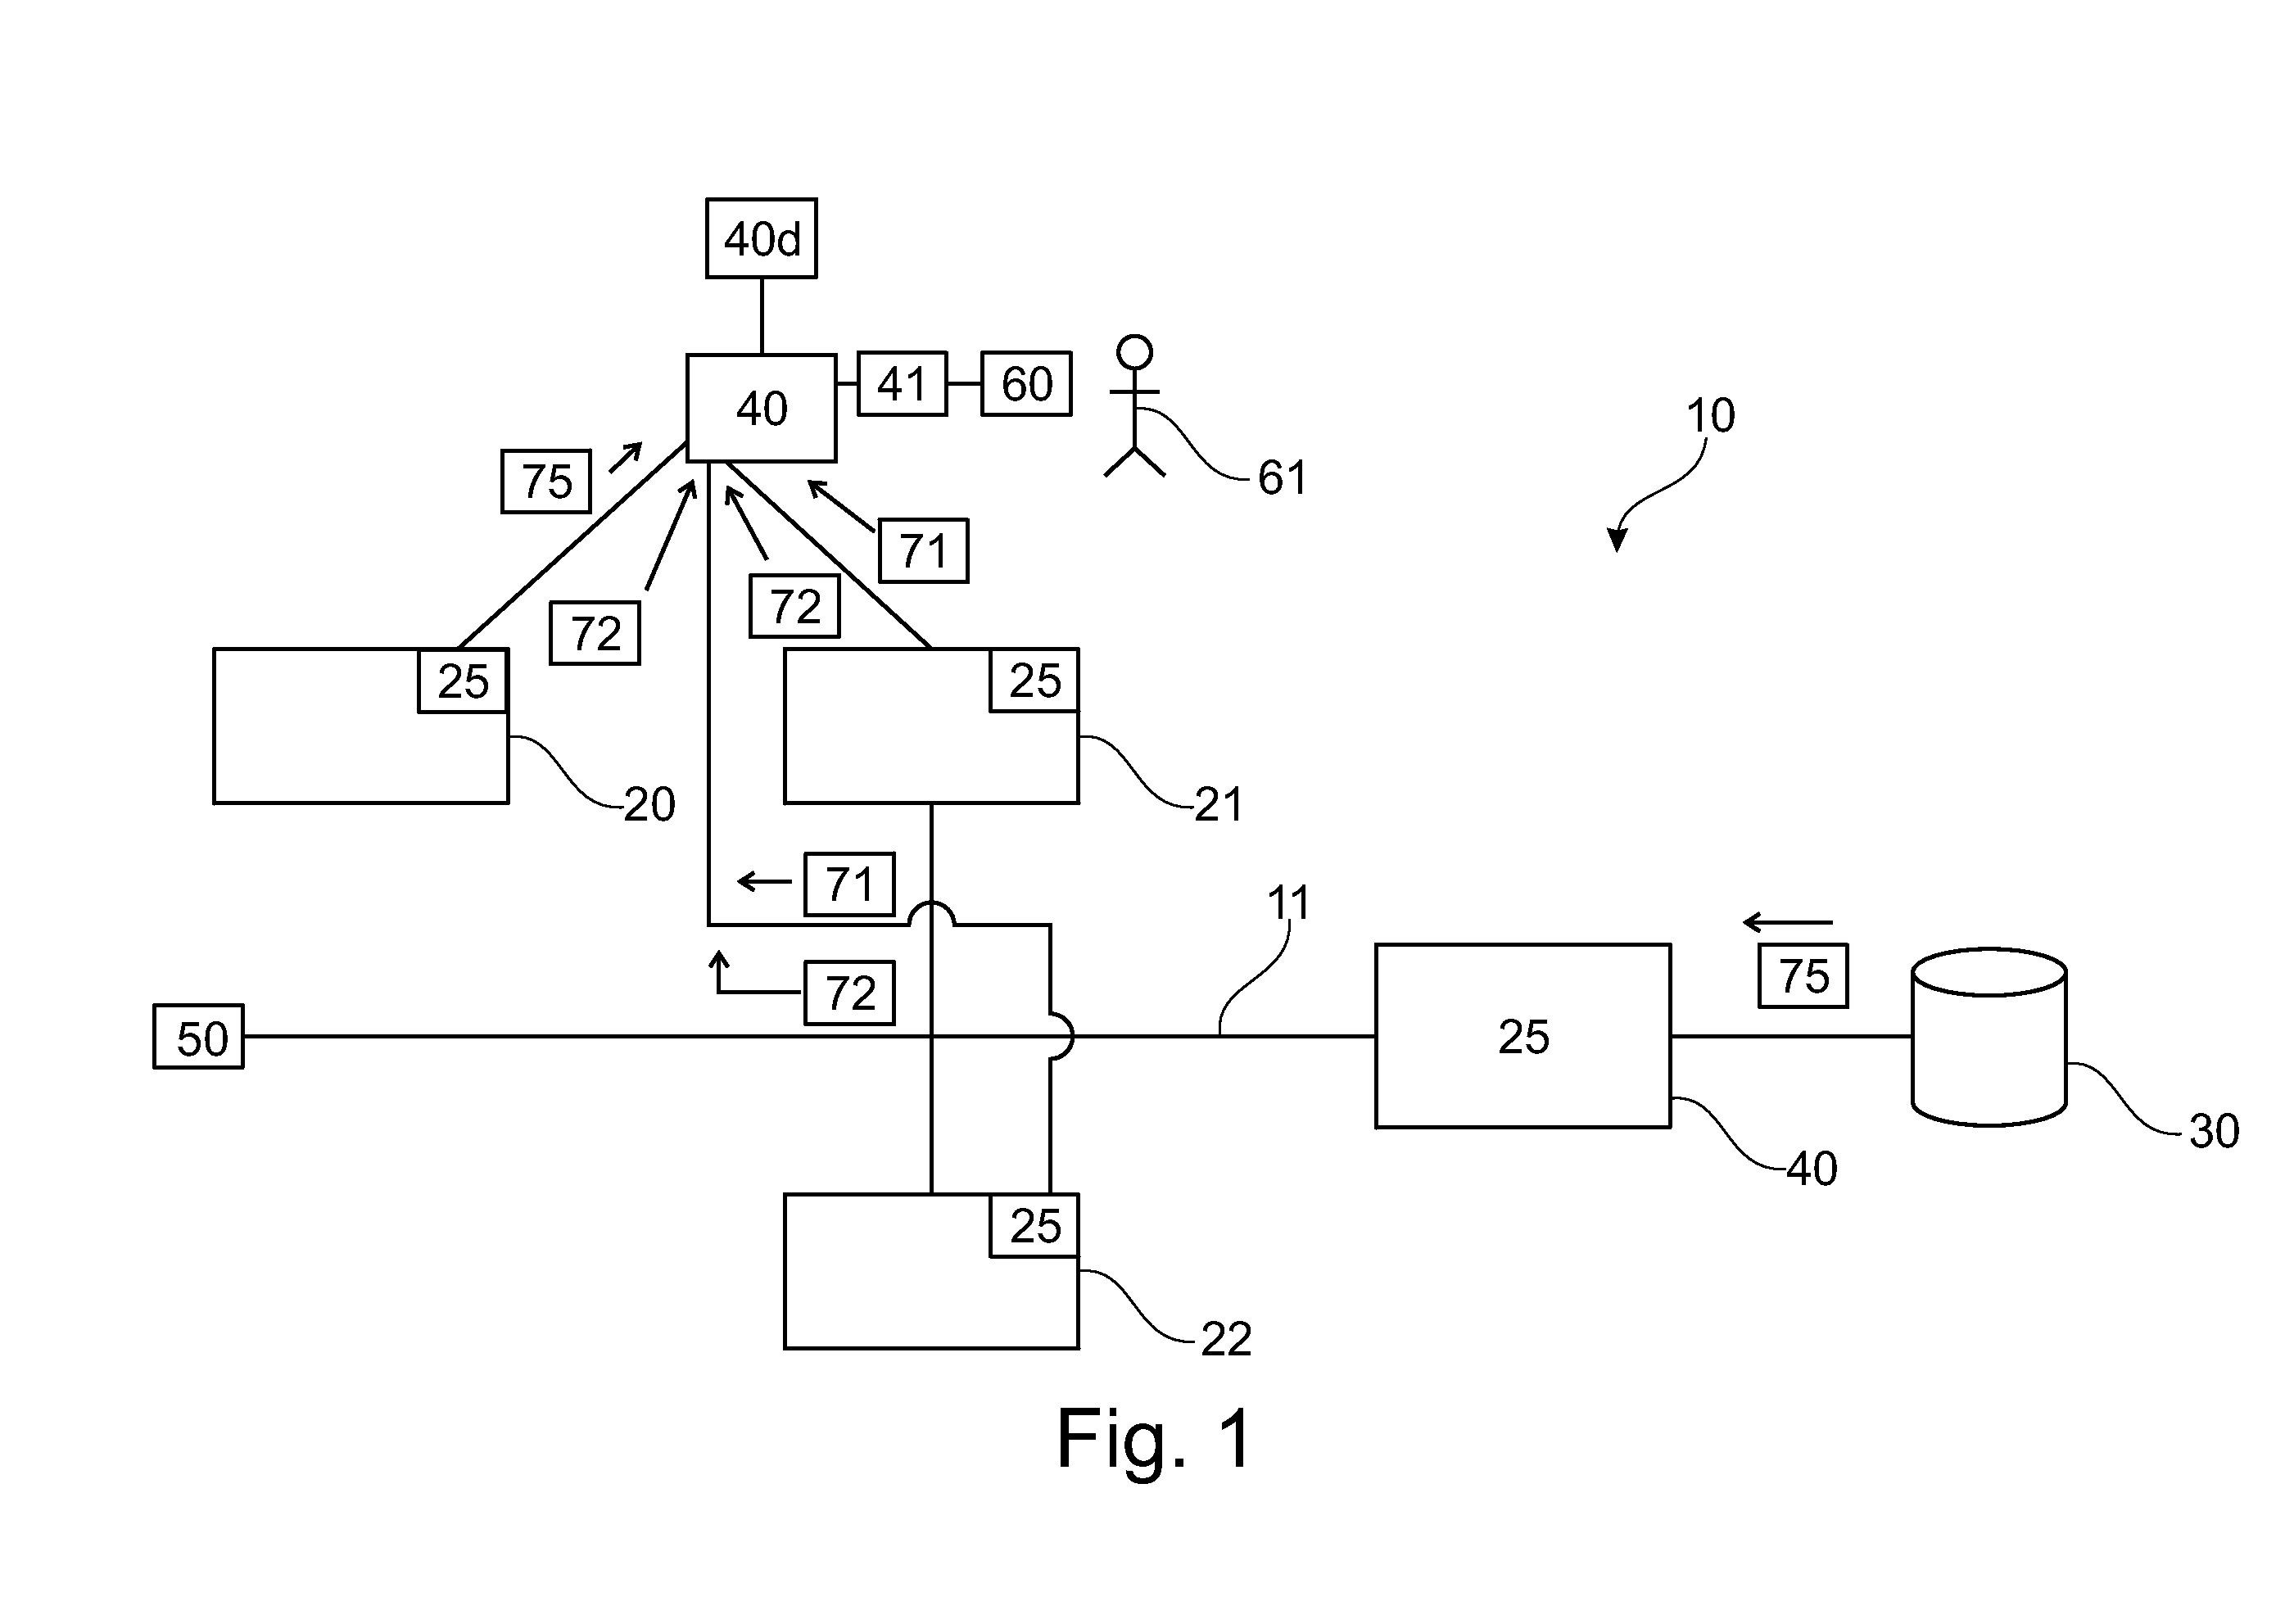
[0031]FIG. 1 shows a computer infrastructure 10 with three devices 20, 21, 22, a management system 40 with database 40d, an analytics engine 41 and an administrator terminal 60 connected with an external data source 30 through a web server 26. The external data source 30 sends data to the one or more devices 20, 21, 22 for processing by applications programs running on the one or more devices 20, 21, 22 through the web server 26. The transfer of data and the processing by applications programs produces asy...


PUM


Abstract

The field of the disclosure relates generally to a method and system for analysing behaviour of a computer infrastructure and the displaying the behaviour of the computer infrastructure in a graphical manner. The system comprises an analytical engine connected to agents running on devices in the computer infrastructure and analysing continuous data and asynchronous data.

Description

CROSS-REFERENCE TO RELATED APPLICATIONS[0001]The present application claims the benefit of the filing date of U.S. Provisional Patent Application Ser. No. 61 / 617,163 filed by the present inventor on Mar. 9, 2012.[0002]This application additionally is related to U.S. Patent Application Publication No. US 2011-0145400 A1, entitled “Apparatus and Method for Analysing a Computer Infrastructure” and filed on 10 Dec. 2010.[0003]The above cross-referenced related applications are hereby incorporated by reference herein in their entirety.FIELD OF THE INVENTION[0004]The field of the invention relates generally to a monitoring system for a computer infrastructure and to displaying of the behaviour of the computer infrastructure.BACKGROUND OF THE INVENTION[0005]Present-day computer infrastructures are very complex and a large numbers of processes, often called threads, as part of applications are running on a plurality of devices in the computer infrastructure. The processes organise data proc...

Claims


Application Information

Patent Timeline
Patent Type & Authority Applications(United States)
IPC IPC(8): G06N5/02
CPCG06F11/328G06N5/02G06F11/3409G06F11/3476G06F11/3055G06F11/3495G06N20/00G06N7/00
Inventor DODSON, STEPHEN
Owner ELASTICSEARCH BV
Why Eureka
Try Eureka