
System and method for university model graph based visualization

Inactive Publication Date: 2014-06-05
SRM INST OF SCI & TECH
View PDF1 Cites 6 Cited by
  • Summary
  • Abstract
  • Description
  • Claims
  • Application Information

AI Technical Summary

Benefits of technology

The invention provides a system for creating multiple multi-dimensional views of an educational institution's information. This helps evaluate the school at different levels. The system uses a database with assessments and influence values to create a visual representation of the Reach the educational institution's information in a more convenient and comprehensive way. This system includes a plurality of entities and models, with each model correlating to an entity. This representation helps understand the educational institution better at various levels.

Problems solved by technology

The known systems do not address the issue of visualization based on a comprehensive modeling of an educational institution at various levels in order to be able to provide adequate views to help assess the educational institution at various levels.

Method used


Image

  • System and method for university model graph based visualization
  • System and method for university model graph based visualization
  • System and method for university model graph based visualization

Examples


Embodiment Construction

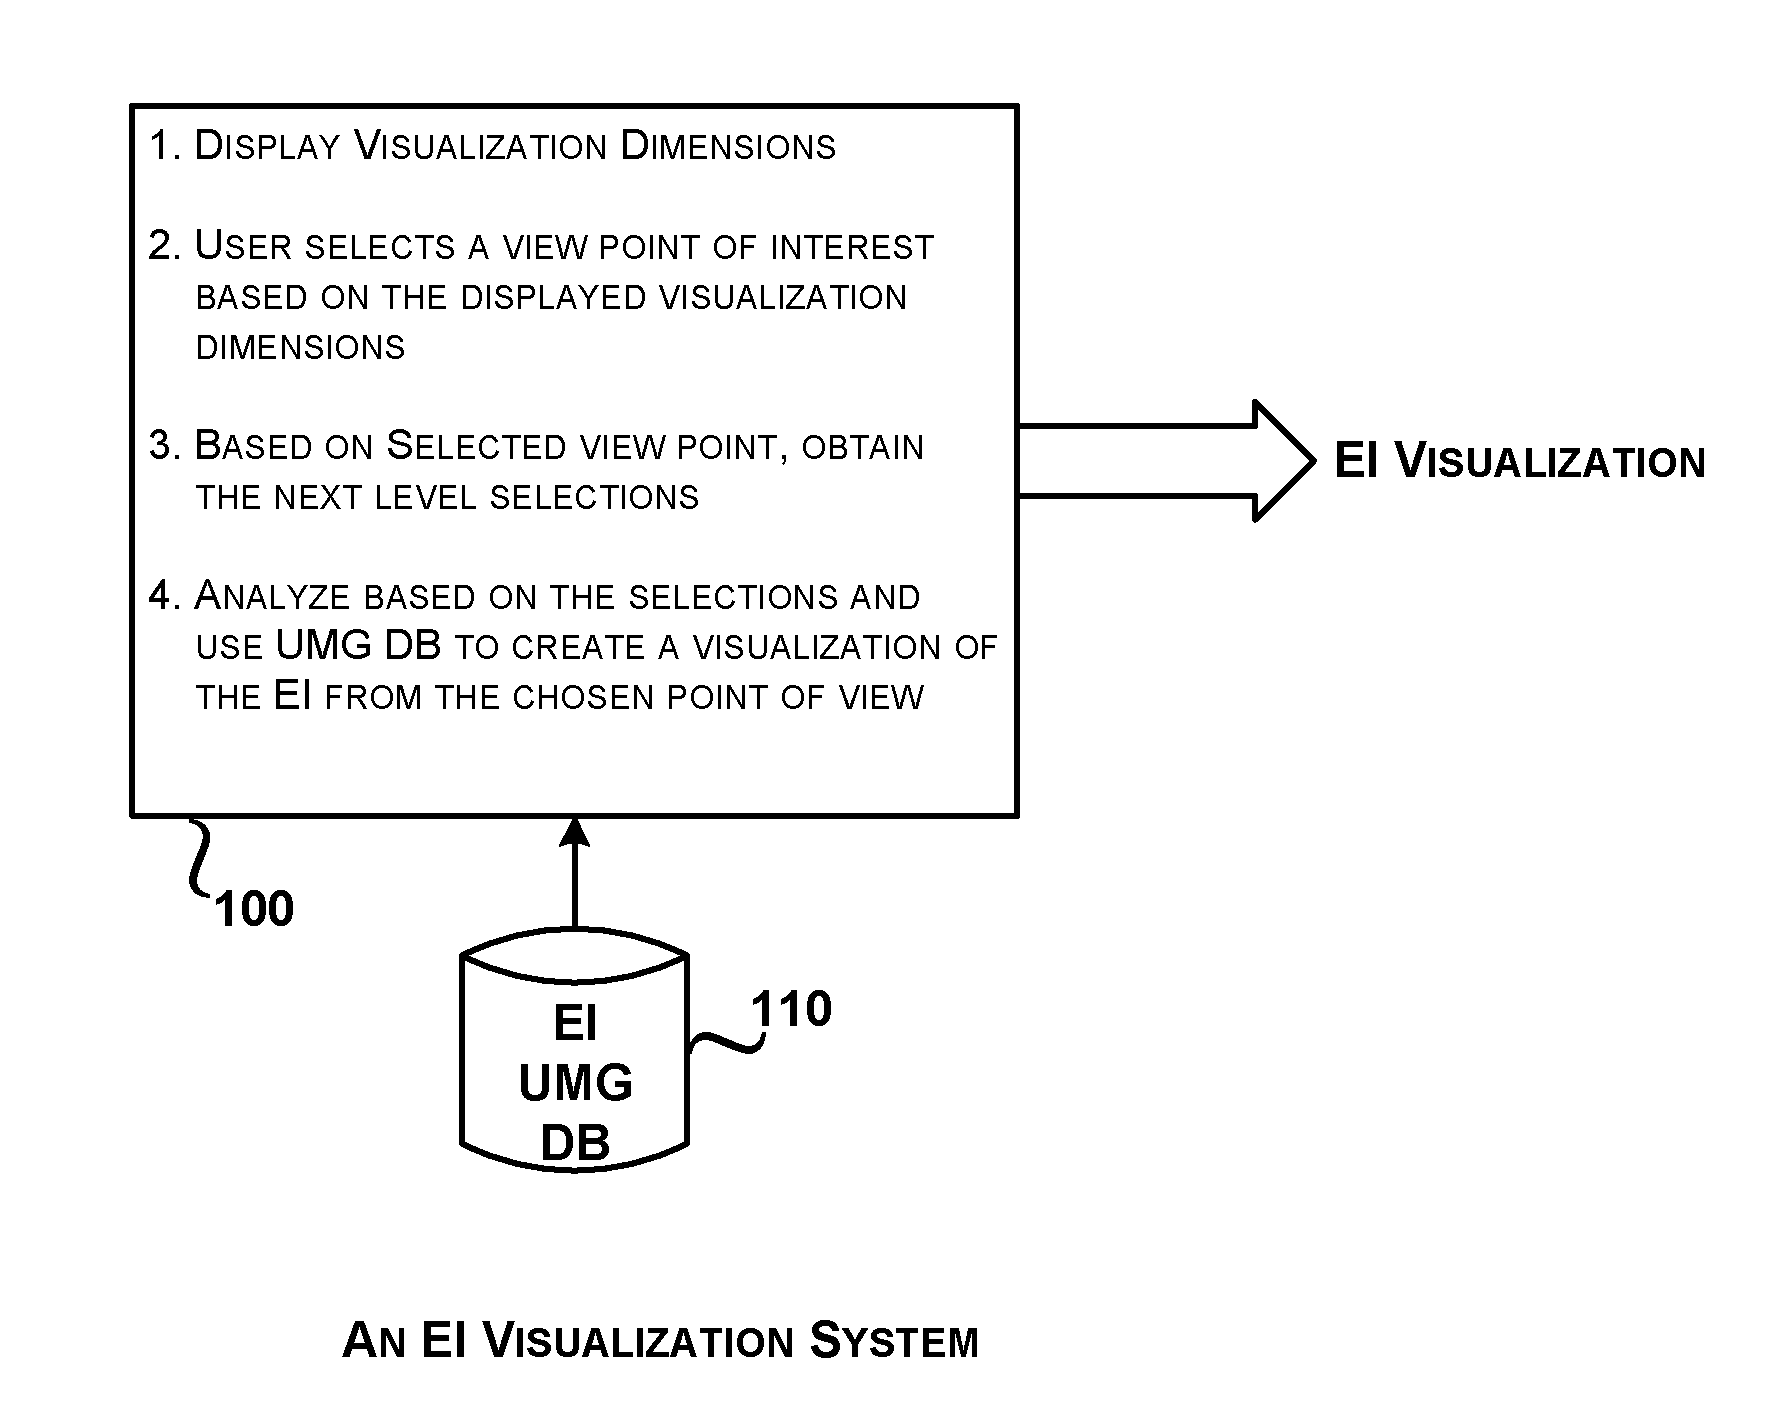
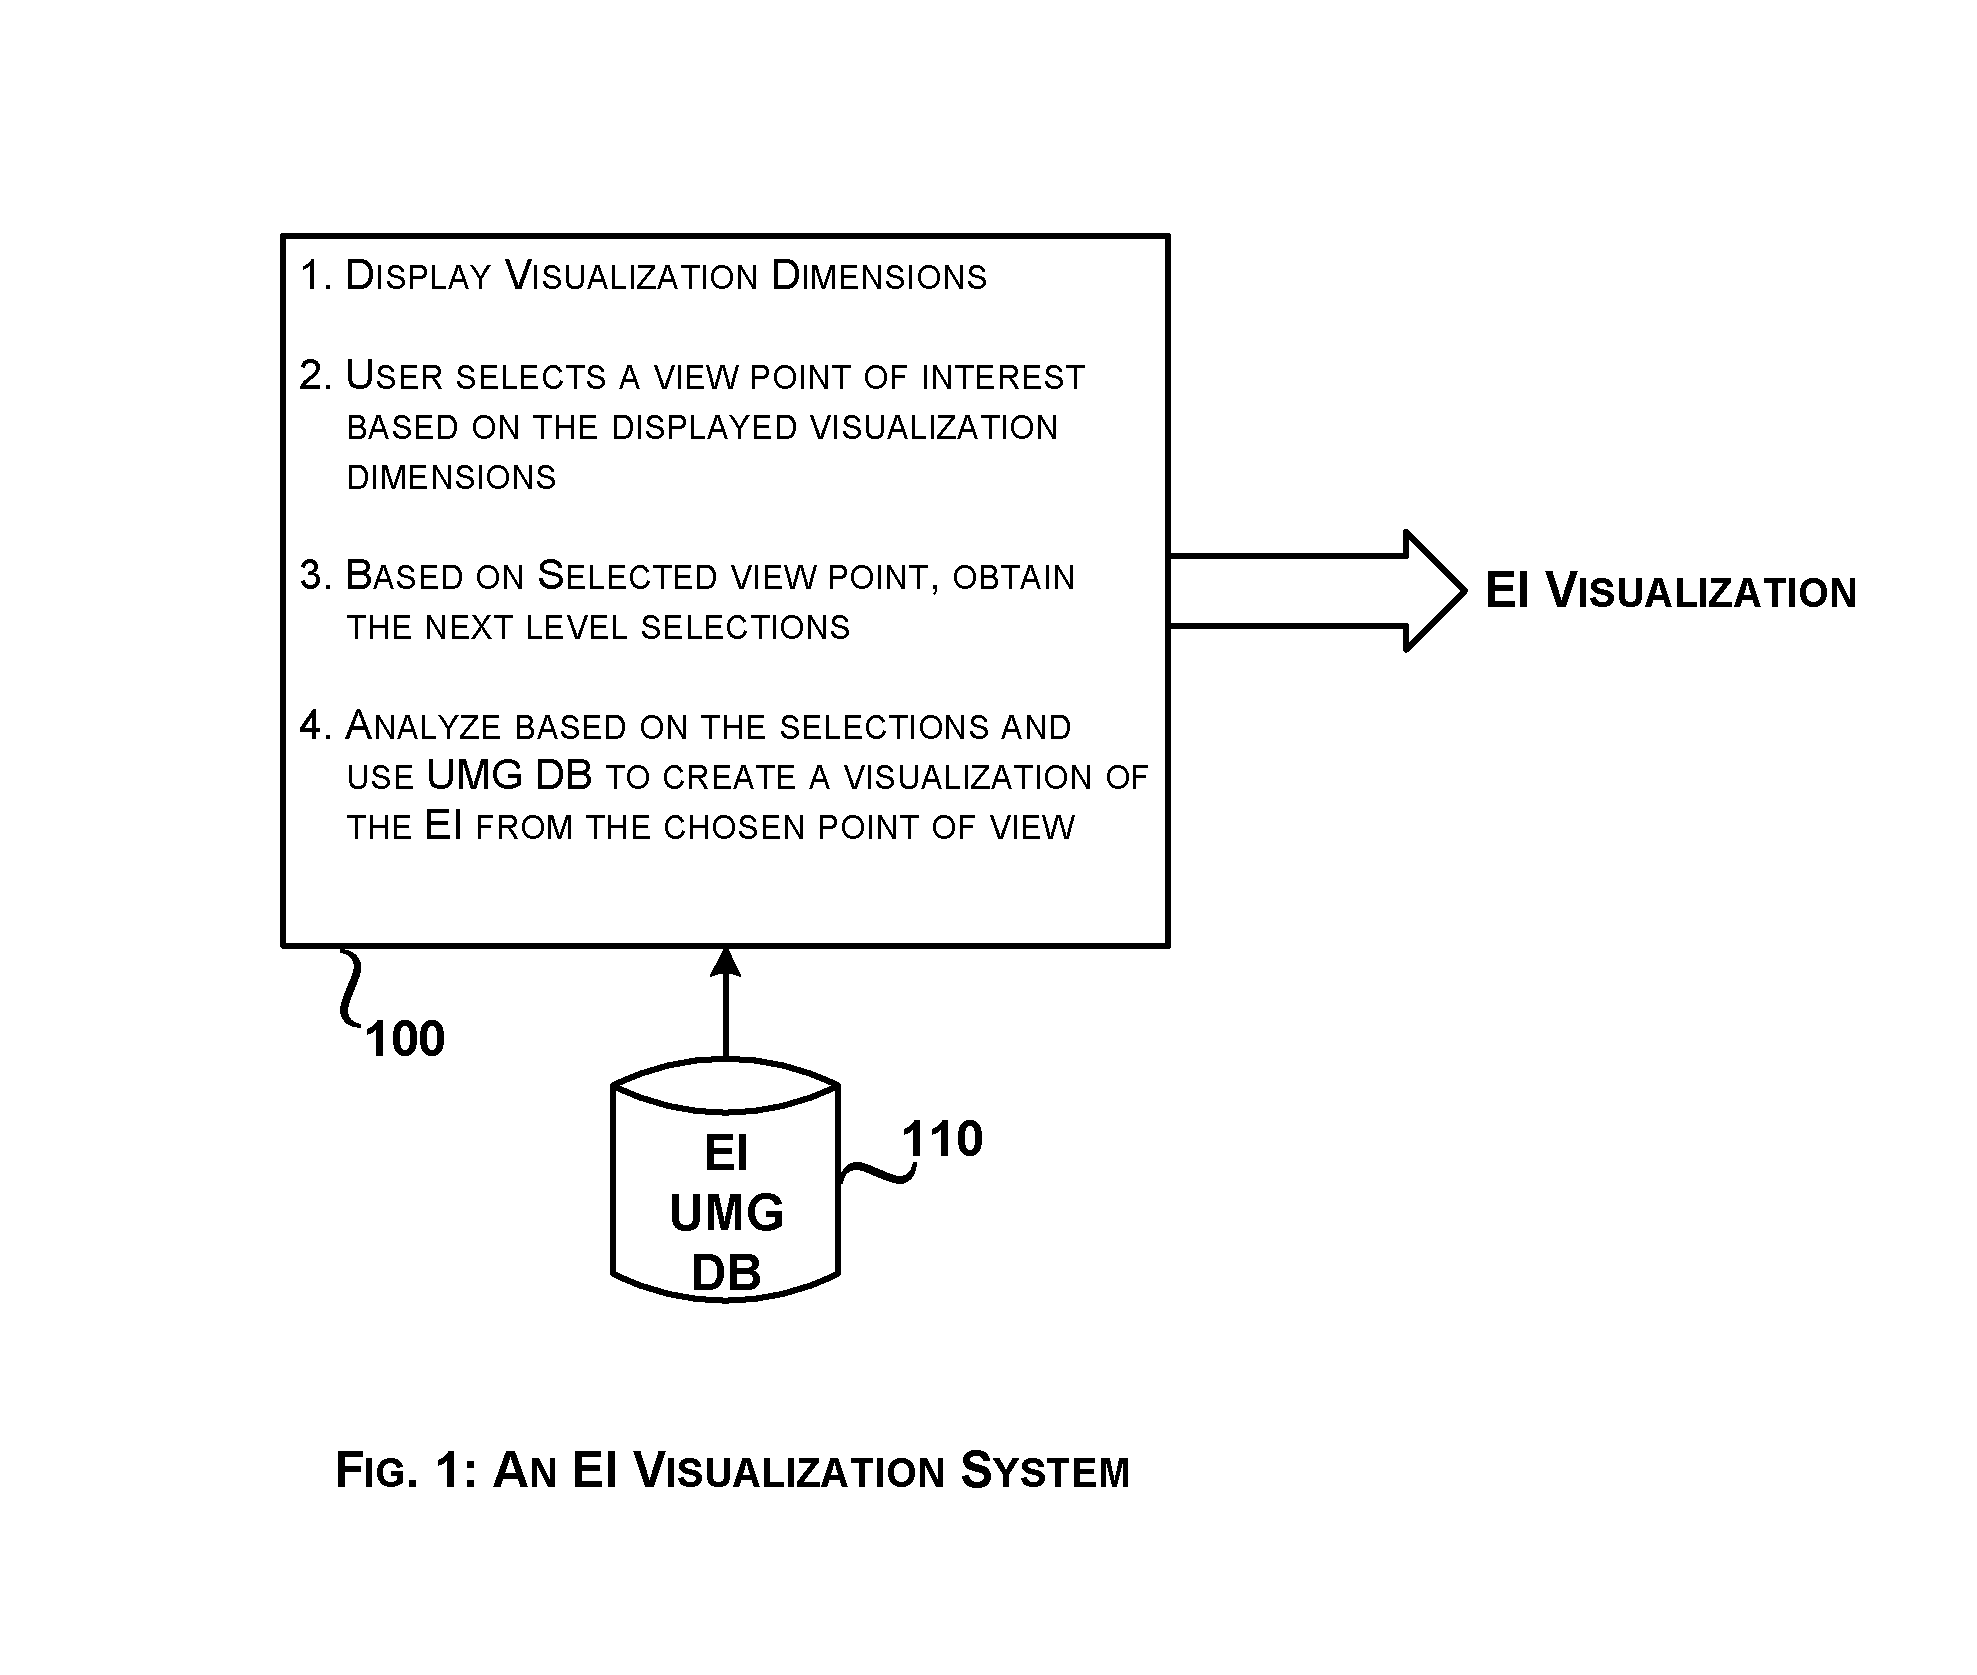
[0079]FIG. 1 depicts an overview of EI Visualization System. The main steps (100) are to select a view point of interest to a user so that University Model Graph (UMG) Database (DB) (110) of a university is analyzed from the selected view point to create the view point visualization. Note that, in the sequel, “university” and “educational institution” are used interchangeably. UMG database comprises of a university model graph associated with the university that is a structural representation of the information about the educational institution.

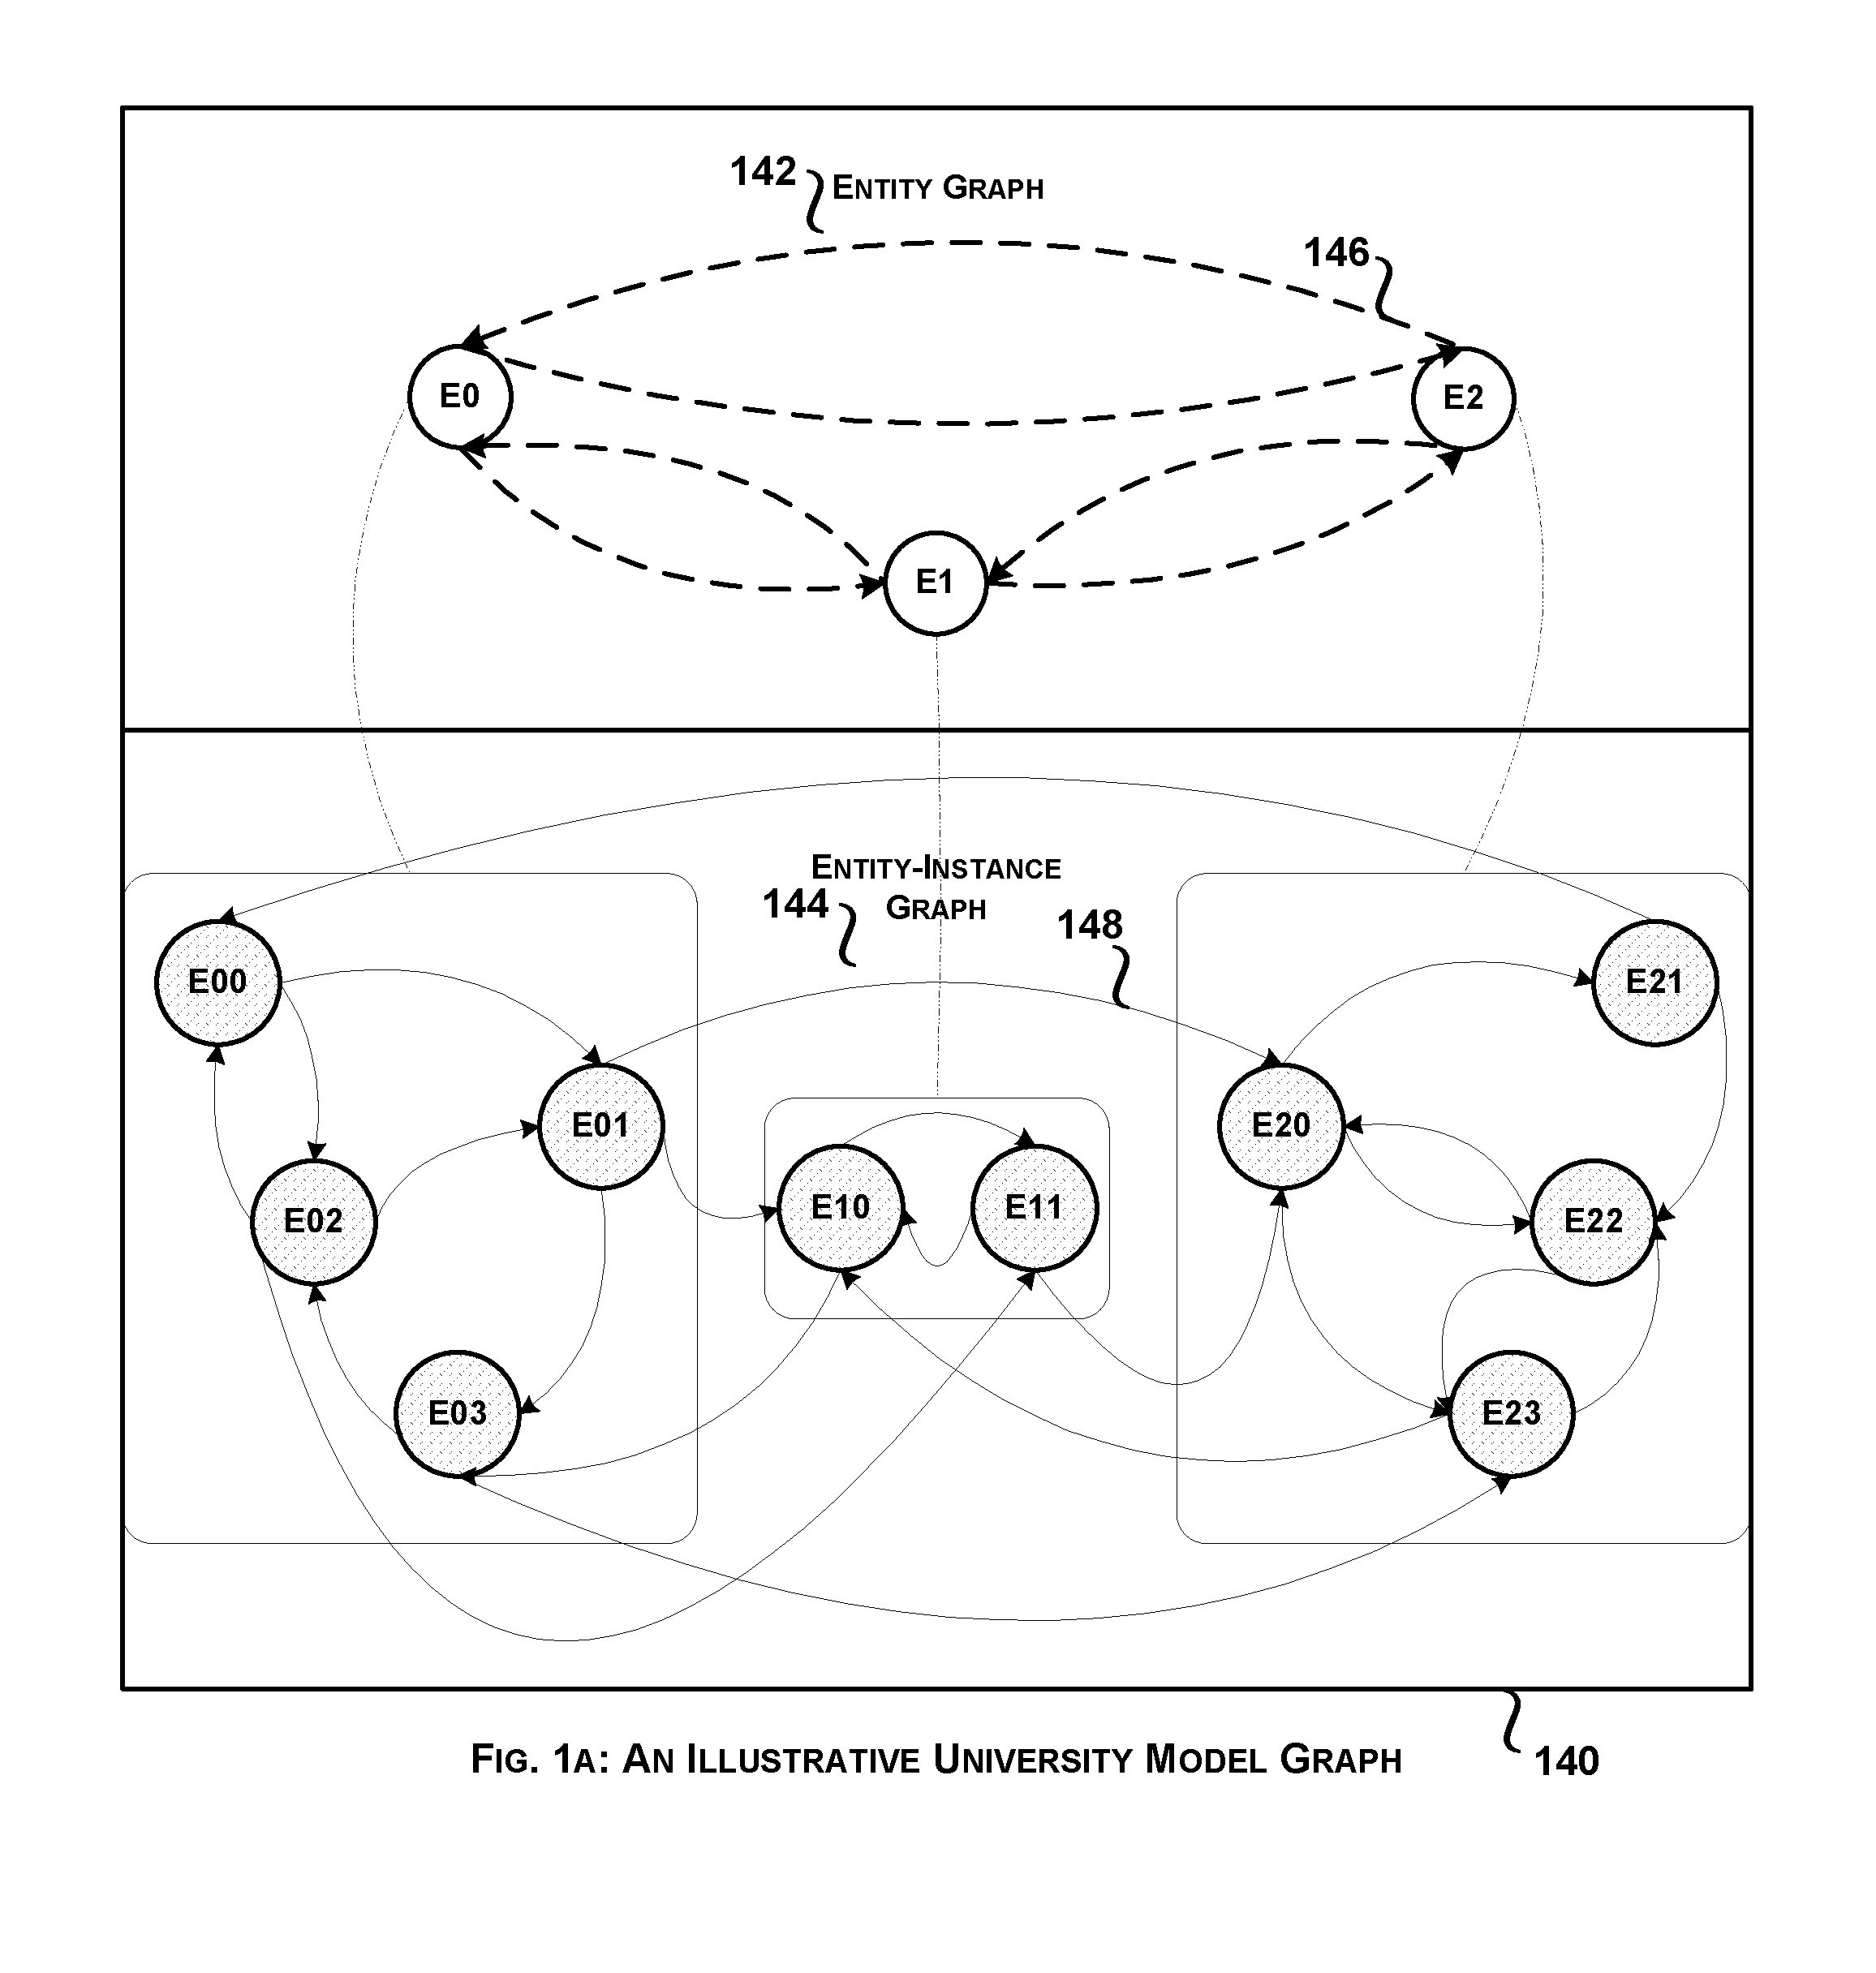
[0080]FIG. 1a depicts an illustrative University Model Graph. 140 describes UMG as consisting of two main components: Entity Graph (142) and Entity-Instance Graph (144). Entity graph consists of entities of the university as its nodes and an abstract edge (146) or abstract link is a directed edge that connects two entities of the entity graph. Note that edge and link are used interchangeably. The weight associated with this abstract edge is t...


PUM


Abstract

An educational institution (also referred as a university) is rich with multiple kinds of data: students, faculty members, departments, divisions, and at university level. A structural representation that captures the essence of all of the relationships in a unified manner has concise information about the educational institution, and visualization is a way to bring out all this information in an explicit manner so that the various of the users of the educational institution system understand effectively their system. A system and method for visualization based on the structural representation of a university along a variety of dimensions is discussed.

Description

[0001]1. A reference is made to the applicants' earlier Indian patent application titled “System and Method for an Influence based Structural Analysis of a University” with the application number 1269 / CHE2010 filed on 6 May 2010.[0002]2. A reference is made to another of the applicants' earlier Indian patent application titled “System and Method for Constructing a University Model Graph” that is under filing process and the application number and the filing date are yet to obtained.FIELD OF THE INVENTION[0003]The present invention relates to the visualization of the information about a university in general, and more particularly, visualization of the university based on the structural representations. Still more particularly, the present invention relates to a system and method for multiple multi-dimensions based visualization of a model graph associated with the university.BACKGROUND OF THE INVENTION[0004]An Educational Institution (EI) (also referred as university) comprises of a...

Claims


Application Information

Patent Timeline
IPC IPC(8): G06Q50/20G06Q10/06
CPCG06Q10/00G06Q10/06398G06Q50/20
Inventor VARADARAJAN, SRIDHARGOPALAN, SRIVIDYAIYER, PREETHY
Owner SRM INST OF SCI & TECH
Learn More