
Systems and methods for metric data smoothing

a technology of metric data and smoothing, applied in the field of data analysis, can solve the problems of insufficient methods of analysis of large multidimensional datasets, insufficient computational efficiency, and clustering of instruments that are often too blunt to identify important relationships

Active Publication Date: 2015-05-07
SYMPHONYAI SENSA LLC
View PDF22 Cites 36 Cited by
  • Summary
  • Abstract
  • Description
  • Claims
  • Application Information

AI Technical Summary

Benefits of technology

The patent describes a method for smoothing data by using a matrix and a set of text segments. The method involves receiving a matrix for a set of documents, adjusting the frequency value of a second column of the matrix based on the frequency value of a first column, and projecting each frequency value of the matrix into a reference space. The method also involves identifying subsets of the reference space, clustering the documents based on the projection values in those subsets, and generating a graph of nodes. The technical effects of this method include improved data smoothing, improved document analysis, and improved visualization of data.

Problems solved by technology

Unfortunately, previous methods of analysis of large multidimensional datasets tend to be insufficient (if possible at all) to identify important relationships and may be computationally inefficient.
Clustering is often too blunt an instrument to identify important relationships in the data.
Similarly, previous methods of linear regression, projection pursuit, principal component analysis, and multidimensional scaling often do not reveal important relationships.
Existing linear algebraic and analytic methods are too sensitive to large scale distances and, as a result, lose detail.
Further, even if the data is analyzed, sophisticated experts are often necessary to interpret and understand the output of previous methods.
Although some previous methods allow graphs depicting some relationships in the data, the graphs are not interactive and require considerable time for a team of such experts to understand the relationships.
Further, the output of previous methods does not allow for exploratory data analysis where the analysis can be quickly modified to discover new relationships.

Method used


Image

  • Systems and methods for metric data smoothing
  • Systems and methods for metric data smoothing
  • Systems and methods for metric data smoothing

Examples


Embodiment Construction

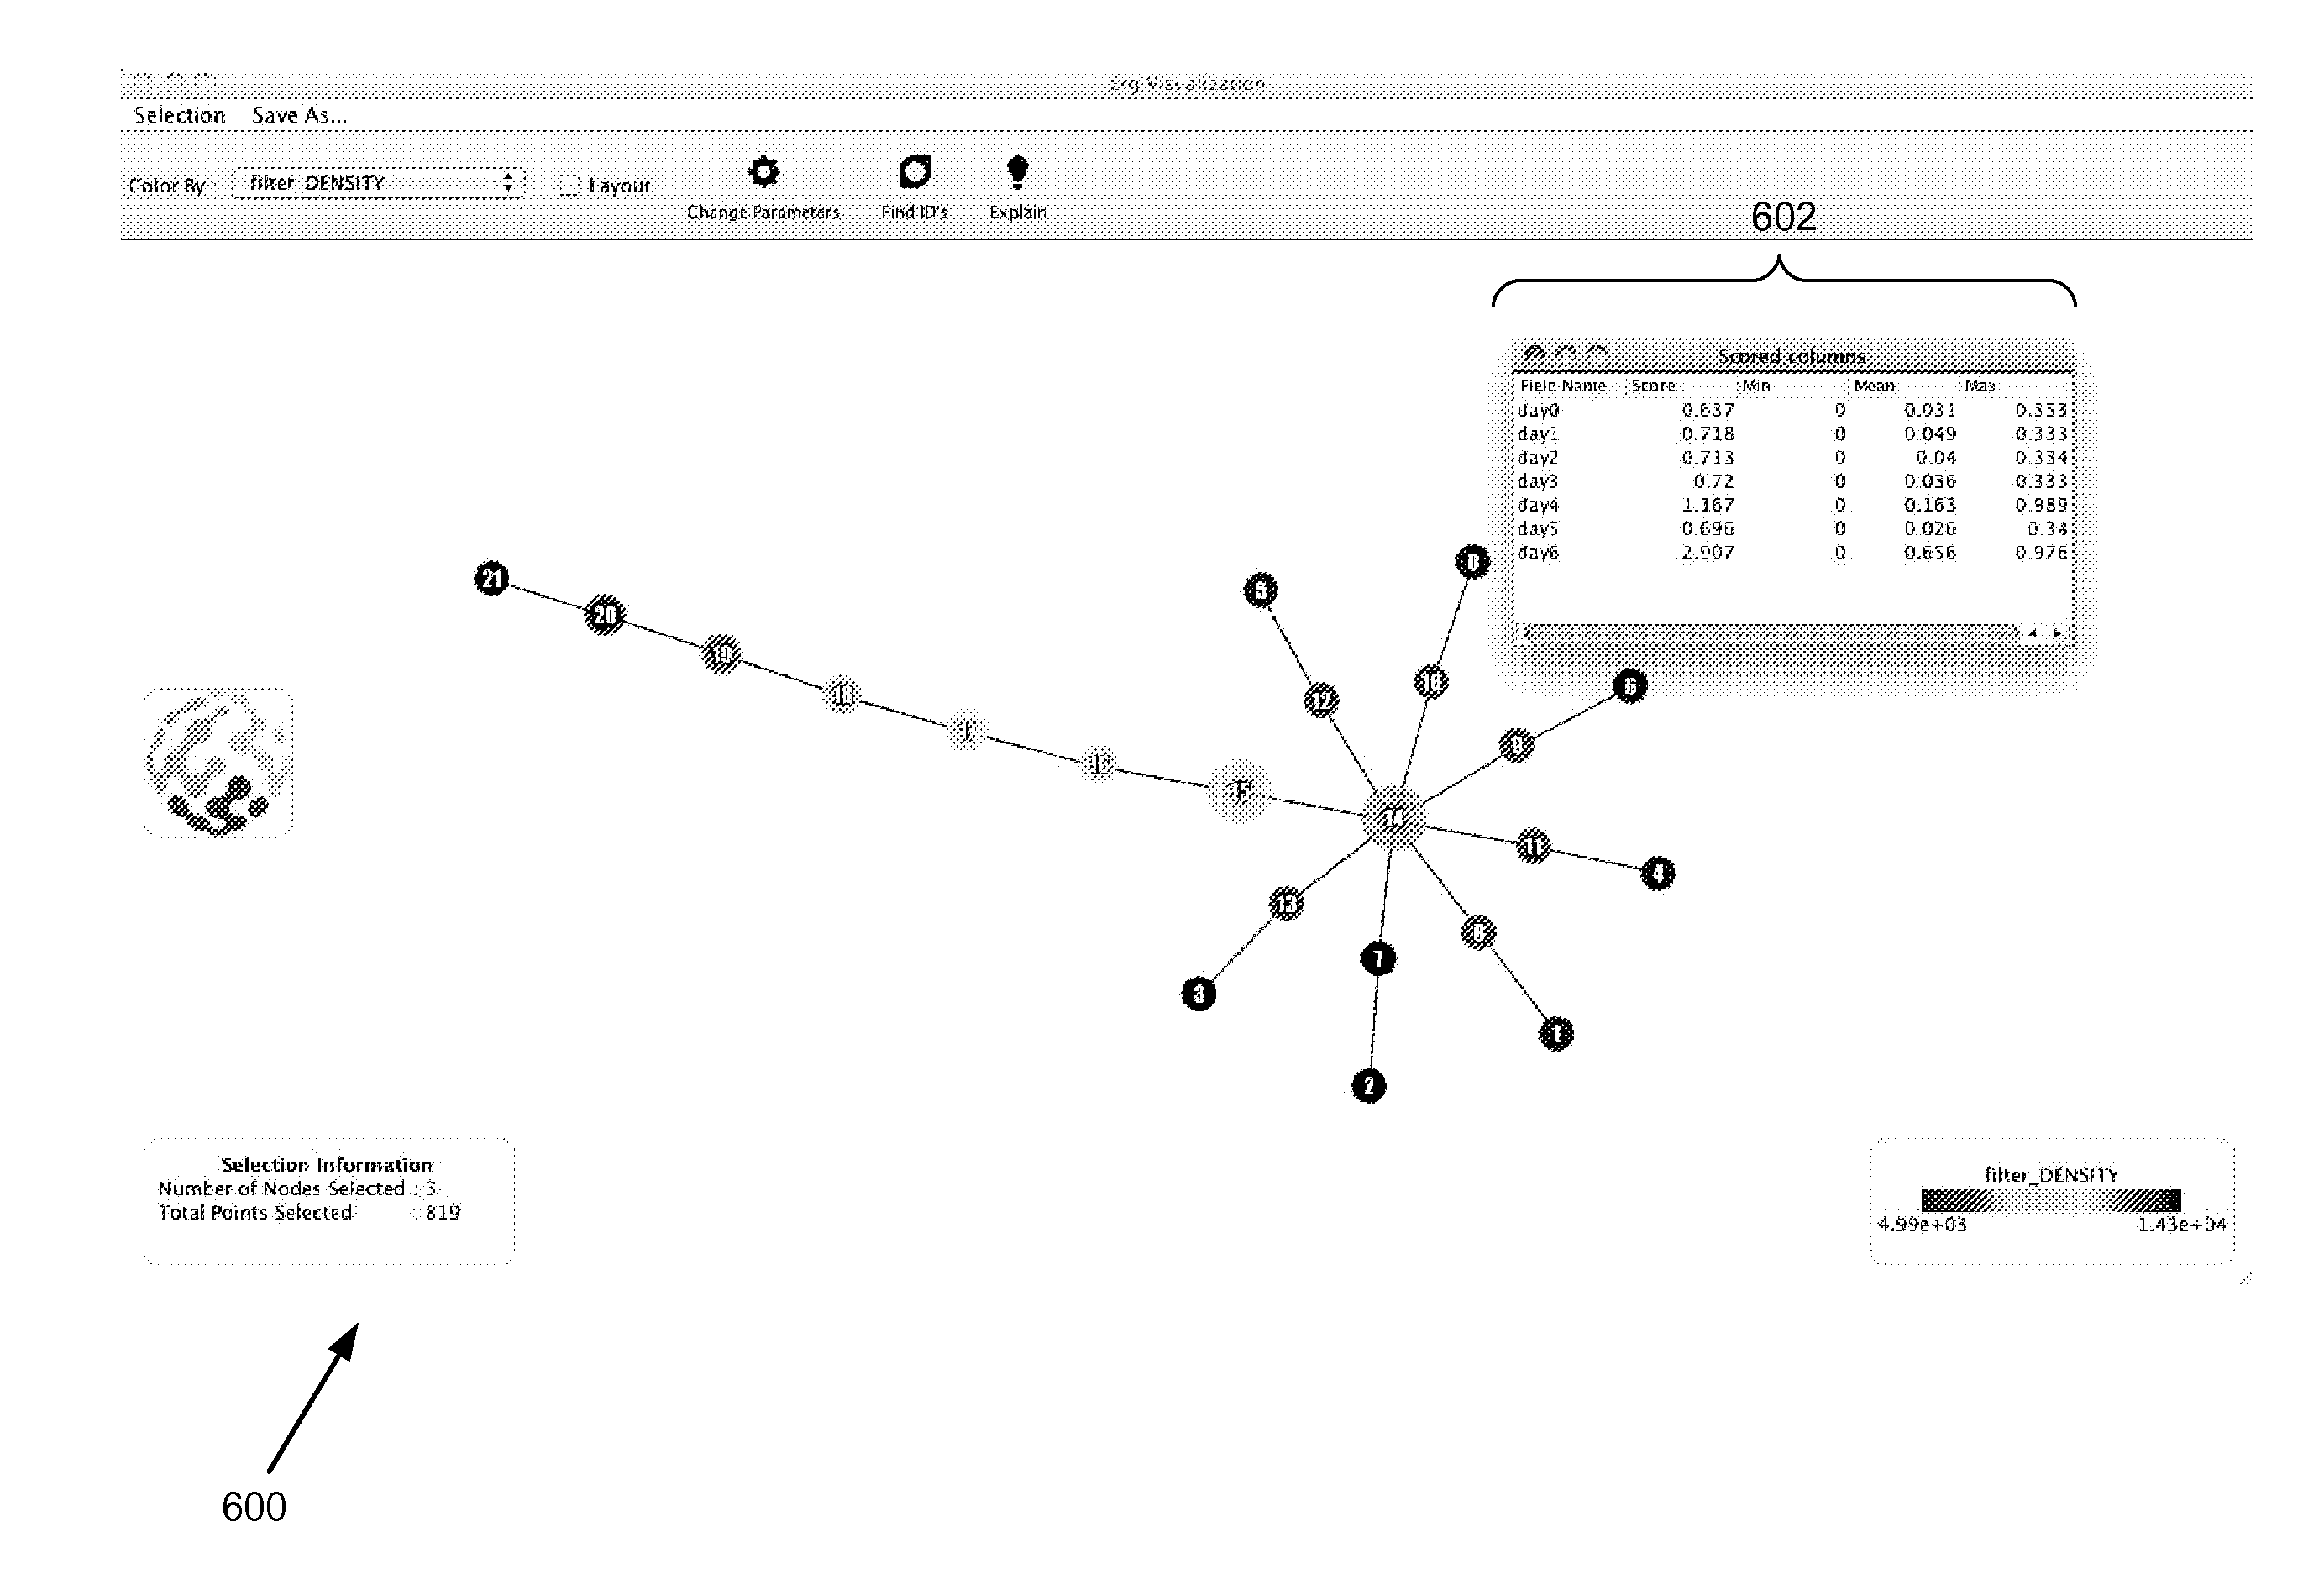
[0042]Various embodiments described herein are described as part of data analytics using Topological Data Analysis (TDA). Those skilled in the art will appreciate that many different data analytic approaches, not just TDA, may be used in some or all of the embodiments described herein.

[0043]Generally, TDA is an area of research which had been developed over the past decade and a half, and has produced methods for studying point cloud data sets from a geometric point of view. Data is analyzed by approximation via models of various types. For example, regression methods may be used to model data as the graph of a function in one or more variables. Certain qualitative properties may be of a great deal of importance for understanding the data, however, these features may not be readily represented within such a model.

[0044]Data may be depicted using an approach with TDA. In one example, a visualization (e.g., a graph) of the data using approaches in TDA may depict the data as being divi...


PUM


Abstract

An exemplary method may comprise receiving a matrix for a set of documents, each cell of the matrix including a frequency value indicating a number of instances of a corresponding text segment in a corresponding document, receiving an indication of a relationship between two text segments, each of the two text segments associated with a first column and a second column, respectively, of the matrix, adjusting, for each document, a frequency value of the second column based on the frequency value of the first column, projecting each frequency value into a reference space to generate a set of projection values, identifying a plurality of subsets of the reference space, clustering, for each subset of the plurality of subsets, at least some documents that correspond to projection values, and generating a graph of nodes, each of the nodes identifying one or more of the documents corresponding to each cluster.

Description

CROSS REFERENCE TO RELATED APPLICATIONS[0001]This application seeks priority to U.S. provisional application Ser. No. 61 / 899,786, entitled “Transforming Data, Metrics, and Lenses with Auxiliary Information,” filed Nov. 4, 2013, which is hereby incorporated by reference herein.BACKGROUND[0002]1. Field of the Invention[0003]Embodiments of the present invention are directed data analysis and more particularly to smoothing of data for analysis.[0004]2. Related Art[0005]As the collection and storage data has increased, there is an increased need to analyze and make sense of large amounts of data. Examples of large datasets may be found in financial services companies, oil expiration, biotech, and academia. Unfortunately, previous methods of analysis of large multidimensional datasets tend to be insufficient (if possible at all) to identify important relationships and may be computationally inefficient.[0006]In one example, previous methods of analysis often use clustering. Clustering is ...

Claims


Application Information

Patent Timeline
Patent Type & Authority Applications(United States)
IPC IPC(8): G06F17/30
CPCG06F17/30598G06F17/30011G06F16/3334G06F16/93
Inventor CARLSSON, GUNNARBAK, ANTHONYKLOKE, JENNIFERMANN, BENJAMINSEXTON, HARLAN
Owner SYMPHONYAI SENSA LLC
Learn More