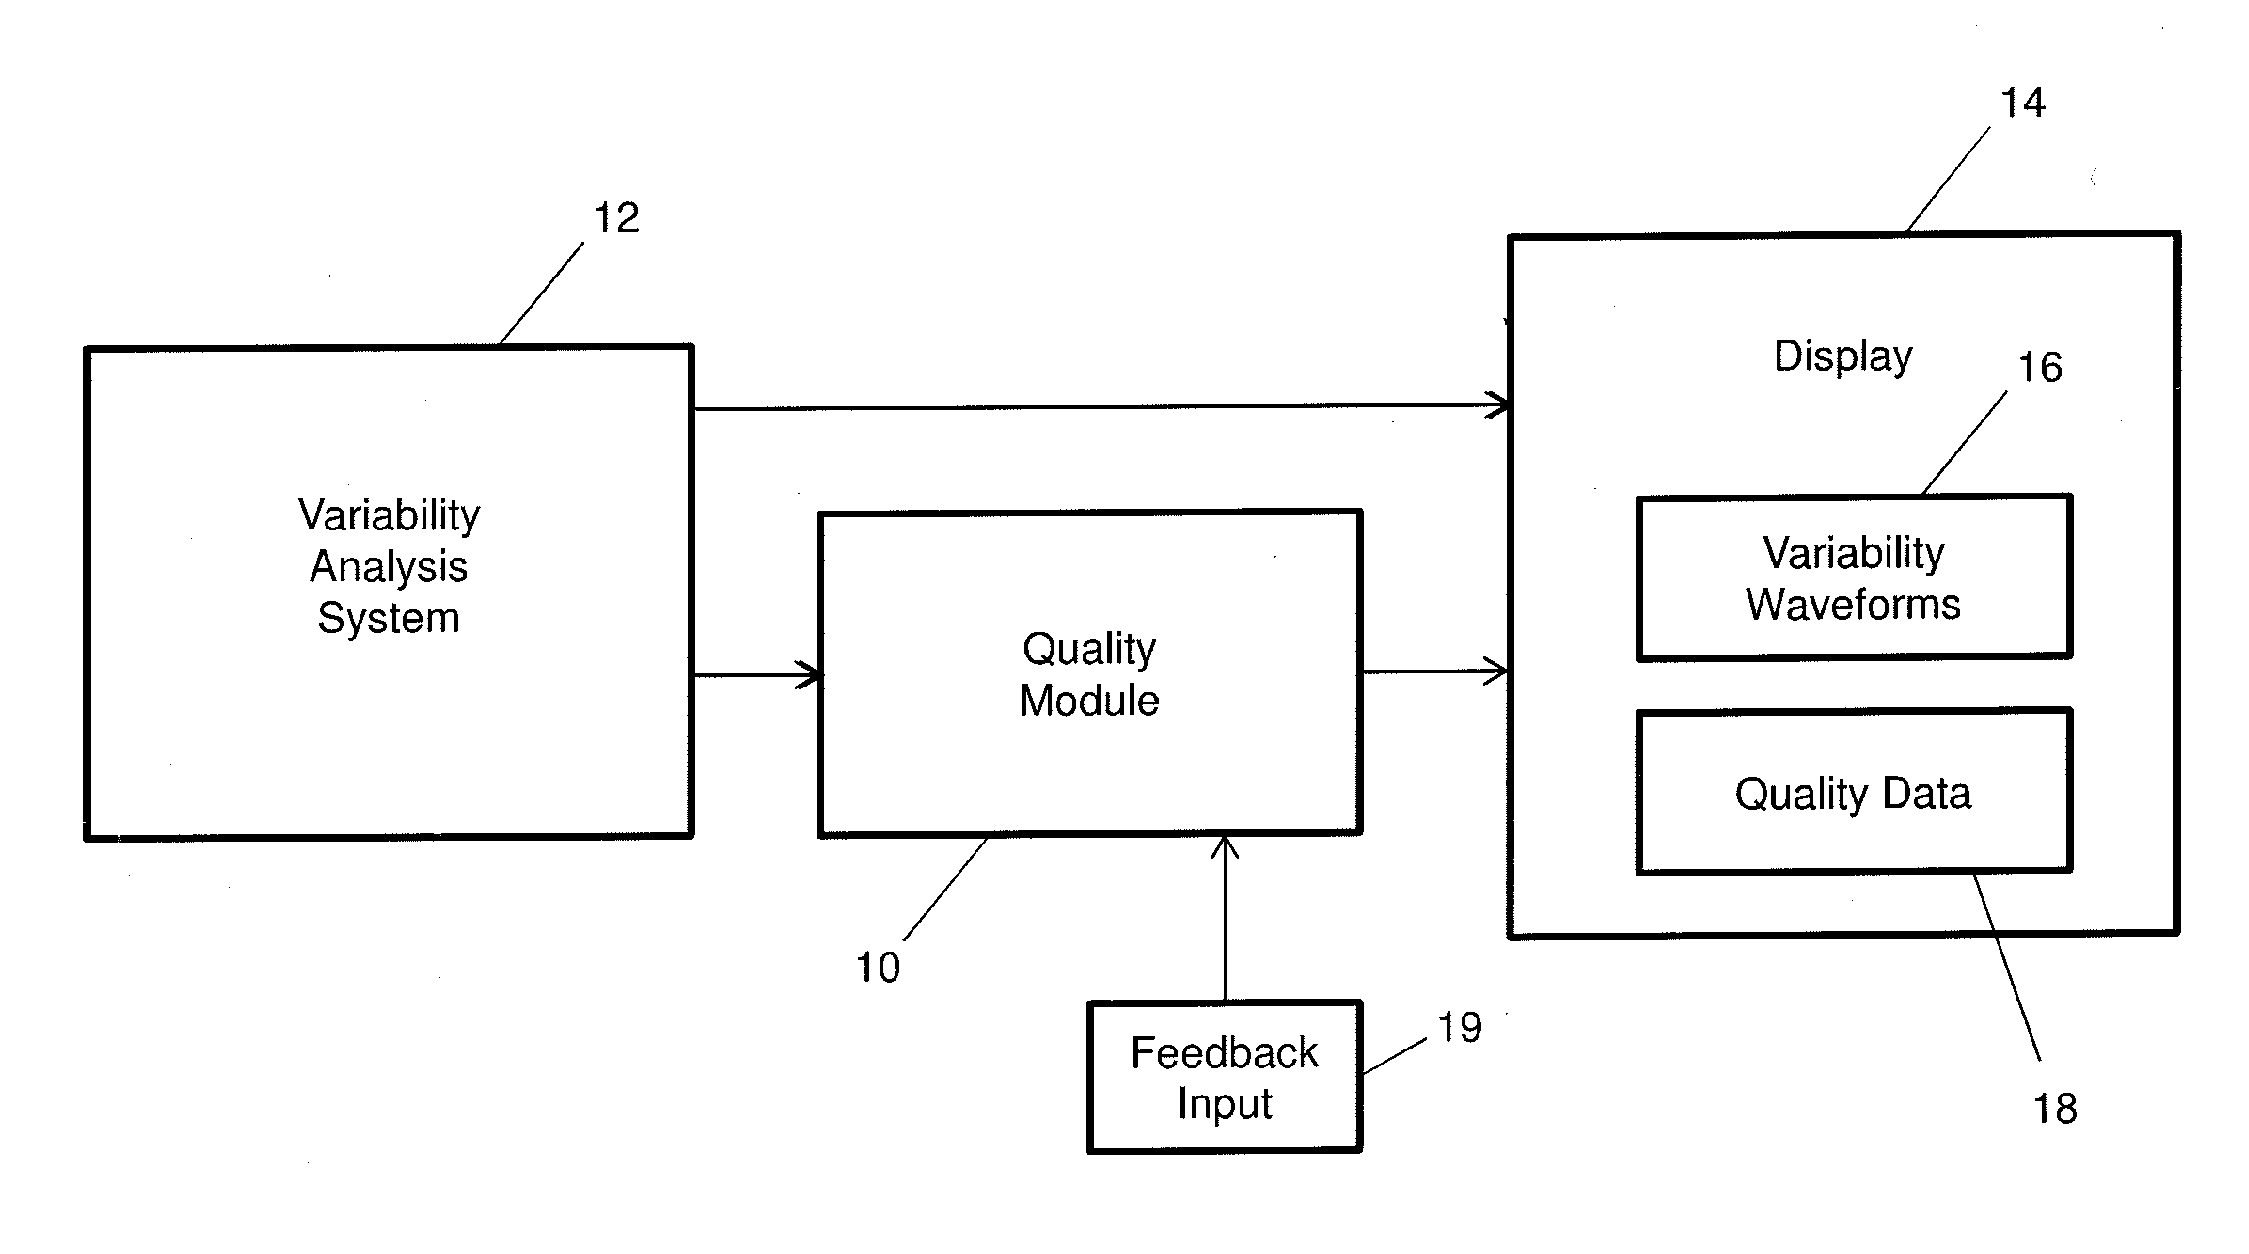
Method for Multi-Scale Quality Assessment for Variability Analysis

a quality assessment and multi-scale technology, applied in the field of performing quality assessments for variability analyses, can solve problems such as relying on visual inspection

Inactive Publication Date: 2015-06-18
OTTAWA HOSPITAL RES INST +2
View PDF7 Cites 12 Cited by
  • Summary
  • Abstract
  • Description
  • Claims
  • Application Information

AI Technical Summary

Problems solved by technology

The challenge is shifting from data availability towards data quality: i.e., removing noise and artifacts and finding relevant information within the surplus of available data.
It has also been found that there is a need to measure the quality of the data presented to the clinician in an automated and reliable fashion since relying on a visual inspection of waveform is typically insufficient.

Method used


Image

  • Method for Multi-Scale Quality Assessment for Variability Analysis
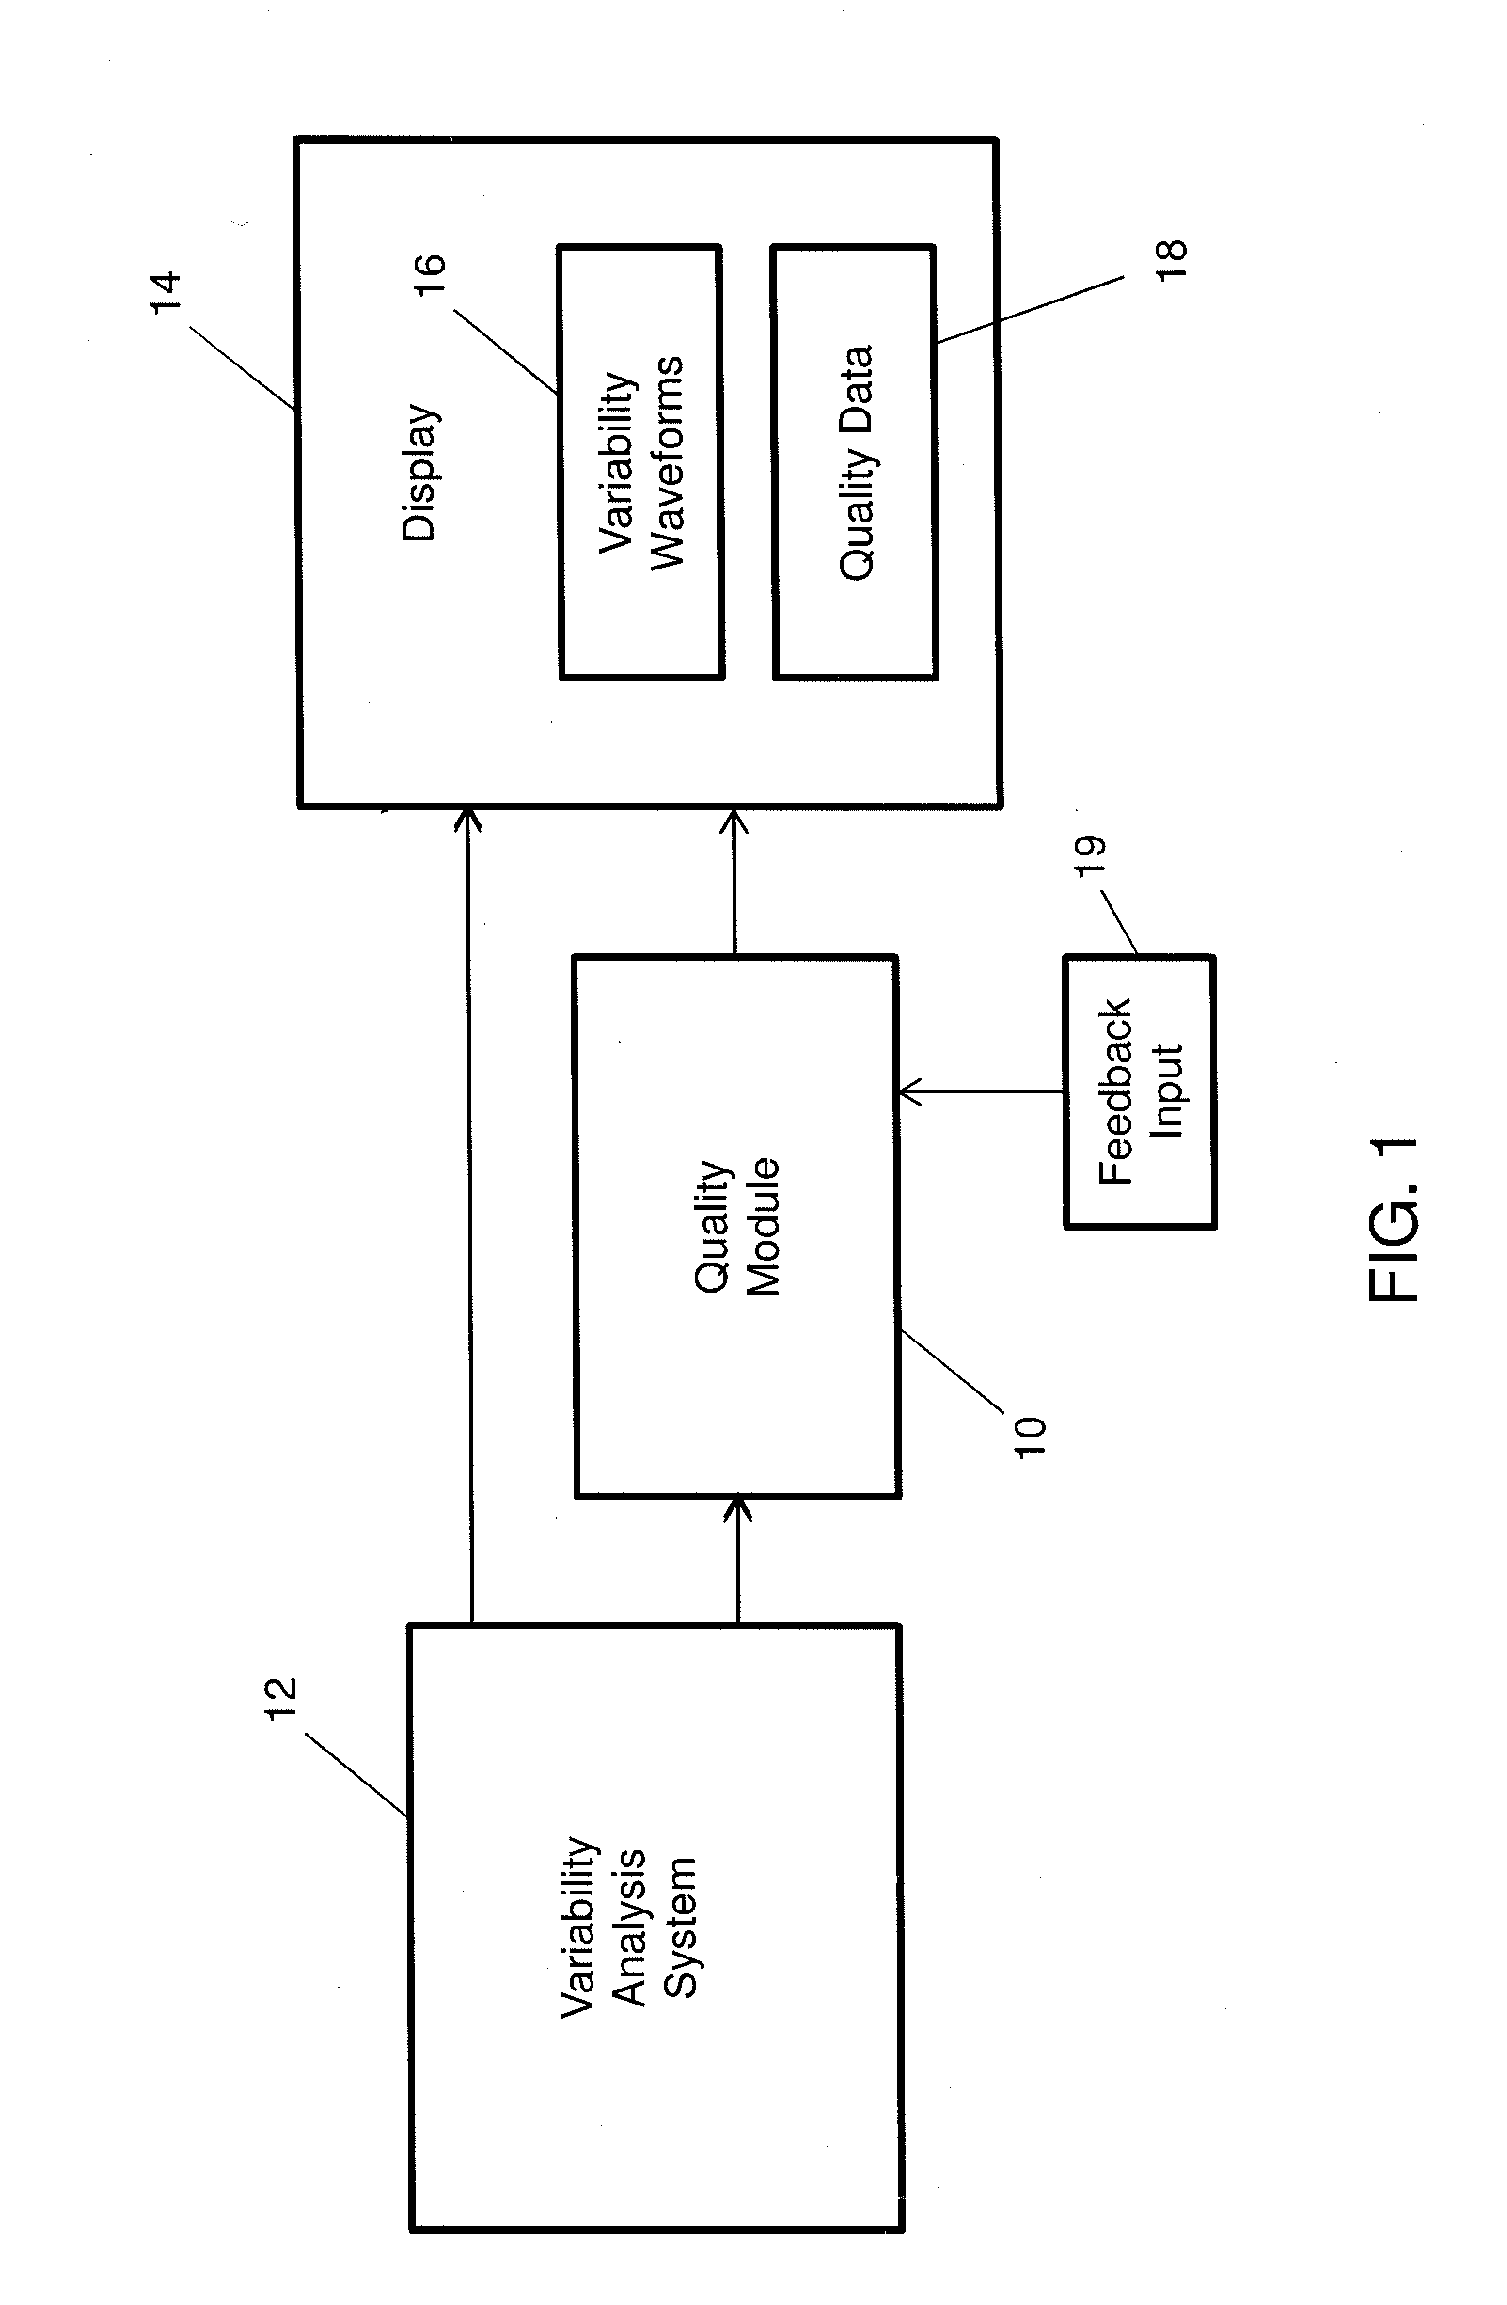
  • Method for Multi-Scale Quality Assessment for Variability Analysis
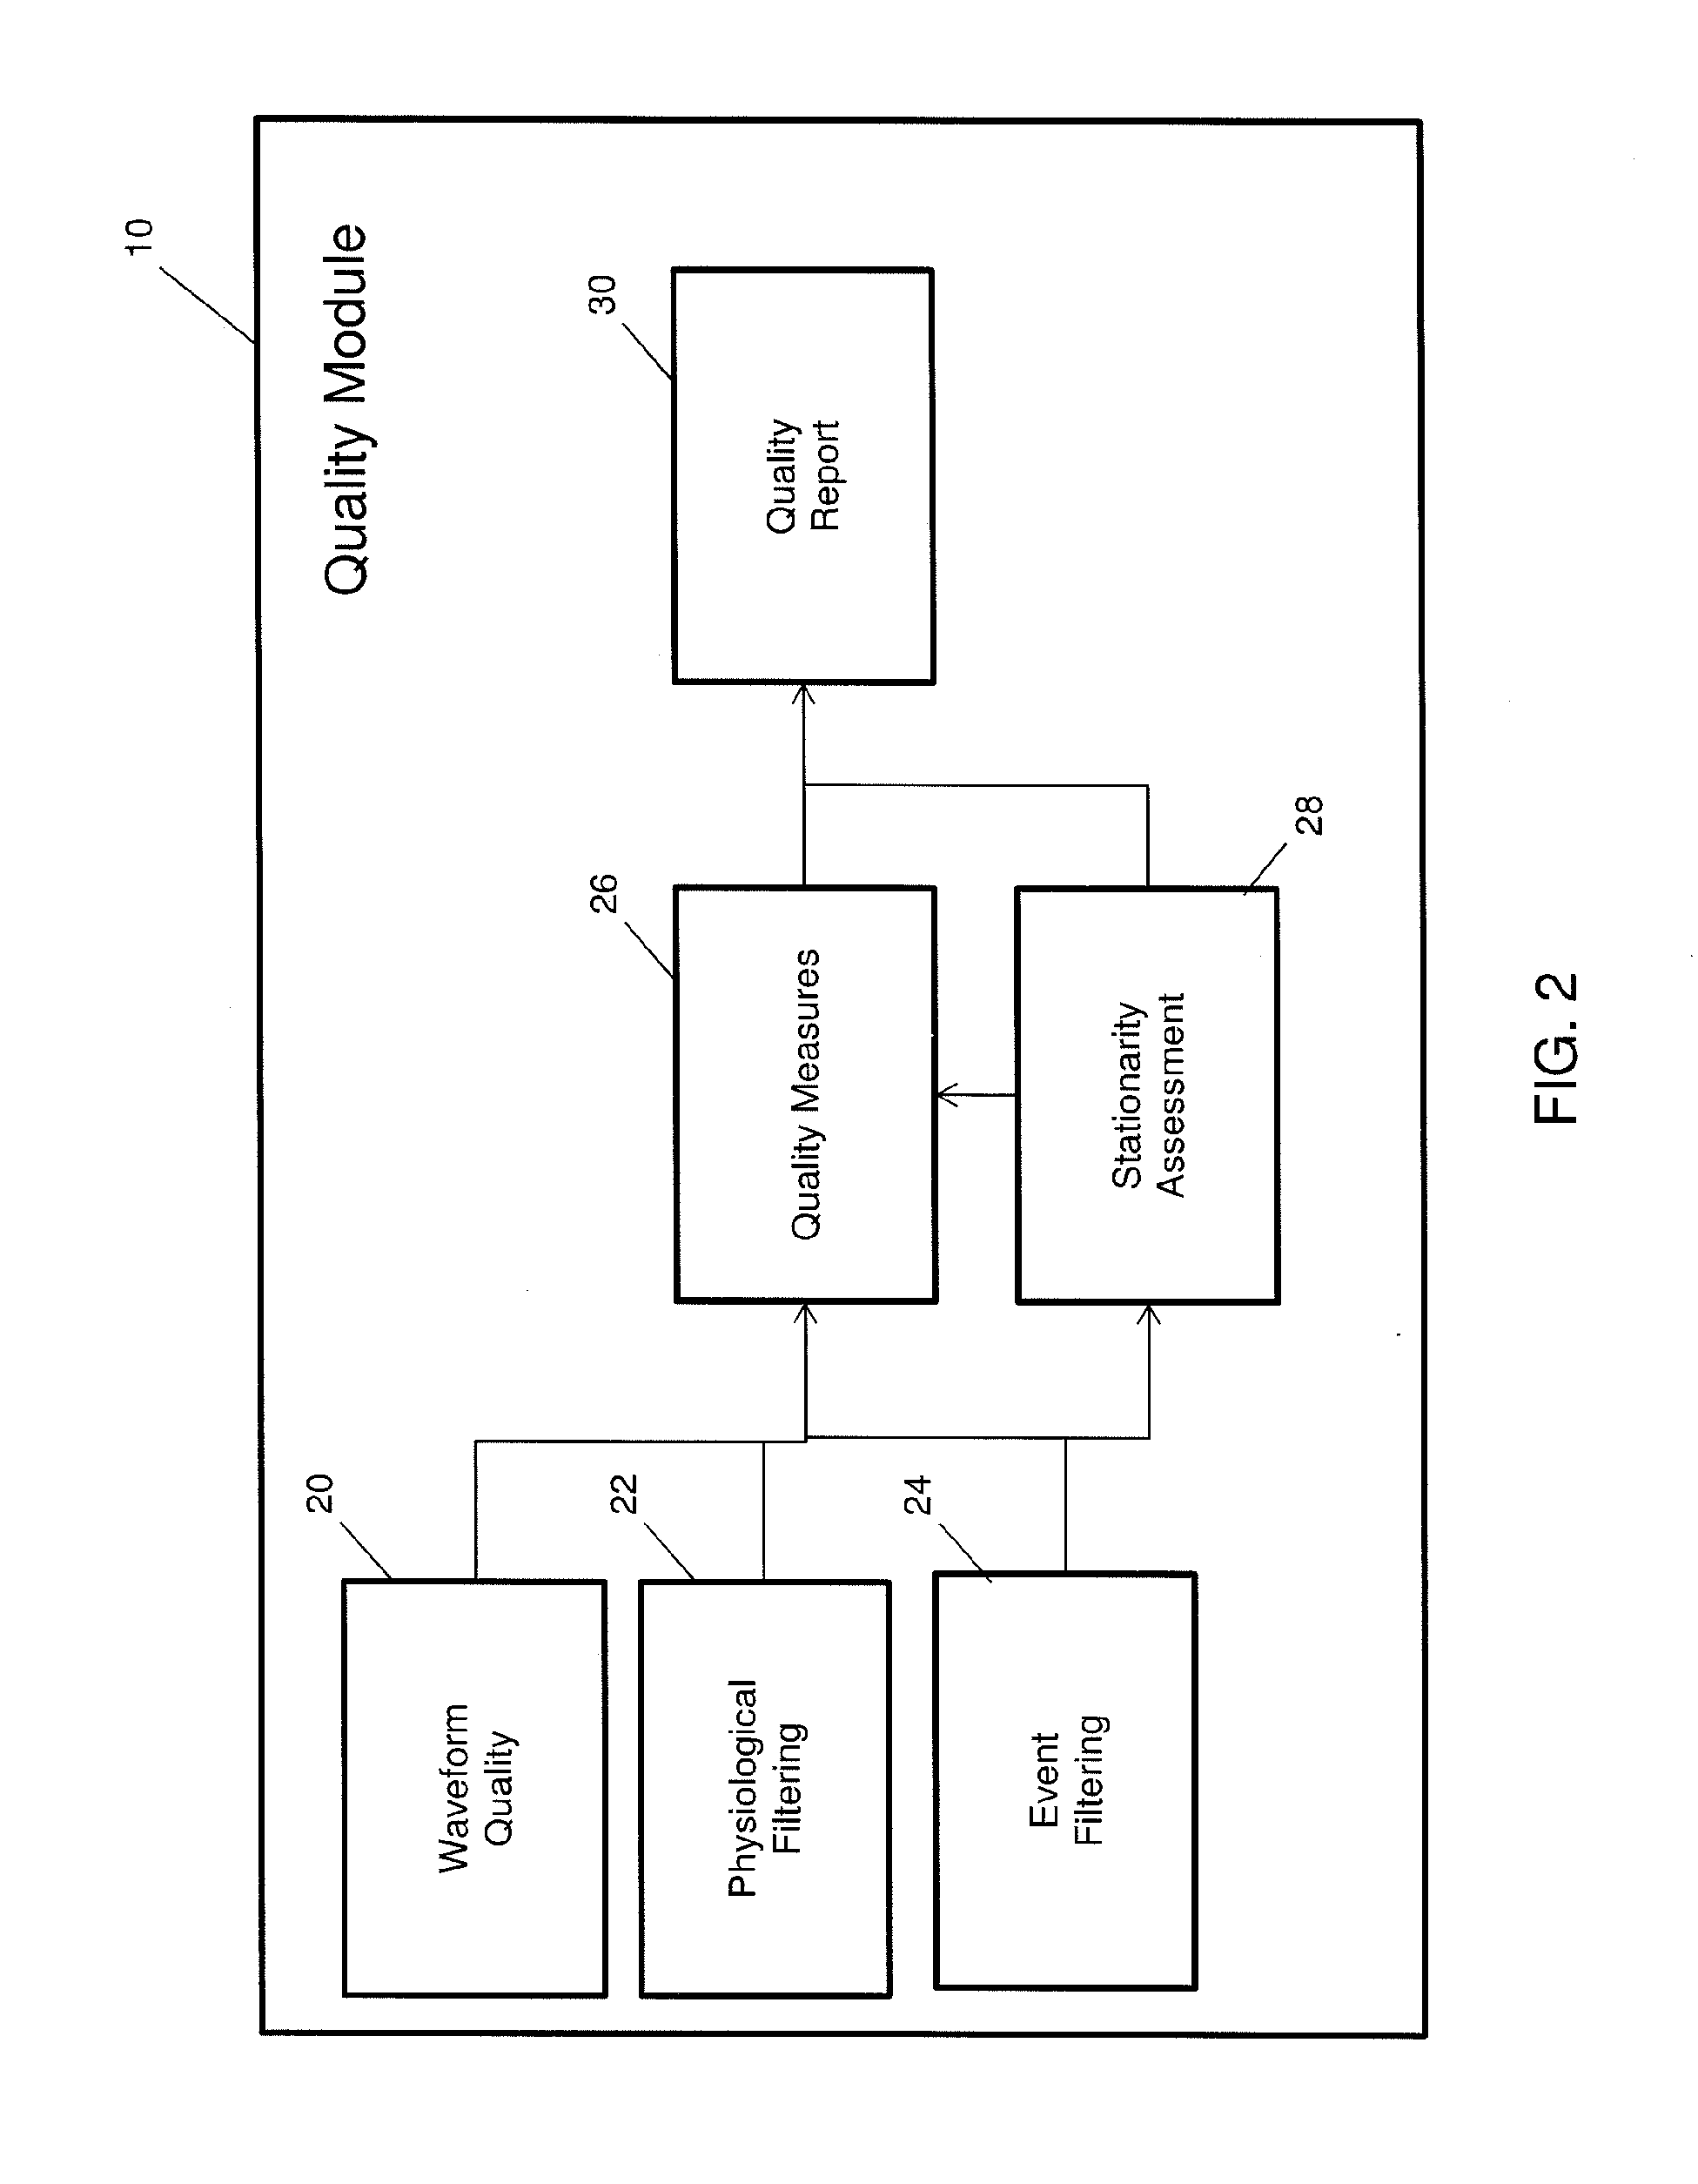
  • Method for Multi-Scale Quality Assessment for Variability Analysis

Examples


examples and embodiments

[0053]An example of a quality assessment for the purpose of variability monitoring is now provided.

A—Method to Assess Waveform Quality for Variability Analysis:

[0054]i) The assessment diagrammed in FIG. 3 may be applied to any physiological waveforms including sets of multi organ waveforms 32 such as the ECG and capnography waveforms 32. The waveforms 32 may be acquired as stored waveforms 32 in a database or directly from patient monitors as raw sensor data or processed waveforms. The transformation of a recorded physiological signal into a high quality event time series begins at the waveform level. The waveform quality stage 20 shown in FIG. 3 comprises a threefold process to ascertain the useable portions of the waveform 32.

[0055]ii) The analysis of the waveform quality 20 can comprise an analysis for a) disconnections; data segments identified as being outside monitor range (i.e. negative value on a breathing rate monitor), b) saturations in the signal and gross amplitude chang...


PUM


Abstract

A system and method are provided for assessing quality for a variability analysis. The method comprises: obtaining at least one waveform corresponding to a corresponding physiological measurement; determining at least one measure of waveform quality of the at least one waveform; extracting from a waveform, at least one event time series; determining a measure of event time series quality of the at least one event time series; determining at least one measure of stationarity of the at least one event time series; computing a quality measure using the at least one measure of waveform quality and the at least one measure of stationarity; and displaying the quality measure.

Description

CROSS-REFERENCE TO RELATED APPLICATIONS[0001]This application is a continuation of PCT Application No. PCT / CA2013 / 050681 filed on Sep. 5, 2013, which claims priority to U.S. Provisional Application No. 61 / 697,075 filed on Sep. 5, 2012, both incorporated herein by reference.TECHNICAL FIELD[0002]The following relates to performing quality assessments for variability analyses.DESCRIPTION OF THE RELATED ART[0003]Physiological waveforms are now recorded at the bedside for the purposes of storage and analysis. This valuable data can be used for retrospective review, and can also be processed and used by display and decision support algorithms. The challenge is shifting from data availability towards data quality: i.e., removing noise and artifacts and finding relevant information within the surplus of available data. Computerized data collection systems now allow for the analysis of vast quantities of data. To ensure reliability and fidelity of results provided by the intersection of comp...

Claims


Application Information

Patent Timeline
Patent Type & Authority Applications(United States)
IPC IPC(8): A61B5/00G01R13/00A61B5/0452G01R29/26
CPCA61B5/7221G01R29/26A61B5/7282A61B5/0452G01R13/00G07C3/14A61B5/7235A61B5/002A61B5/01A61B5/021A61B5/02416A61B5/14542A61B5/4255A61B5/318A61B5/352A61B5/349
Inventor TOWNSEND, DAPHNE-ISABELLEHERRY, CHRISTOPHE L.BRAVI, ANDREAGREEN, GEOFFREY C.SEELY, ANDREW J.E.
Owner OTTAWA HOSPITAL RES INST
Why Eureka
Try Eureka