
Secure connections in an interactive analytic visualization infrastructure

Inactive Publication Date: 2016-11-03
ICHARTS LLC
View PDF10 Cites 28 Cited by
  • Summary
  • Abstract
  • Description
  • Claims
  • Application Information

AI Technical Summary

Benefits of technology

The patent describes a method and system for providing analytic visualization data to a container. The method involves receiving a data request from the container and identifying the data source. A data processing instruction is generated based on the data request and transmitted to a data server, which selects a subset of data from the source based on permission settings associated with the identifier. The processed data set is then received from the data server without any additional data, and a visualization update is generated based on the processed data set. The virtualization update is then transmitted to the container. This method facilitates efficient and secure data processing for annotating and visualizing data sources based on user permissions.

Problems solved by technology

Viewing and manipulating such data while the data is still arranged in spreadsheets, tables, databases, and other data structures can often be slow, difficult, unwieldy, and in some cases, entirely unmanageable.
One problem with manually exporting analytic visualizations through spreadsheet software as static images is that there is no easy way to update, filter, interact with, or manipulate those visualizations if they are embedded into a web portal or similar medium where a viewer might expect data to be updated and interactive.
A further problem is that charts with any form of update mechanism are not designed to access data in a secure manner.
Owners transfer large amounts of potentially sensitive data to third-party servers for processing, thereby giving rise to the possibility that the third party will sell or leak the data.
Any sensitive data on such third party servers is further vulnerable to malicious hackers or snooping governmental entities if the network connections are compromised via a man-in-the-middle attack or if the third party servers themselves are compromised.
Similar problems exist with respect to personalization based on viewer permissions.
Nor do presently available systems allow for viewer interactivity with charts that update based on viewer actions and viewer inputs from the viewer of the chart.
Accessing data from multiple sources is also a challenge, especially with respect to data security.

Method used


Image

  • Secure connections in an interactive analytic visualization infrastructure
  • Secure connections in an interactive analytic visualization infrastructure
  • Secure connections in an interactive analytic visualization infrastructure

Examples


Embodiment Construction

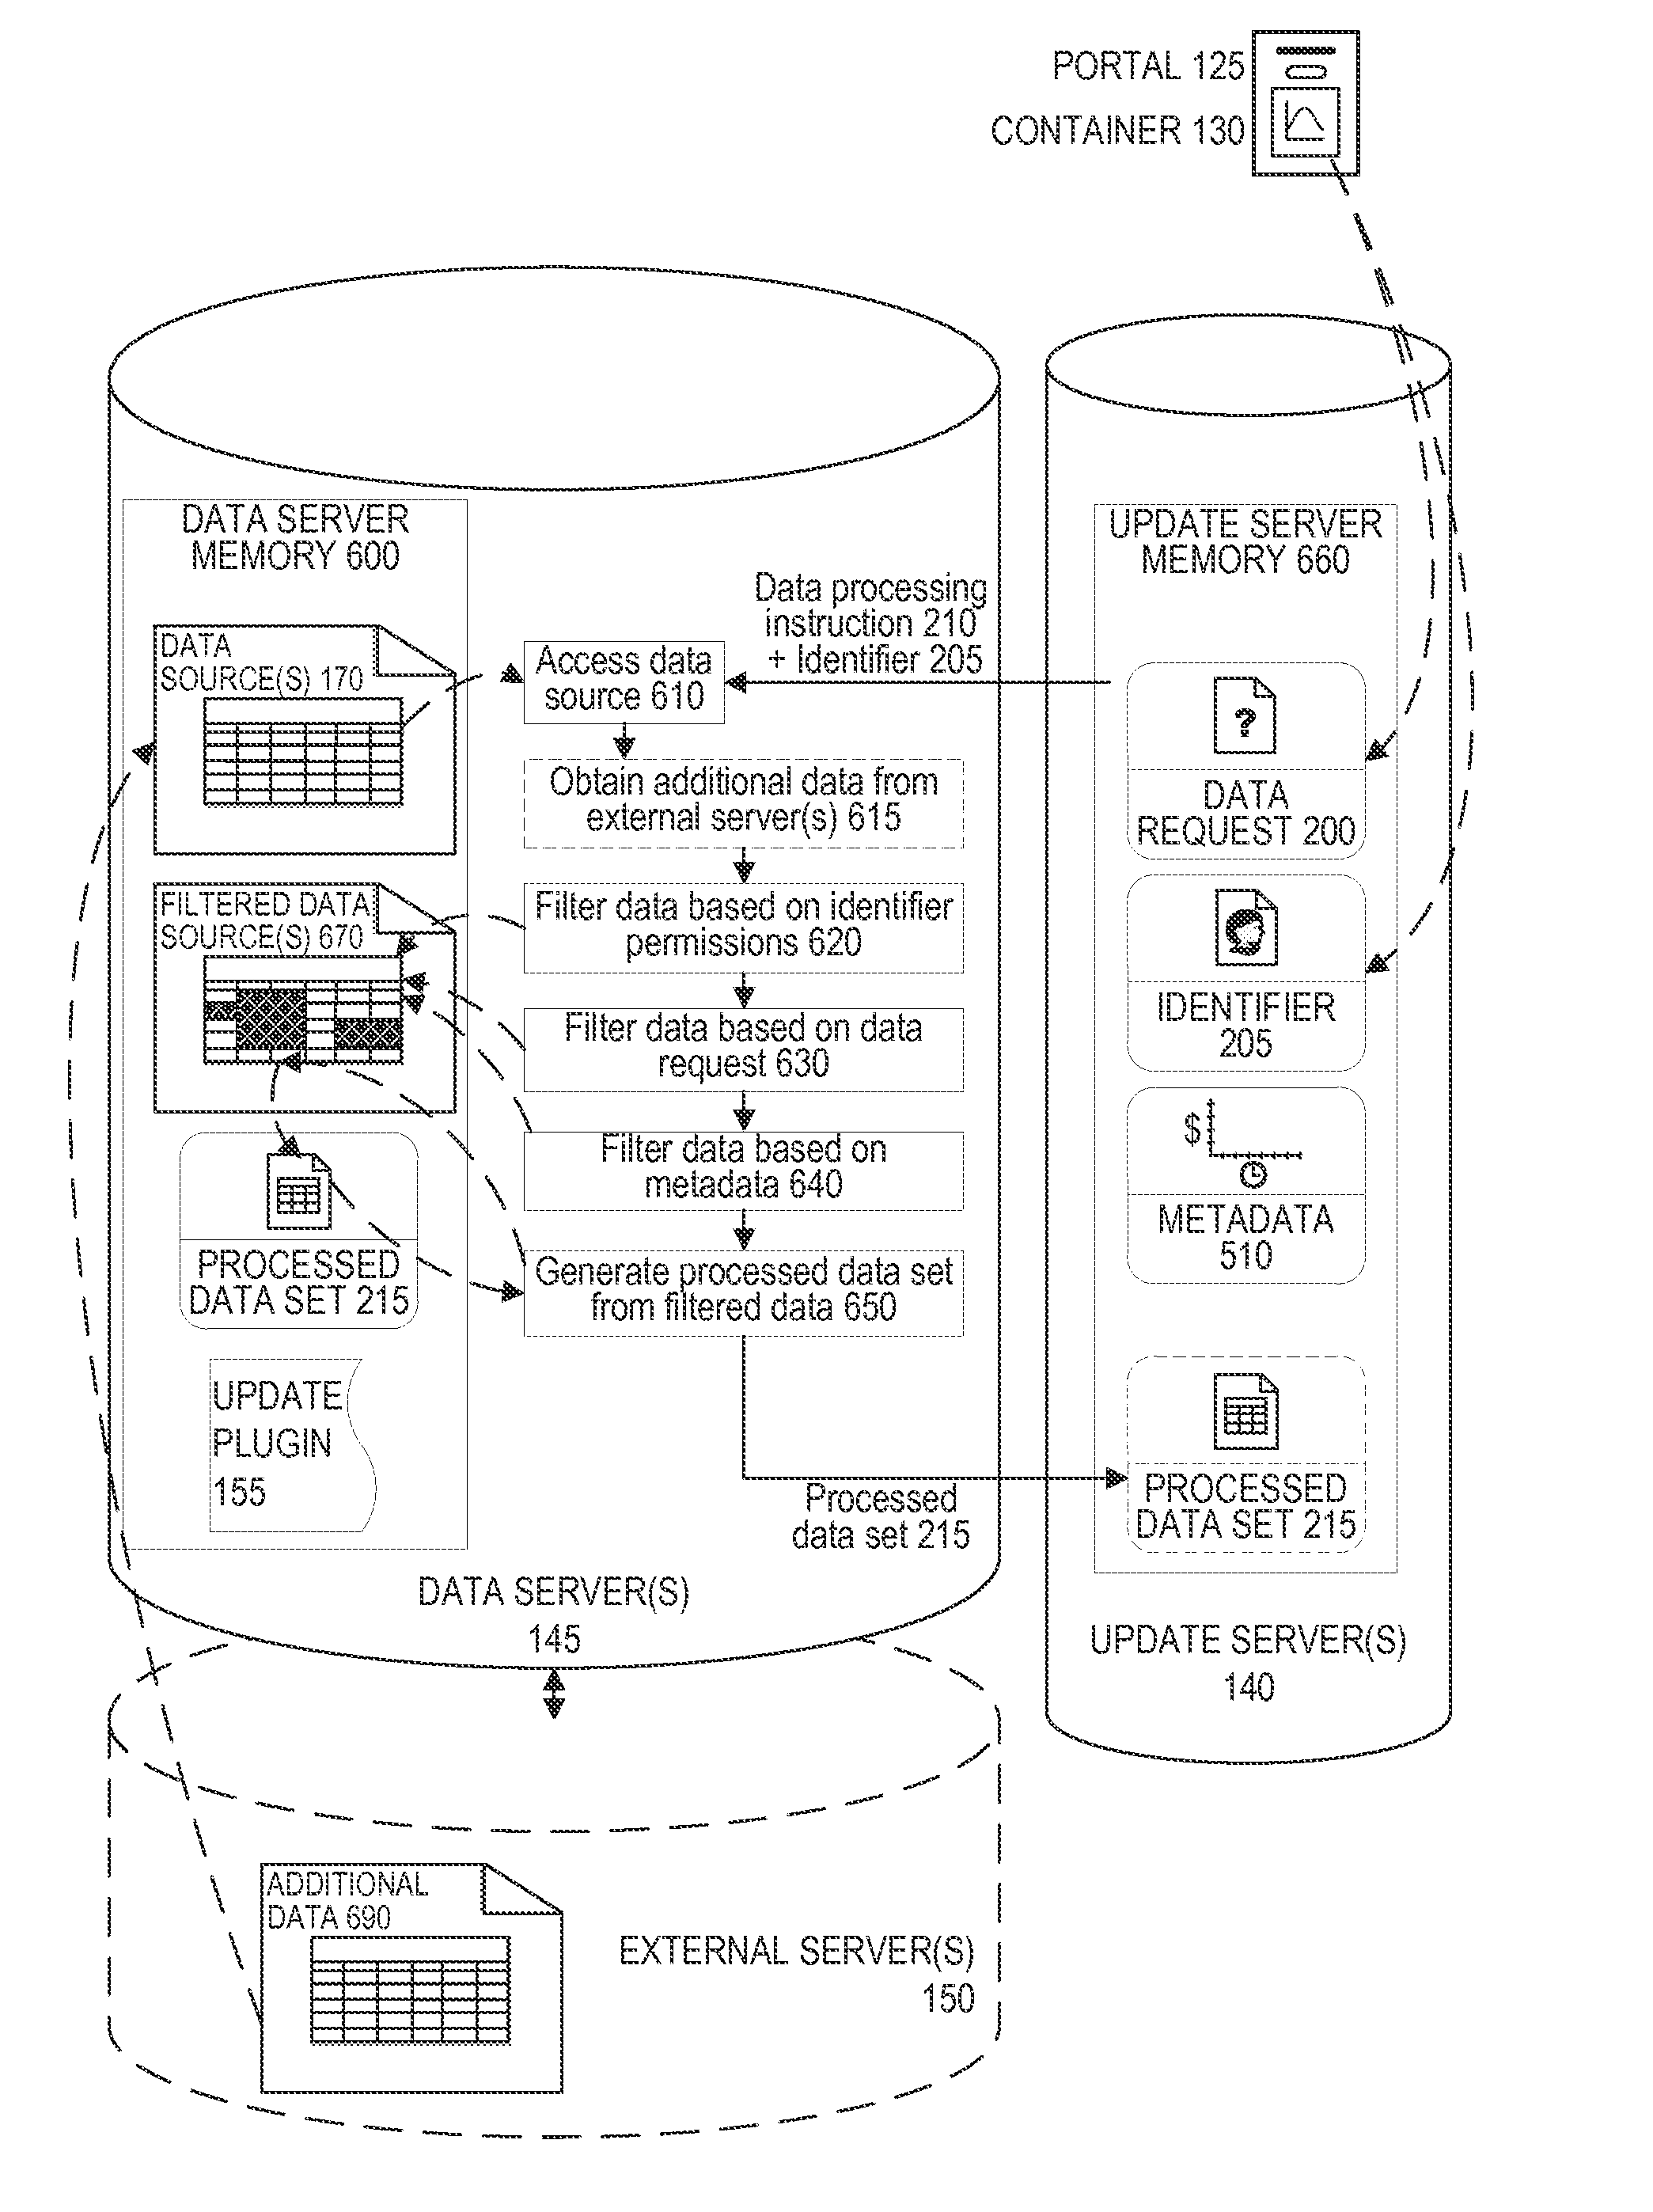
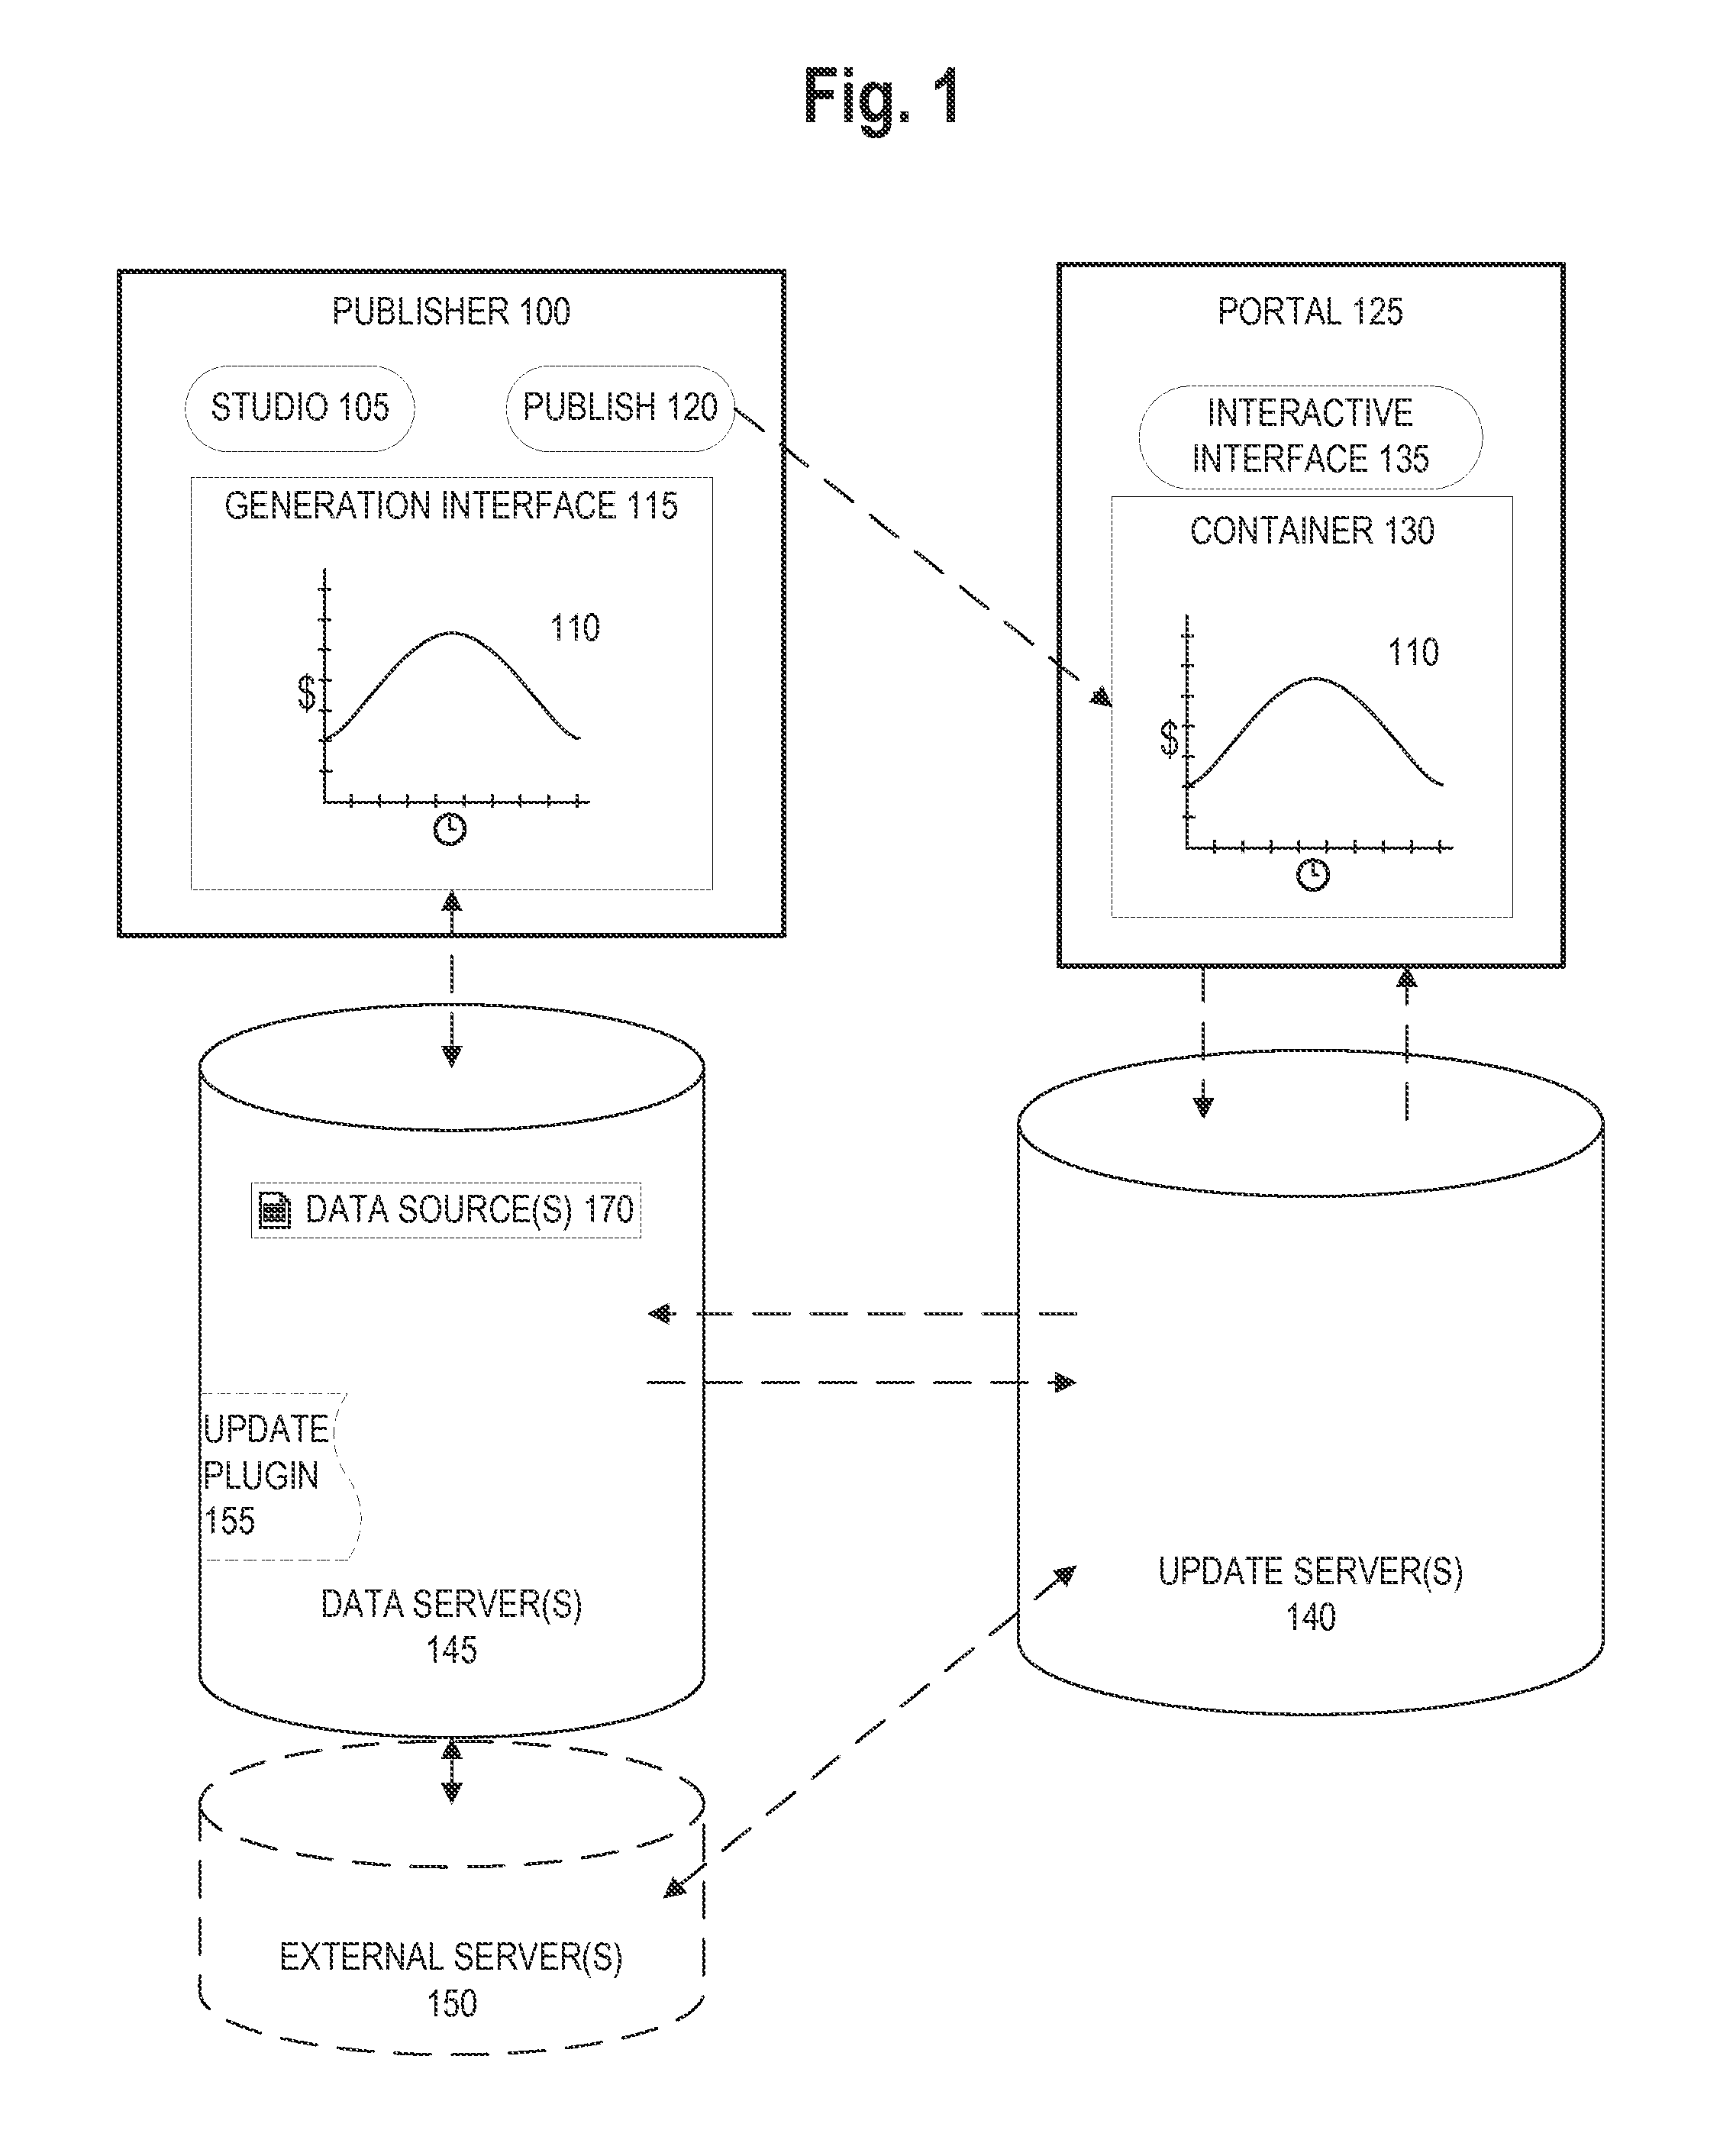
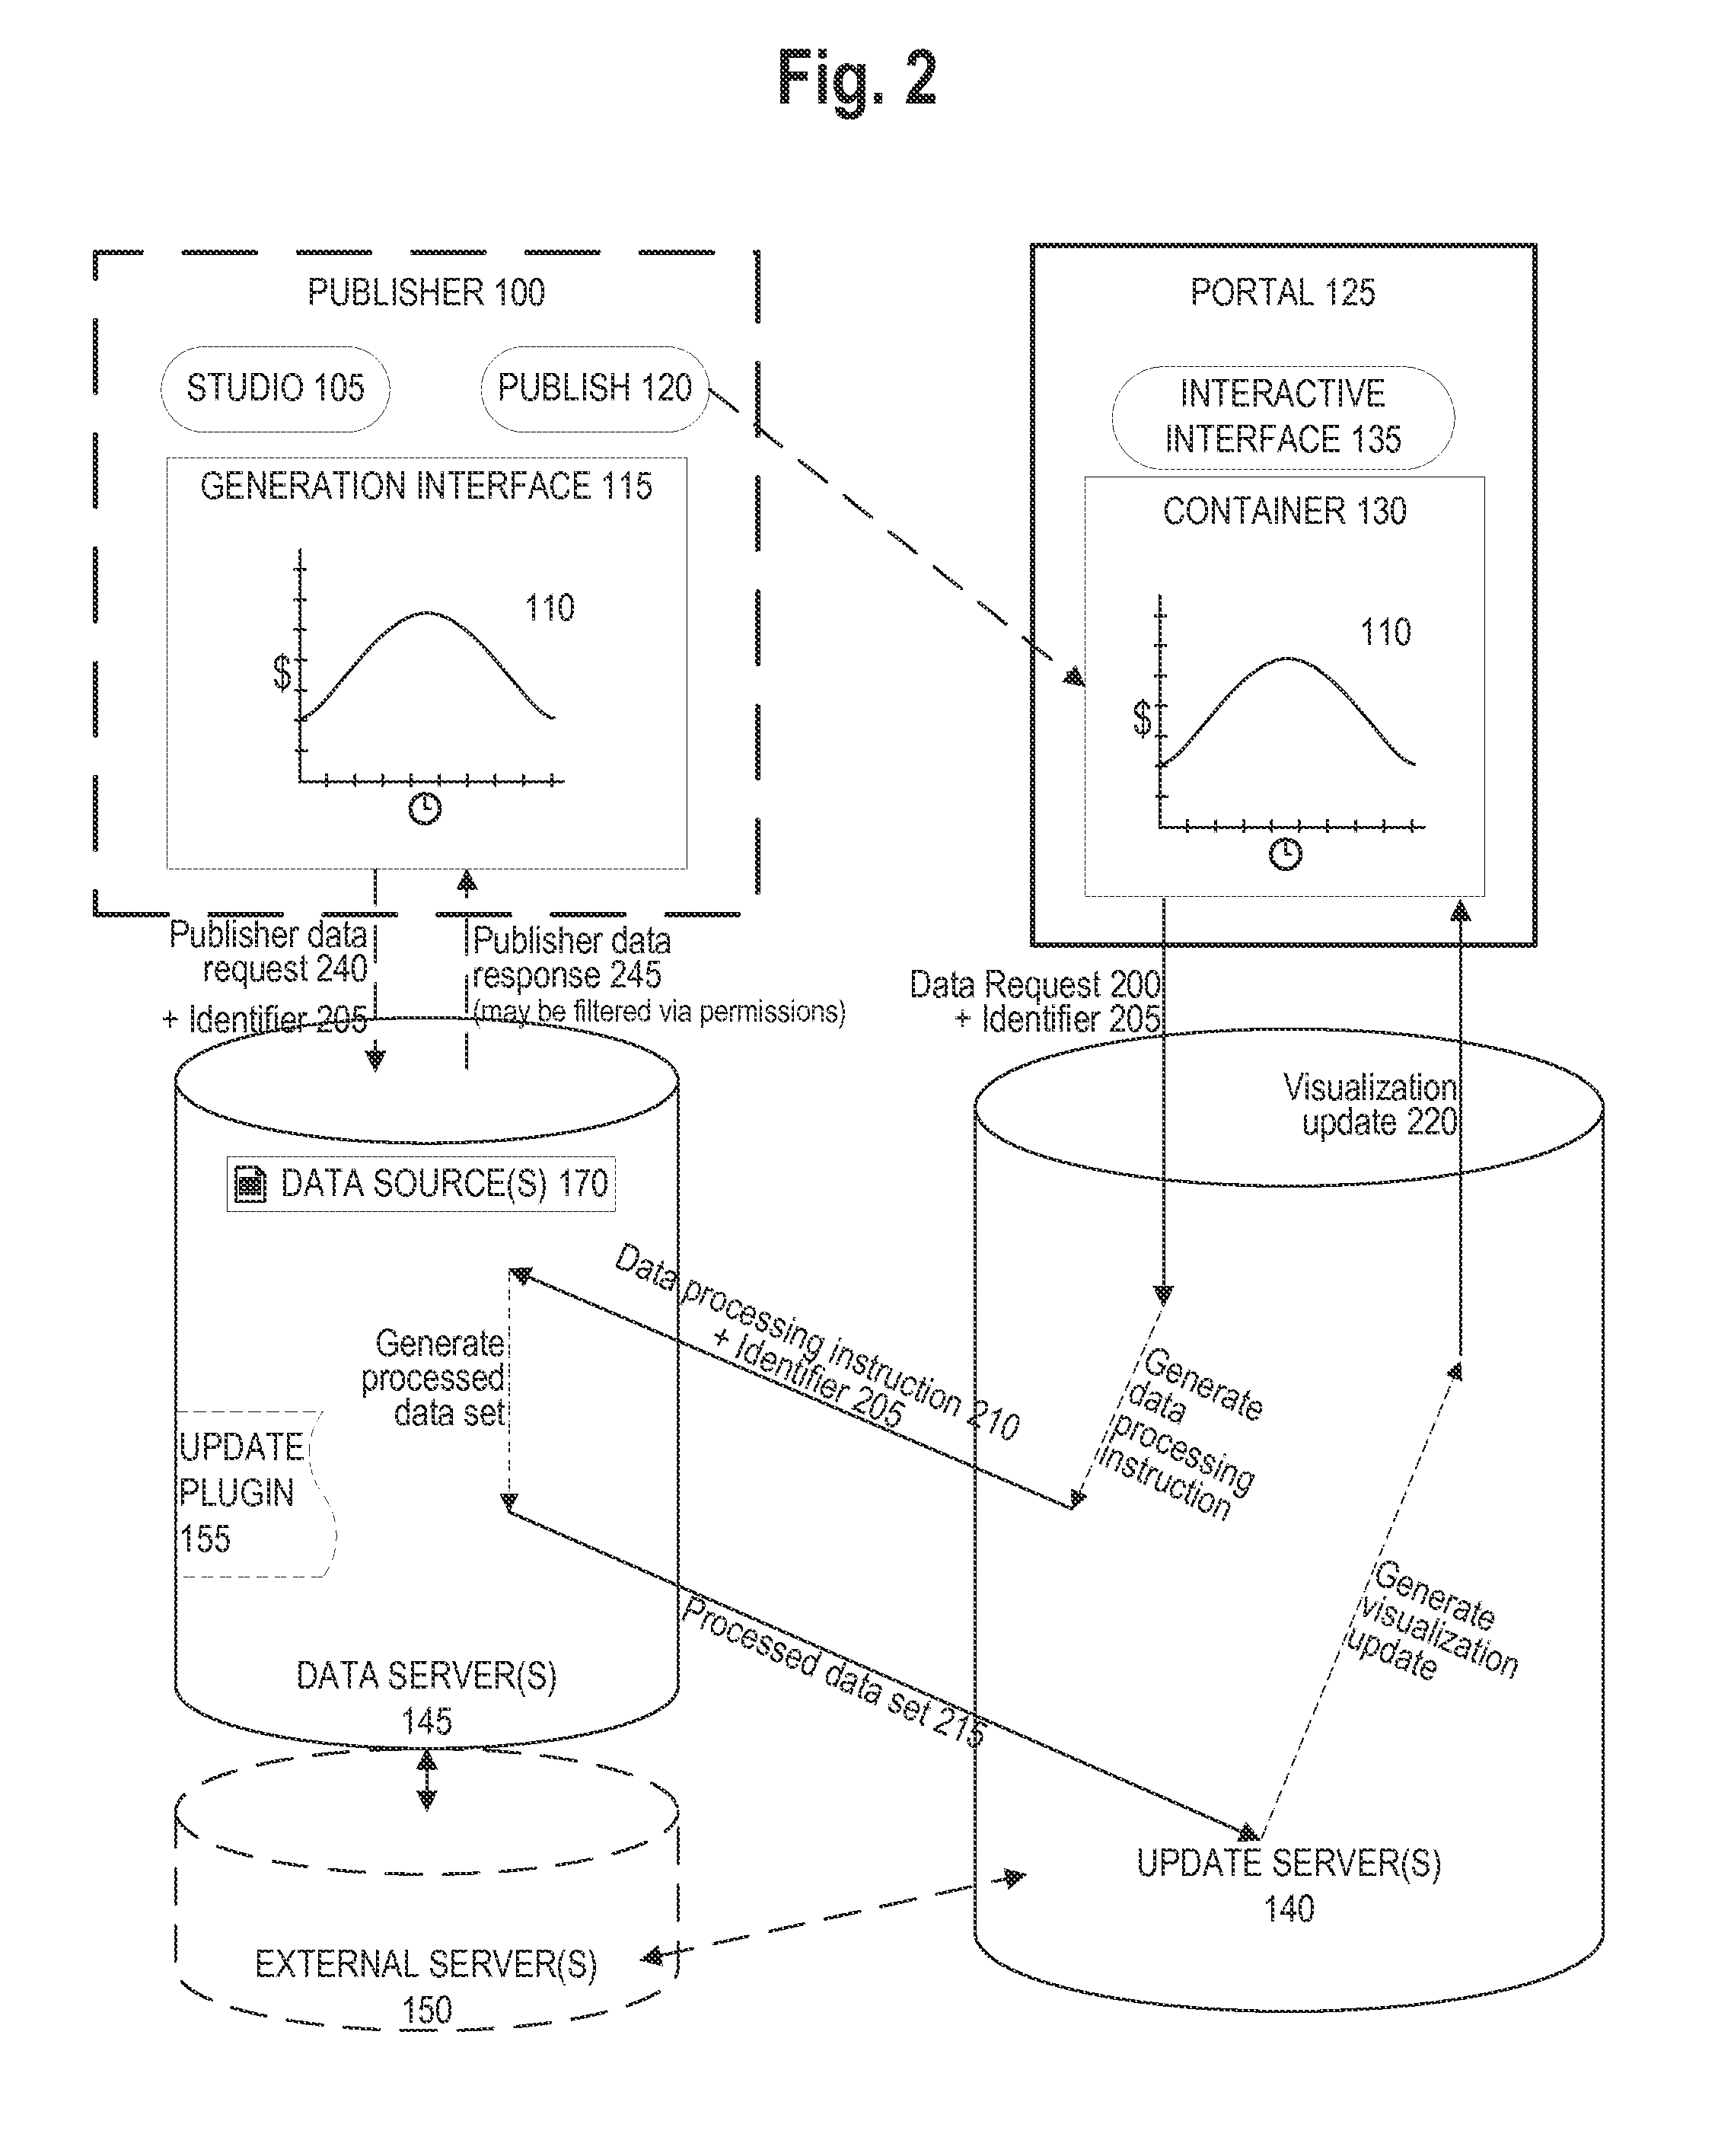
[0022]Embodiments of the present invention concern systems and methods of securely capturing and presenting up-to-date data in an analytic visualization. An update server receives a data request from a container that can display the analytic visualization. The update server generates a data processing instruction and transmits it to a data server. The update server then receives a processed data set from the data server, generates a visualization update based on the processed data set, and transmits the visualization update to the container. The container can then display the analytic visualization with up-to-date data from the data server. Because the data processing is performed at the data server, the remaining data on the data server is never moved through the network and remains secure. The update server can also receive from the container, and transmit to the data server, an identifier whose permissions limit data access from the data server.

[0023]FIG. 1 illustrates an exempla...


PUM


Abstract

A method and system is described securely capturing up-to-date data and presenting the up-to-date data in an analytic visualization. An update server receives a data request from a container that can display the analytic visualization. The update server generates a data processing instruction and transmits it to a data server. The update server then receives a processed data set from the data server, generates a visualization update based on the processed data set, and transmits the visualization update to the container. The container can then display the analytic visualization with up-to-date data from the data server. Because the data processing is performed at the data server, the remaining data on the data server is never moved through the network and remains secure. The update server can also receive from the container, and transmit to the data server, an identifier whose permissions limit data access from the data server.

Description

CROSS-REFERENCE TO RELATED APPLICATIONS[0001]The present application claims the priority benefit of U.S. provisional application No. 62 / 155,273 filed Apr. 30, 2015 and entitled “Secure Connections in an Interactive Analytic Visualization Infrastructure,” the disclosure of which is hereby incorporated by reference.BACKGROUND[0002]1. Field of the Invention[0003]The present invention generally relates to analytic visualizations. More specifically, the present invention relates to the secure transfer of data for embedded analytic visualizations.[0004]2. Description of the Related Art[0005]With the continued proliferation of computing devices and the ubiquitous increase in Internet connectivity, dealing with vast quantities of data has become a norm in business and consumer markets. Viewing and manipulating such data while the data is still arranged in spreadsheets, tables, databases, and other data structures can often be slow, difficult, unwieldy, and in some cases, entirely unmanageab...

Claims


Application Information

Patent Timeline
IPC IPC(8): H04L29/06G06F17/30
CPCH04L63/0428G06F17/30876H04L63/102H04L63/06G06F16/2379G06F16/26G06F16/955H04L63/08
Inventor DUNCKER, SEYMOURDEOLALIKAR, DEEPAKADAMS, KEVINYRUSKI, ANDREY
Owner ICHARTS LLC
Learn More