Systems and Methods for Data Visualization Using Three-Dimensional Displays

a technology of three-dimensional display and data visualization, applied in the field of data visualization, to achieve the effect of increasing the ability of viewers

Active Publication Date: 2017-03-30
CALIFORNIA INST OF TECH
View PDF0 Cites 45 Cited by
  • Summary
  • Abstract
  • Description
  • Claims
  • Application Information

AI Technical Summary

Benefits of technology

[0009]Humans have a remarkable pattern recognition system and can acquire more information through vision than all the other senses combined. Visualization provides an ability to understand large amounts of data by mapping abstract information to more easily understandable visual elements. Systems and methods in accordance with various embodiments of the invention create 3D data visualizations that increase a viewer's ability to explore an even higher dimensionality in data and observe complex patterns within the data. Humans are biologically optimized to see the world and the patterns in it in three dimensions. Therefore, presentation of data via a 3D display as a multidimensional (i.e., with the number of displayed data dimensions of 3 or greater) data visualization enables identification of meaningful structures in data (e.g., clusters, correlations, outliers) that may contain an actionable knowledge and that often reside in higher dimensional spaces and which are not readily observable through visualization of data via conventional 2D display technologies. Furthermore, immersive AR, MR, and VR environments naturally support collaborative data visualization and exploration, and are conducive to scientists interacting with their data along side of their colleagues in shared virtual spaces.

Problems solved by technology

The challenge is in maximizing the number of simultaneously visualized data dimensions k that can be readily understood by a human.

Method used


Image

  • Systems and Methods for Data Visualization Using Three-Dimensional Displays
  • Systems and Methods for Data Visualization Using Three-Dimensional Displays
  • Systems and Methods for Data Visualization Using Three-Dimensional Displays

Examples


Embodiment Construction

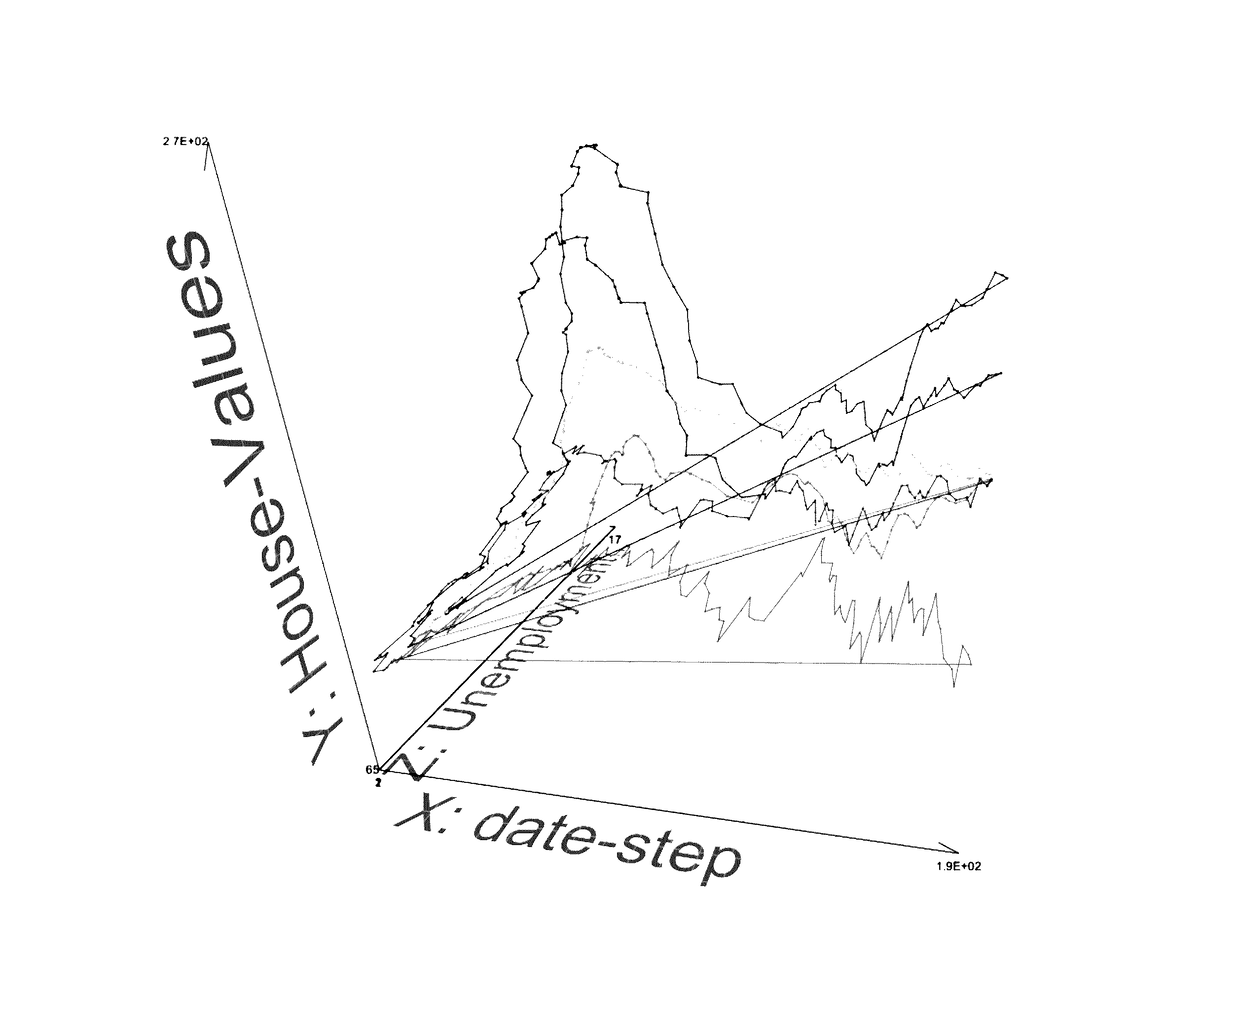
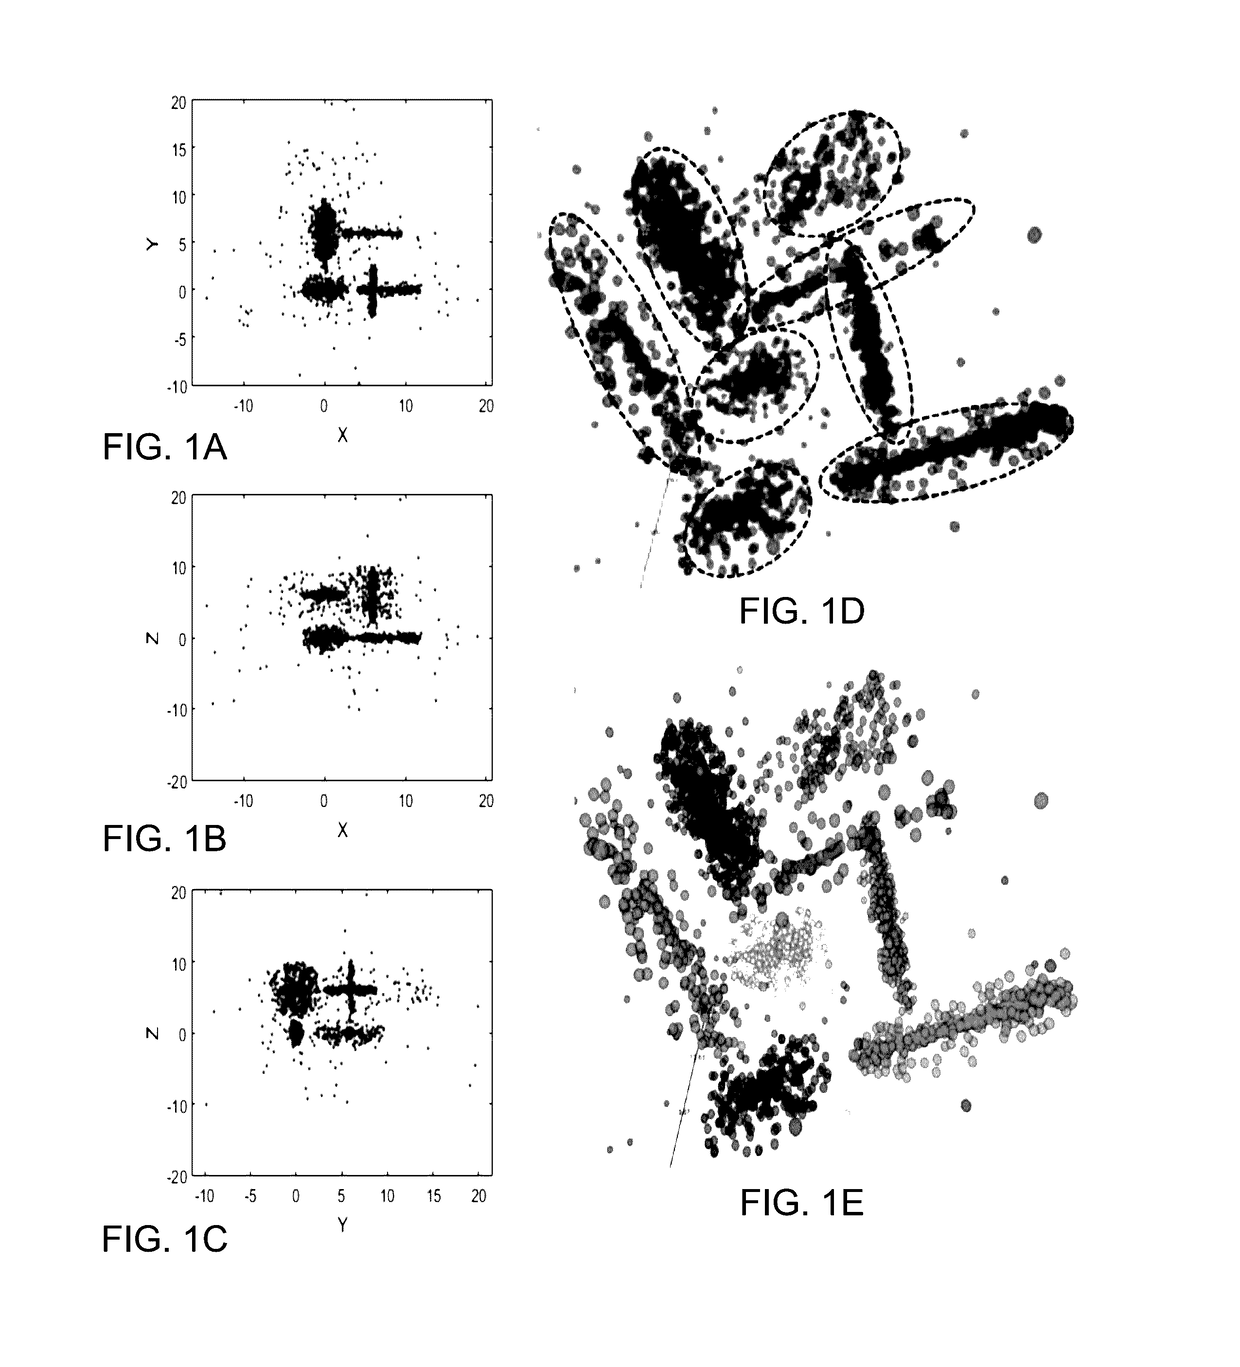
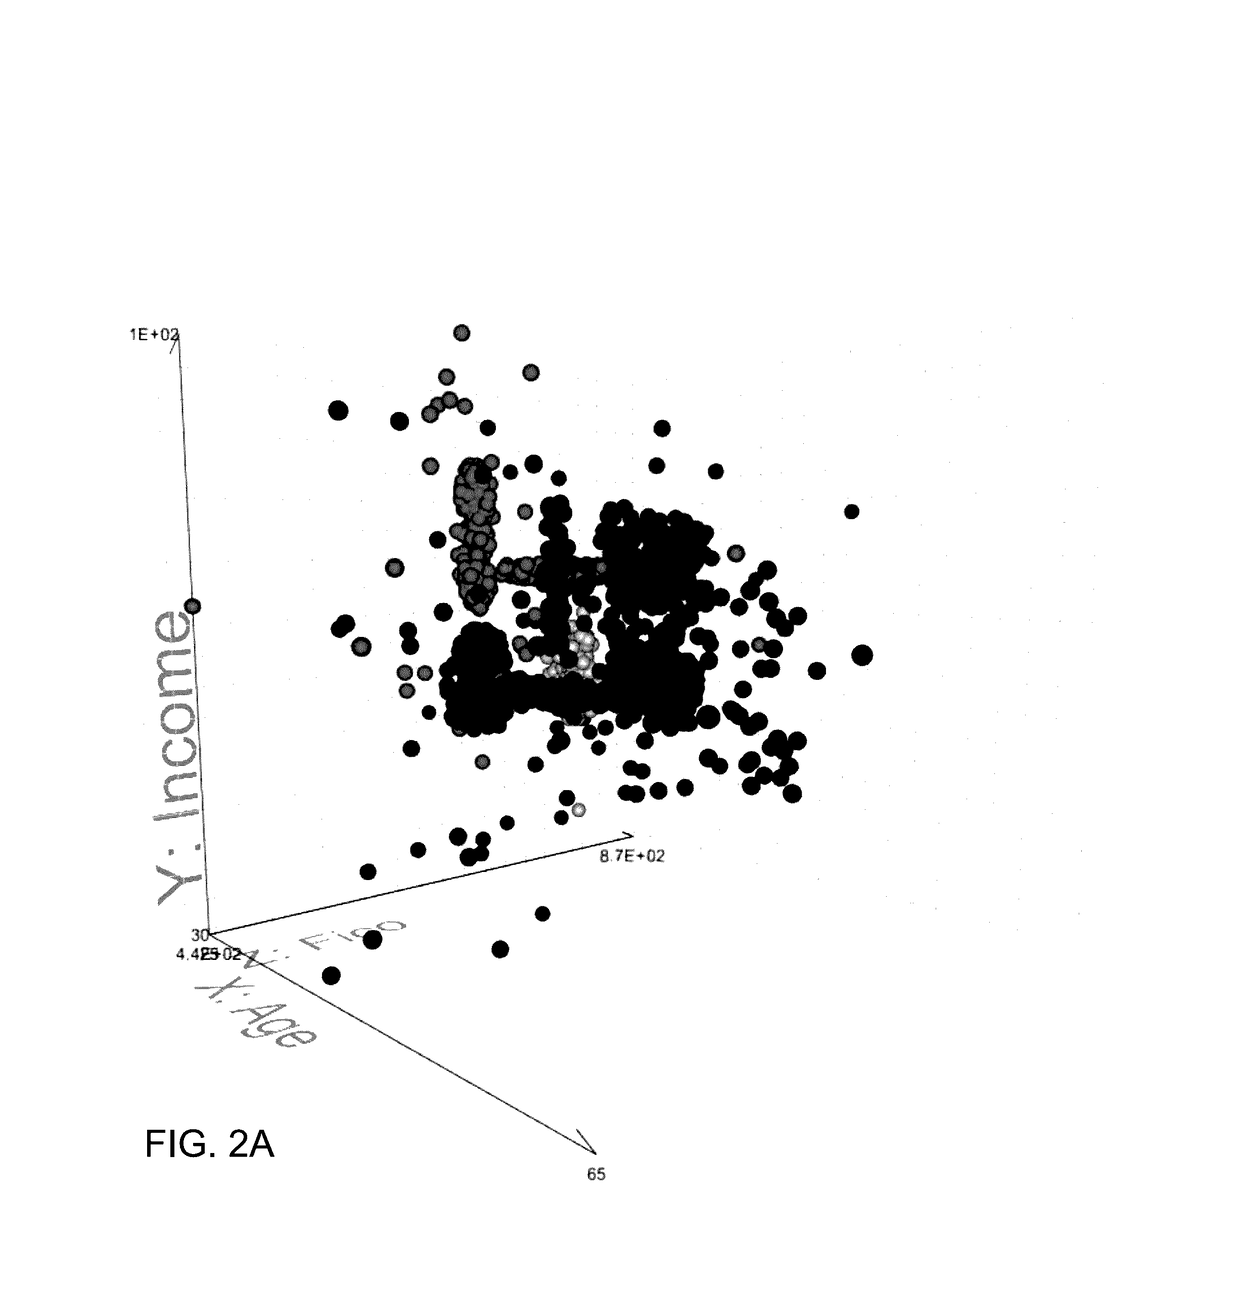
[0070]Data visualization systems that can visualize multidimensional data as 3D graphs (i.e. 3D data visualization systems) and methods of generating visualizations of multidimensional data spaces in accordance with a number of embodiments of the invention can utilize 3D display technologies to address many of the challenges of effective interactive visualization of high-dimensional data. The term here 3D graph is used in a general sense to reference any 3D object or group of 3D objects that collectively describe a set of data. A distinction can be drawn between the 3D object or objects that make up a 3D graph and other 3D objects, which may be utilized within a 3D visualization of multidimensional data to represent a virtual environment in which the 3D graph is contained. Current data visualization techniques, largely ask a user to perceive an environment that is displayed on a flat screen effectively by looking from the outside in. Systems and methods in accordance with several em...


PUM


Abstract

Data visualization systems and methods for generating 3D visualizations of a multidimensional data space are described. In one embodiment a 3D data visualization application directs a processing system to: load a set of multidimensional data points into a visualization table; create representations of a set of 3D objects corresponding to the set of data points; receive mappings of data dimensions to visualization attributes; determine the visualization attributes of the set of 3D objects based upon the selected mappings of data dimensions to 3D object attributes; update a visibility dimension in the visualization table for each of the plurality of 3D object to reflect the visibility of each 3D object based upon the selected mappings of data dimensions to visualization attributes; and interactively render 3D data visualizations of the 3D objects within the virtual space from viewpoints determined based upon received user input.

Description

CROSS-REFERENCE TO RELATED APPLICATIONS[0001]The current application claims priority under 35 U.S.C. §119(e) to U.S. Provisional Patent Application Ser. No. 62 / 232,119 entitled “Novel Method for a Visual Exploration of High-Dimensionally Data Sets Using Virtual Reality” to Djorgovski et al., filed Sep. 24, 2015 and U.S. Provisional Patent Application Ser. No. 62 / 365,837 entitled “Systems and Methods for Data Visualization Using Three-Dimensional Displays” to Djorgovski et al., filed Jul. 22, 2016. The disclosures of U.S. Provisional Patent Application Ser. No. 62 / 232,119 and 62 / 365,837 are hereby incorporated by reference in their entirety.STATEMENT OF FEDERAL SUPPORT[0002]This invention was made with government support under Grant No. HCC0917814 awarded by the National Science Foundation. The government has certain rights in the invention. The invention described herein was made in the performance of work under a NASA contract NNN12AA01C, and is subject to the provisions of Public ...

Claims


Application Information

Patent Timeline
Patent Type & Authority Applications(United States)
IPC IPC(8): G06T19/00G06T15/00G06T19/20G06T7/20H04N5/225G06K9/62G06K9/46G06T13/20G06T17/00G06T7/00
CPCG06T19/006G06T17/00G06T15/005G06T19/20G06T7/004G06T2200/04G06K9/6267G06K9/4671G06T13/20G06T7/20H04N5/2256G06T15/40G06T2200/24G06T7/55G06F18/24H04N23/56G06T11/206G06T15/205G06T15/506G06T19/003G06T2219/2004G06T2219/2016
Inventor DJORGOVSKI, STANISLAV G.DONALEK, CIRODAVIDOFF, SCOTT
Owner CALIFORNIA INST OF TECH
Why Eureka
Try Eureka