Semantic layers for secure interactive analytic visualizations

a secure interactive and analytic visualization technology, applied in the field of securely generated analytic visualizations, can solve the problems of complex data, difficult to analyze simple, difficult to organize large amounts of data, etc., and achieve the effect of avoiding the loss of data

Inactive Publication Date: 2017-12-07
ICHARTS
View PDF1 Cites 21 Cited by
  • Summary
  • Abstract
  • Description
  • Claims
  • Application Information

AI Technical Summary

Problems solved by technology

Analyzing such data while the data is still arranged in spreadsheets, tables, databases, and other data structures can often be slow, difficult, and unwieldy.
High volumes of data can be difficult to analyze simply due to the sheer amount available for review.
Complex data can be similarly difficult to analyze, as a user may need to keep track of various rows and columns and perform mathematical operations such as averages or conversions.
Keeping track of manipulations to such data can be difficult as well, as many databases are regularly fed new data, and users often have various saved versions that are often not up-to-date and may include personalized manual edits such as sort operations, deletions, duplications, or additional rows or columns with calculations.
However

Method used


Image

  • Semantic layers for secure interactive analytic visualizations
  • Semantic layers for secure interactive analytic visualizations
  • Semantic layers for secure interactive analytic visualizations

Examples


Embodiment Construction

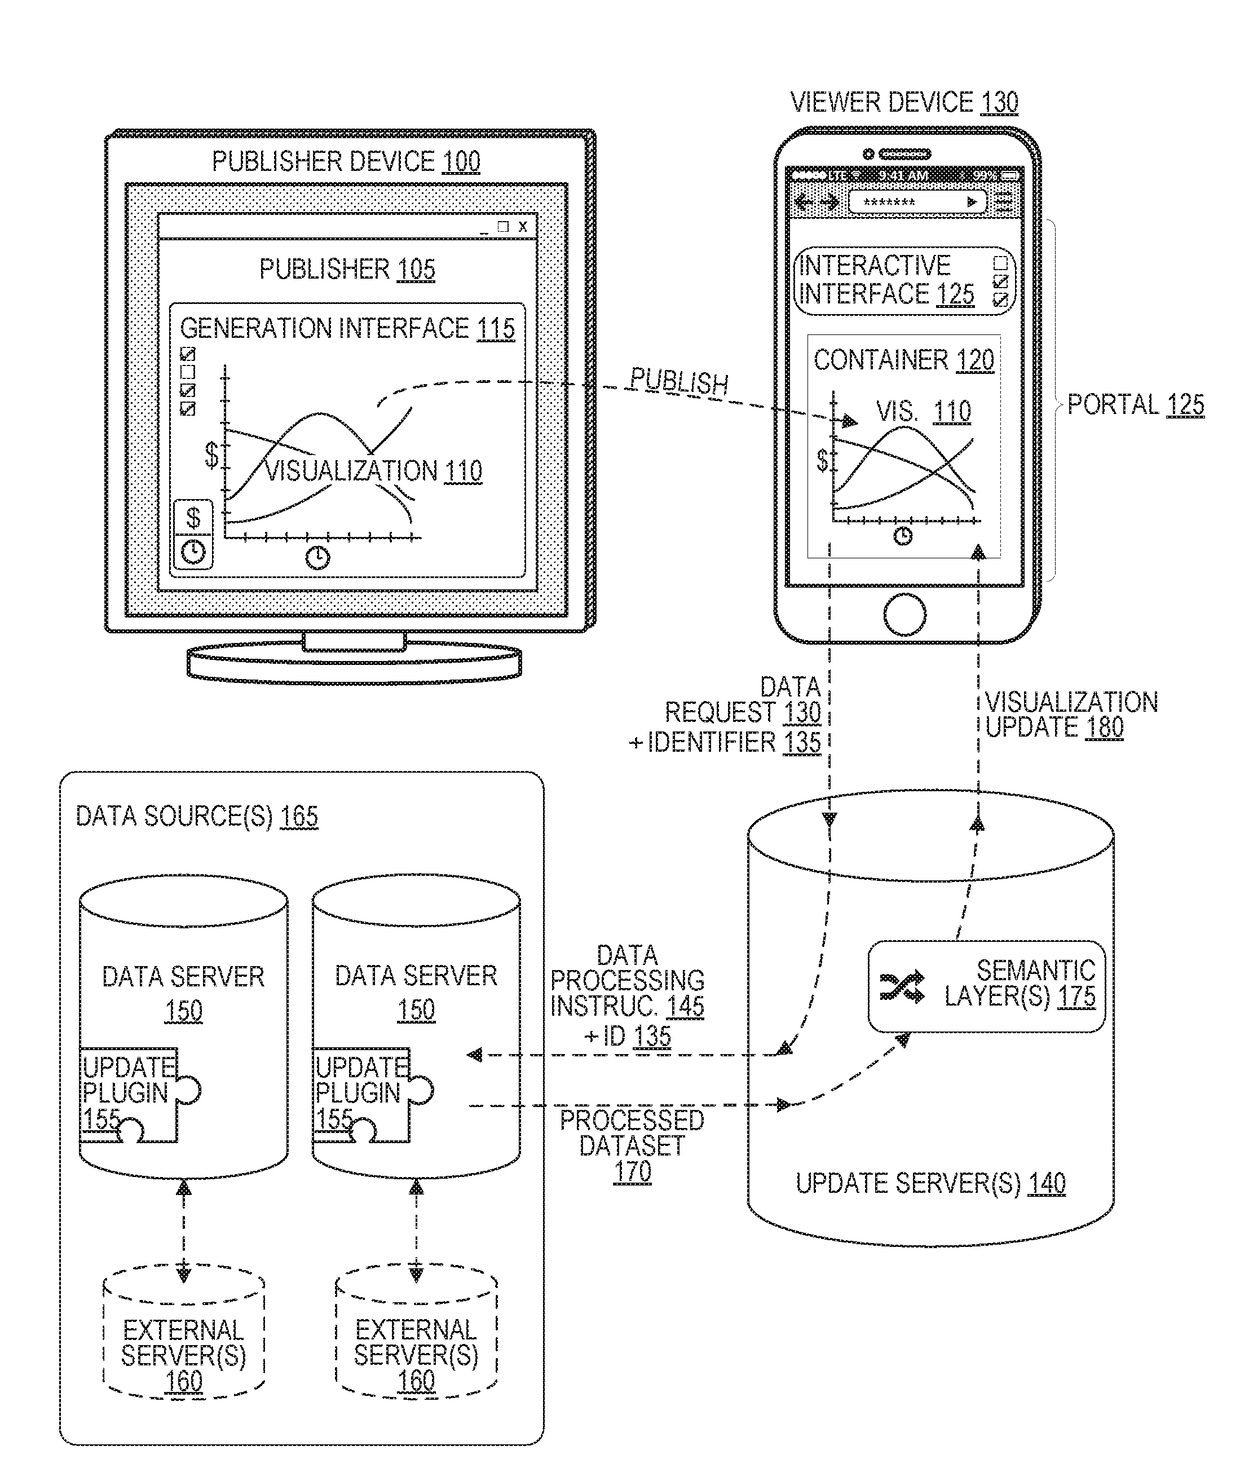
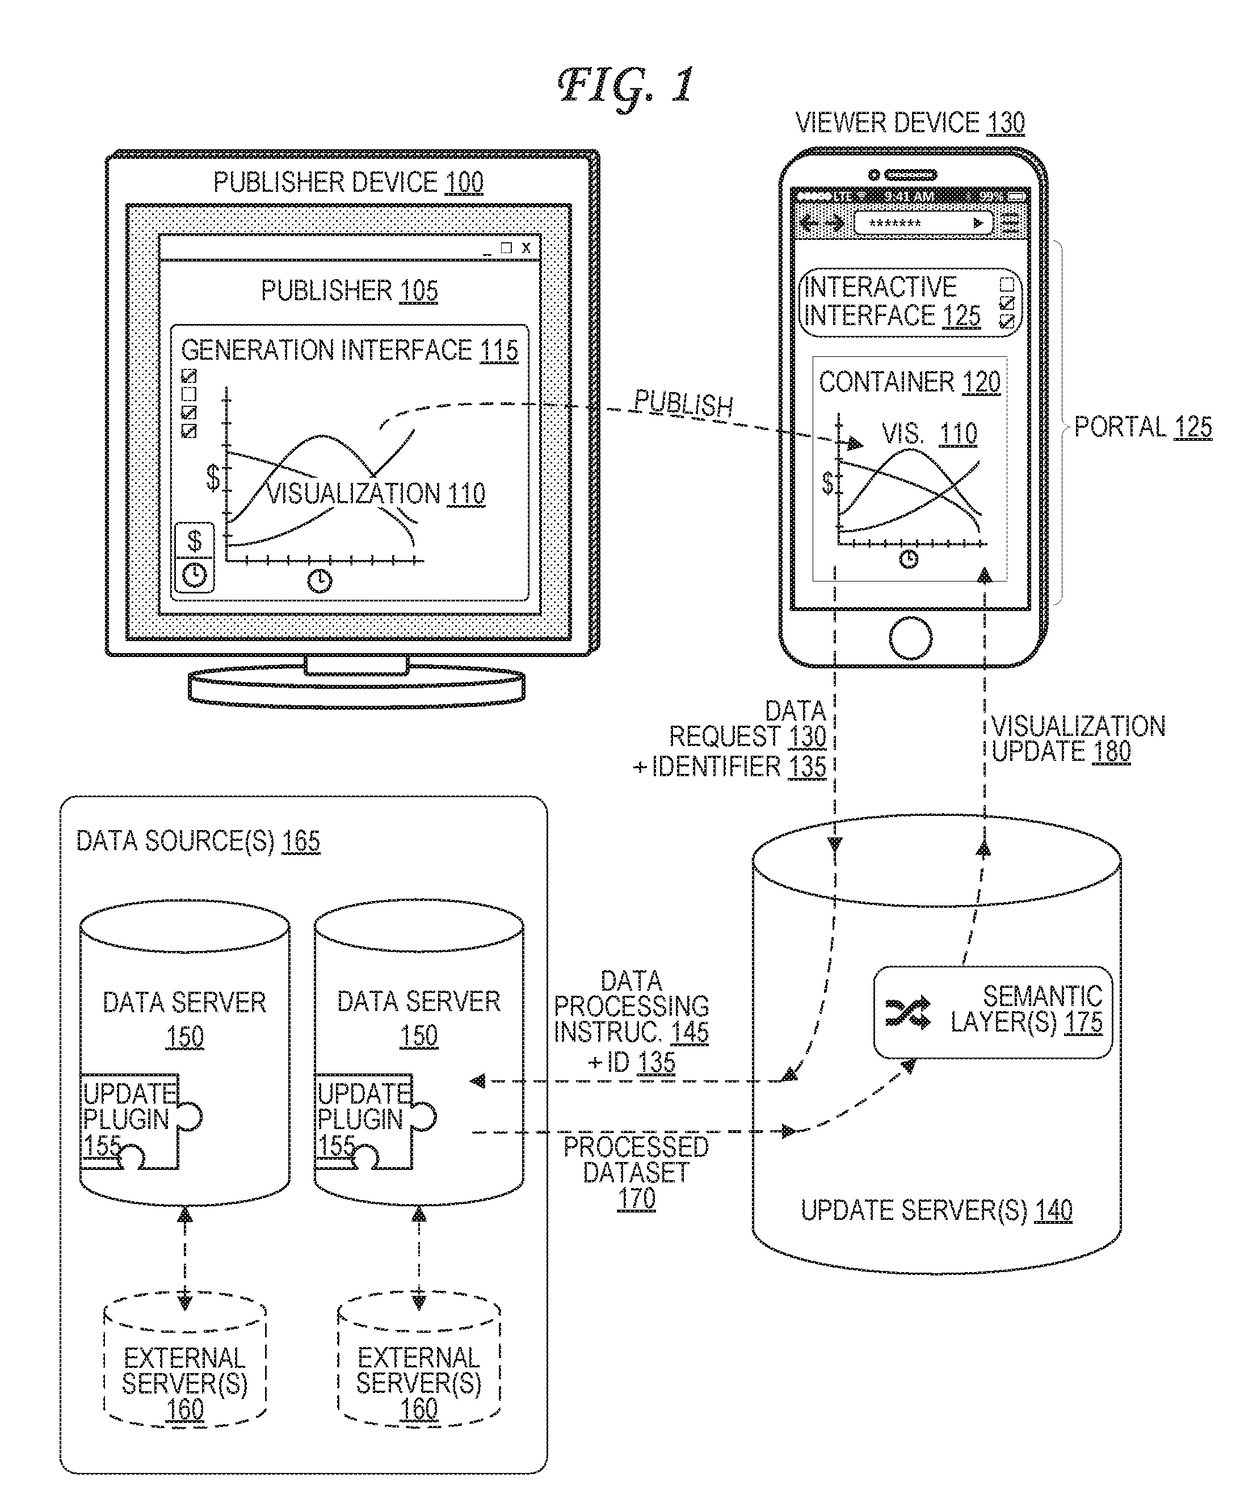
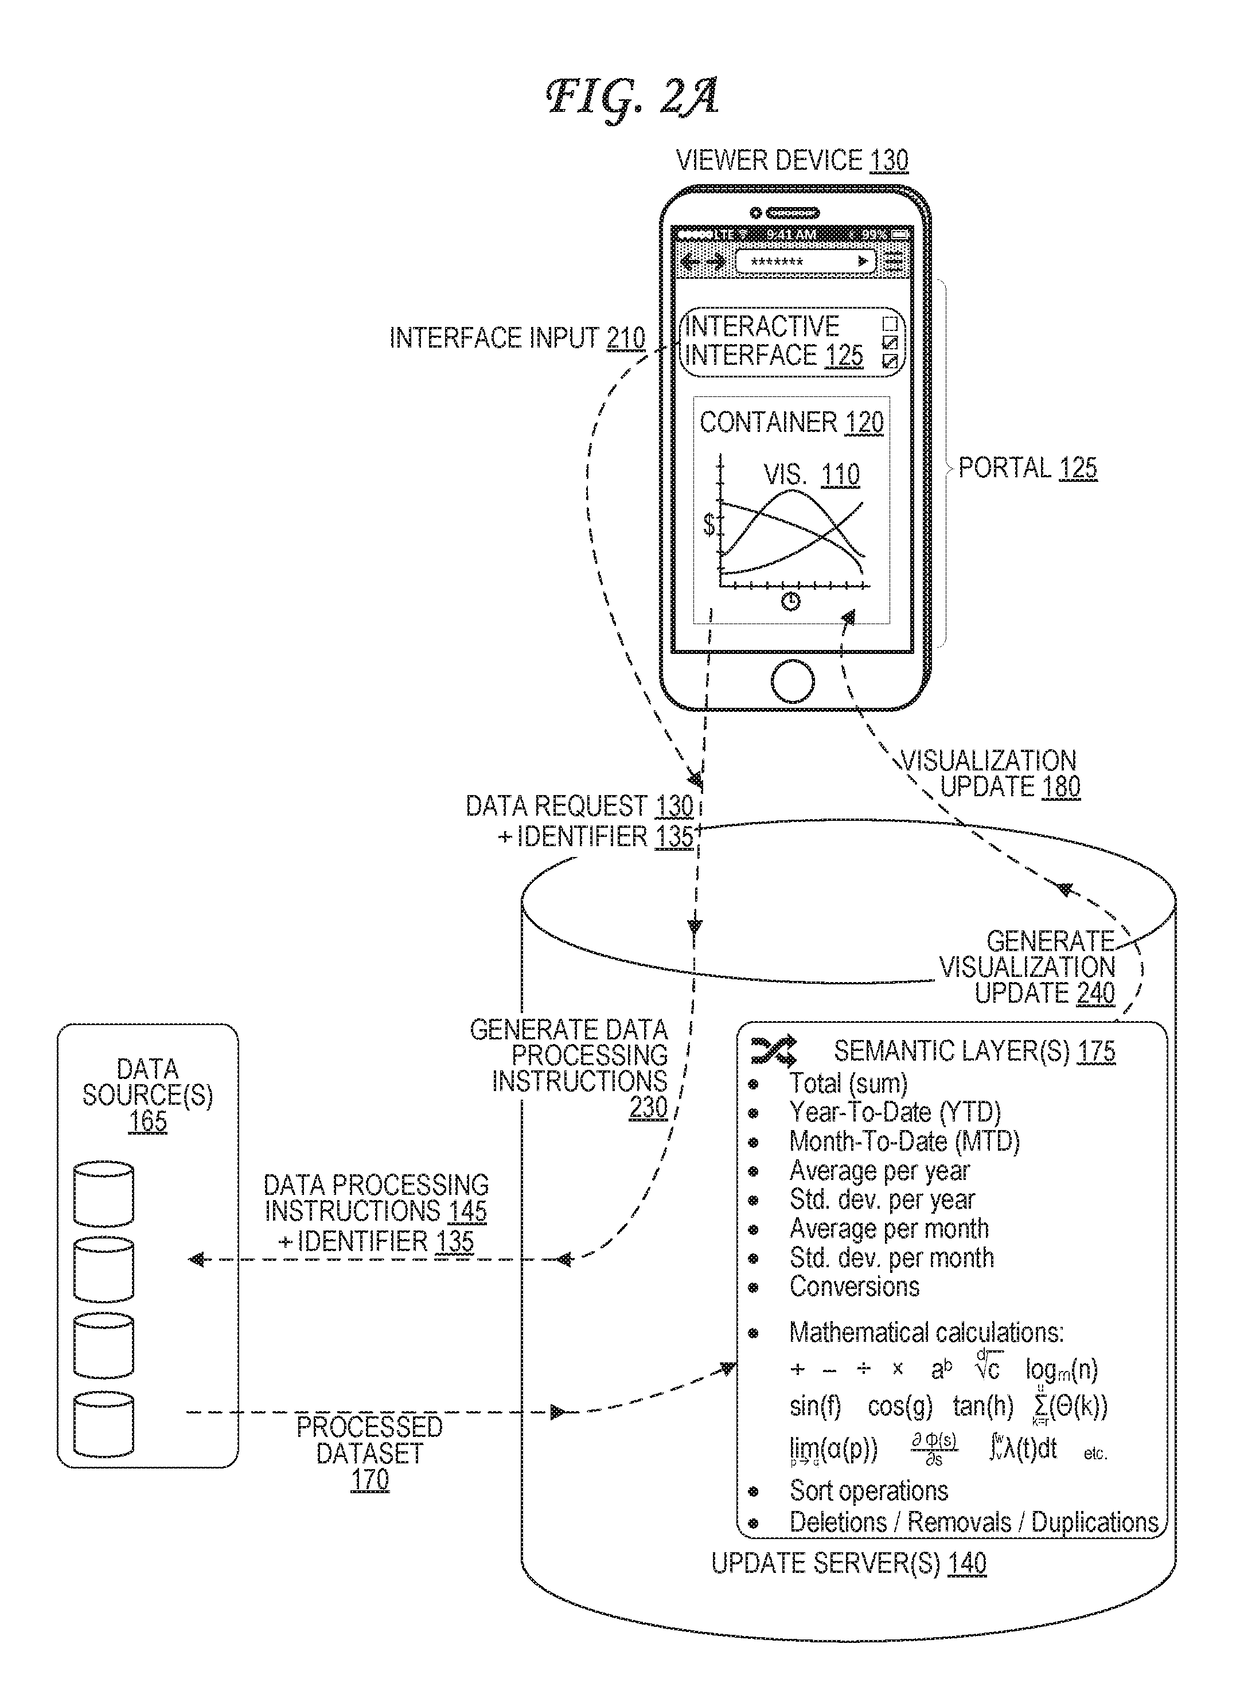
[0016]An analytic visualization, such as a chart or graph, embedded into a container. The container is embedded into a portal, such as a web page, that is viewable by a viewer device. To update the analytic visualization, an update server receives a data request from the viewer device or from a container host server that hosts the container. The update server generates a data processing instruction based on the data request, which it sends to data sources. The data sources store a full dataset, and are configured to extract a processed dataset from the full dataset based on the data processing instructions. The update server receives the processed dataset from the data sources, applies one or more semantic layer operations to the processed dataset, and generates a visualization update based on the result. The update server then transmits the visualization update to the viewer device or container host server.

[0017]FIG. 1 illustrates data transfers within a secure analytic visualizati...


PUM


Abstract

An analytic visualization, such as a chart or graph, embedded into a container. The container is embedded into a portal, such as a web page, that is viewable by a viewer device. To update the analytic visualization, an update server receives a data request from the viewer device or from a container host server that hosts the container. The update server generates a data processing instruction based on the data request, which it sends to data sources. The data sources store a full dataset, and are configured to extract a processed dataset from the full dataset based on the data processing instructions. The update server receives the processed dataset from the data sources, applies one or more semantic layer operations to the processed dataset, and generates a visualization update based on the result. The update server then transmits the visualization update to the viewer device or container host server.

Description

BACKGROUND1. Field of the Invention[0001]The present invention generally concerns securely generated analytic visualizations. More specifically, the present invention concerns automated remote manipulation of data via semantic layers for use in a securely and dynamically generated interactive analytic visualizations.2. Description of the Related Art[0002]With the continued proliferation of computing devices and the ubiquitous increase in Internet connectivity, dealing with vast amounts of complex data has become a norm in business and consumer markets. Analyzing such data while the data is still arranged in spreadsheets, tables, databases, and other data structures can often be slow, difficult, and unwieldy. High volumes of data can be difficult to analyze simply due to the sheer amount available for review. Complex data can be similarly difficult to analyze, as a user may need to keep track of various rows and columns and perform mathematical operations such as averages or conversi...

Claims


Application Information

Patent Timeline
IPC IPC(8): G06F17/30G06F17/22
CPCG06F17/30716G06F17/30696G06F17/2288G06F16/248G06F16/338
Inventor DUNCKER, SEYMOURYRUSKI, ANDREY
Owner ICHARTS
Why Eureka
Try Eureka