Supercharge Your Innovation With Domain-Expert AI Agents!

Systems and methods for forecasting battery state of charge

a battery state and system technology, applied in the field of systems and methods for forecasting the state of charge of batteries, can solve the problems of increasing the temperature of li-ion cells, wind and solar face significant challenges, and the technology comes at a cost, and achieve the effect of decreasing the c-rate datas

Active Publication Date: 2021-04-29
FLORIDA INTERNATIONAL UNIVERSITY
View PDF0 Cites 6 Cited by
  • Summary
  • Abstract
  • Description
  • Claims
  • Application Information

AI Technical Summary

Benefits of technology

The proposed method achieves accurate SOC prediction with reduced error (RMSE < 5) by integrating univariate and machine learning models, enhancing the reliability of battery management systems and extending the lifecycle of electric vehicle batteries.

Problems solved by technology

Severe and possibly irreversible environmental issues have forced the advancement of wind, solar, and other green energies.
Although various techniques have been developed to minimize energy consumption and the future of these technologies is promising, wind and solar face significant challenges in the high penetration scenarios in the near future, especially in deriving intelligence, reliability, and resilience through the large amounts of data harnessed from them.
These technologies come at a cost, given the rising threats to their safety and reliability.
The state of charge (SOC) and voltage of a battery increase with an increase in current, and this results in an increase in temperature of Li-ion cells that could be dangerous for electric vehicles (EVs) with a potential of thermal runaway.
Existing identification mechanisms face hindrances for Li-ion batteries internally due to solid electrolyte interface deposition on the electrode surface and externally due to analog-to-digital module restrictions.
With age or load applications, this capacity value downgrades during charging and discharging cycles.
In a rest or a standby condition that lasts for months (not to be confused with rest between lifecycles) under anomalous temperatures, storage degradation occurs reducing the calendar life of the batteries.

Method used


Image

  • Systems and methods for forecasting battery state of charge
  • Systems and methods for forecasting battery state of charge
  • Systems and methods for forecasting battery state of charge

Examples


example 1

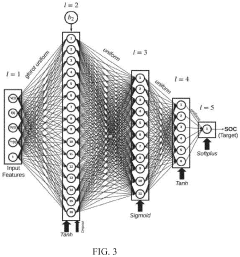
[0085]Table 1 shows the forecasting errors for the univariate forecasting or single-step forecasting results for V, I, and SOC % shown in FIGS. 5(a)-5(c) for ARIMA, and 5(d)-5(f) for HWES, respectively. ARIMA predicted / forecasted plots are able to trace all the peaks and valleys of the actual (original) data, while HWES predicted plots indicate learning delay, and show inability to track valleys accurately. These univariate results were then passed through MLP and NARX-net models. The MLP and NARX-net models include multiple hidden layers. Selection of these hidden layers was performed using trial and error, based on the loss function (L) value obtained. The hidden layer topology that resulted in the lowest value of loss functions was selected to represent all the respective MLP (FIG. 3) and NARX-net (FIG. 4) Models. FIG. 9 shows the second step prediction errors for MLP Models 1 and 2 and final step prediction errors for MLP Models 3 and 4, and their corresponding convergence speed...

example 2

[0086]Among the seven optimizers considered, a set of two best performing optimizers (AdaGrad and AdaMax) was evaluated further for MLP Models 1 and 2, using computed C / 10 rate SOC % as the testing data to analyze multi-step forecasting MLP models performance. The plots corresponding to the values in FIG. 11 for these two models are shown in FIGS. 6(a)-6(d). To perform an overall comparison of the MLP models, the results for MLP Models 1 and 2 from FIG. 11 and for MLP Models 3 and 4 (for AdaGrad and AdaMax optimizers) from FIG. 9 were compared, as these results were obtained by considering computed C / 10 rate SOC % as the testing data. The plots corresponding to these results are shown in FIGS. 6(a)-6(h). It can be seen that the inclusion of MLP Models for multi-step modeling reduced the error values. For multi-step prediction, MLP Model 1 performed better than all the other MLP Models (for AdaGrad and AdaMax optimizers), but required longer computation time due to higher number of e...

example 3

[0087]FIG. 10 shows the second step prediction errors for NARX Models 1 and 2 and final step prediction errors for NARX Model 3, for the given set of twelve optimizers. The testing data used for performance evaluation in NARX Models 1 and 2 is the predicted C / 10 rate SOC %. Among the twelve optimizers considered, a set of the two best performing optimizers (GDX and rprop) was evaluated further for NARX Models 1 and 2, using computed C / 10 rate SOC % as the testing data to analyze multi-step forecasting NARX-net models performance. The tabulated results (FIG. 10) for these two models indicated the error induced by the NARX-net models on the ARIMA / HWES predicted data along with their corresponding convergence speeds (epochs). It can be seen by comparing the results of these two NARX-net models from FIGS. 10 and 12 that the multi-step prediction NARX-net models do not reduce the errors caused by the ARIMA / HWES models. Despite this, the performance of multi-step prediction NARX Model 1 i...


PUM


Abstract

Systems and methods for forecasting of State of Charge (SOC) of lithium ion batteries are provided. A multi-step forecasting process with experimentally obtained decreasing C-Rate datasets together with machine learning can be used. The multi-step approach can combine a univariate technique with machine learning techniques. An Auto Regressive Integrated Moving Average (ARIMA) and / or Holt Winters Exponential Smoothing (HWES) can be combined with each other and / or with machine learning techniques such as Multilayer Perceptron (MLP) and Nonlinear autoregressive neural network with external input (NARX-net).

Description

CROSS-REFERENCE TO A RELATED APPLICATION[0001]This application claims the benefit of U.S. Provisional Application Ser. No. 62 / 926,108, filed Oct. 25, 2019, which is hereby incorporated by reference herein in its entirety, including any figures, tables, and drawings.GOVERNMENT SUPPORT[0002]This invention was made with government support under Award number CNS-1553494 awarded by National Science Foundation. The government has certain rights in the invention.BACKGROUND[0003]Severe and possibly irreversible environmental issues have forced the advancement of wind, solar, and other green energies. Although various techniques have been developed to minimize energy consumption and the future of these technologies is promising, wind and solar face significant challenges in the high penetration scenarios in the near future, especially in deriving intelligence, reliability, and resilience through the large amounts of data harnessed from them. These technologies come at a cost, given the risin...

Claims


Application Information

Patent Timeline
Patent Type & Authority Applications(United States)
IPC IPC(8): G01R31/367G01R31/387G01R31/36
CPCG01R31/367G01R31/3648G01R31/387G01R31/3842
Inventor SARWAT, ARIFKHALID, ASADULLAHSUNDARARAJAN, ADITYA
Owner FLORIDA INTERNATIONAL UNIVERSITY
Features
  • R&D
  • Intellectual Property
  • Life Sciences
  • Materials
  • Tech Scout
  • Unparalleled Data Quality
  • Higher Quality Content
  • 60% Fewer Hallucinations
Learn More