Unlock instant, AI-driven research and patent intelligence for your innovation.
Obstacle detection apparatus and method
Active Publication Date: 2006-01-10
KK TOSHIBA
View PDF10 Cites 44 Cited by
Summary
Abstract
Description
Claims
Application Information
AI Technical Summary
This helps you quickly interpret patents by identifying the three key elements:
Problems solved by technology
Method used
Benefits of technology
Benefits of technology
[0010]The present invention is directing to an obstacle detection apparatus and a method for correctly detecting an
Problems solved by technology
The technique using the laser is typically expensive and not practical.
The technique using the supersonic wave includes a problem for detection accuracy of the obstacle because resolution of the supersonic wave is usually low.
Furthermore, in a single active sensor using the laser or the supersonic wave, a driving lane of a vehicle cannot be recognized.
In the method using one camera, the obstacle object cannot be correctly separated from the road area because many obstacles of which intensity, color or texture is similar to actual road exist.
However, normal stereopsis includes a problem, i.e.,
Method used
Image
Click on the blue label to locate the original text in one second.
Reading with bidirectional positioning of images and text.
Examples
modification example 1
[0064]FIG. 6 is a block diagram of the obstacle detection apparatus according to modified example 1 of the present invention. In above-mentioned embodiment, feature conversion is respectively executed for the image L, the image R and the image P. However, in this modification, feature conversion is executed for the image L and the image R only, and the feature conversion image L and the feature conversion image R are generated. The feature conversion image L is converted by the image conversion T, and the feature conversion image P is generated. FIG. 6 shows a component of the obstacle detection apparatus to execute each processing in such order. In this component, computation cost for feature conversion can be reduced, and all processing is executed at high speed.
[0065]In general, if an exchange rule is not possible for two conversions (feature conversion, image conversion T), the processing results by two application orders (feature conversion→image conversion T, image conversion ...
modification example 2
[0069]The similarity calculation unit 108 generates a reduced image based on at least one reduction ratio for the image L, the image R and the image P. The reduction ratio is determined by a height, a width, or an area of the processing area. For example, the height and the width of an original image are respectively reduced by a half as the reduction ratio. In this case, an area of the reduced image is a quarter of an area of the original image. The similarity D and the similarity P are calculated for each processing area between two reduced images. By such processing, if a size of the processing area is large, the computation cost can be reduced.
modification example 3
[0070]The obstacle decision unit 109 detects the obstacle from the image by a threshold processing for the equation (7). An equation of the threshold processing is represented as follows. Kth(y)={0K(y)<ThK(y)K(y)≥Th(8)
[0071]However, as shown in graph “K” of FIG. 5C, the graph includes an extension (convex range) of which center is a position of the obstacle. Accordingly, if a following equation is satisfied for a range “y” (00), it is decided that the obstacle is not included in the range “y”. ∑y=0y0Kth(y)=0(9)
[0072]Furthermore, as for a range “y” from “0” to the maximum along y-axis direction, “y1” is searched to minimize a following equation. α∑y=0maxKth(y)-∑y=0y1Kth(y)(10)
[0073]In the equation (10), “α” is a constant (01” may be set as a position of the obstacle. In FIG. 5C, “y1” represents y-coordinate of the base of the processing area 522.
PUM
Abstract
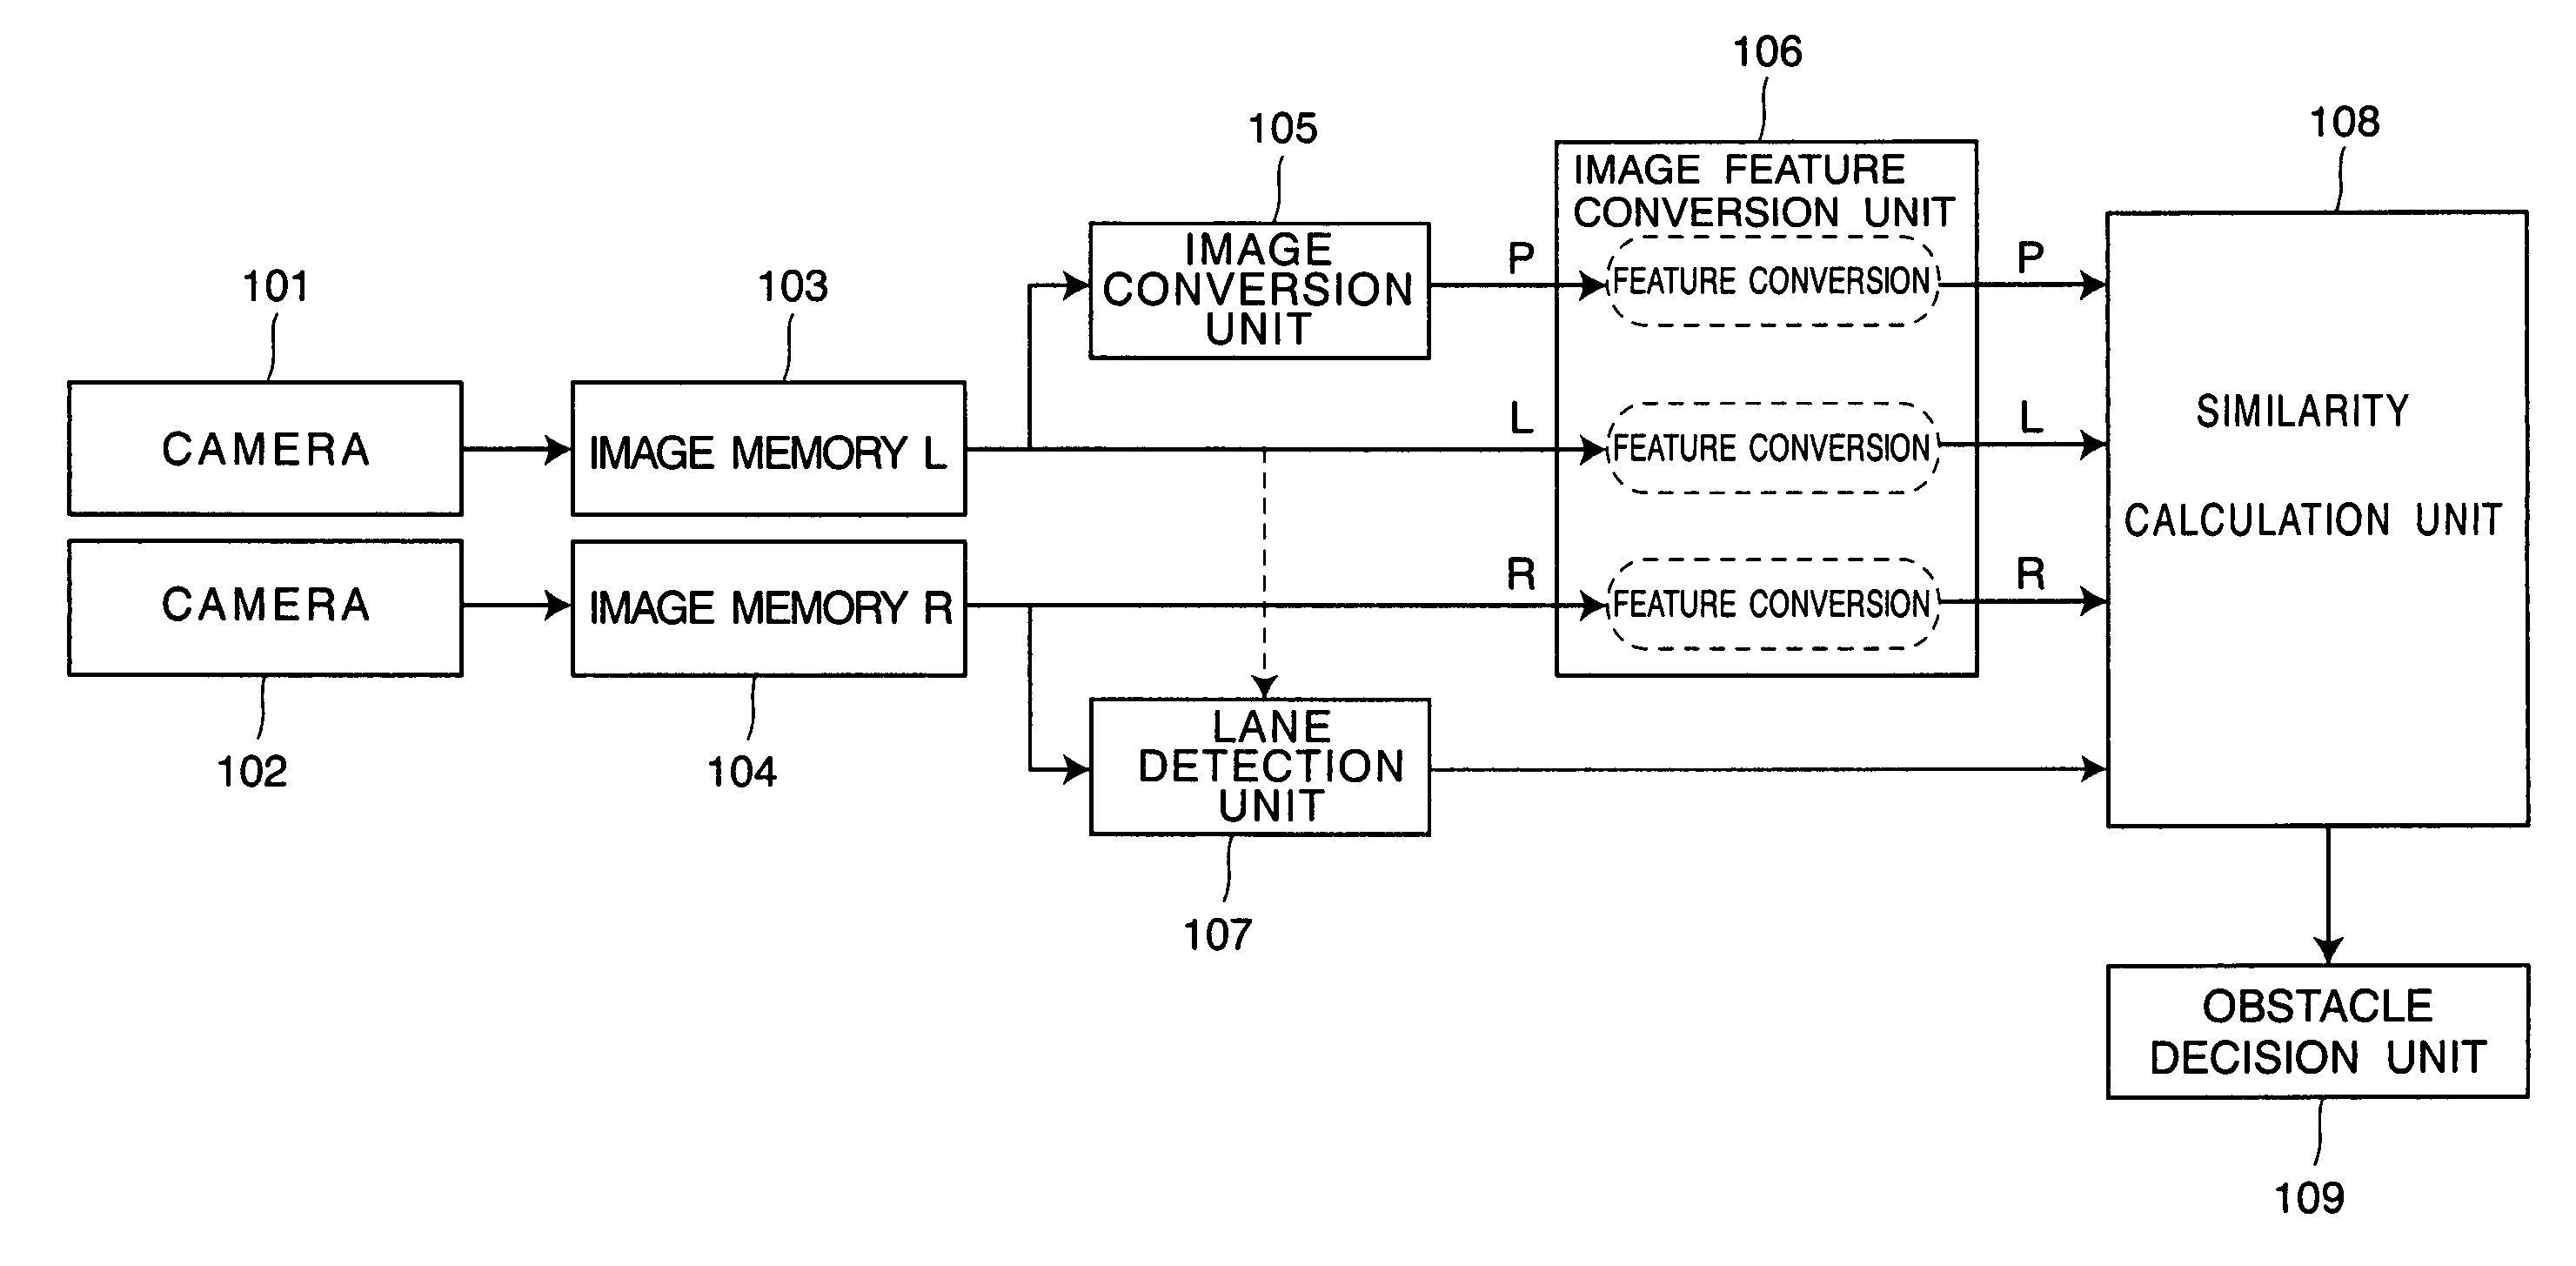
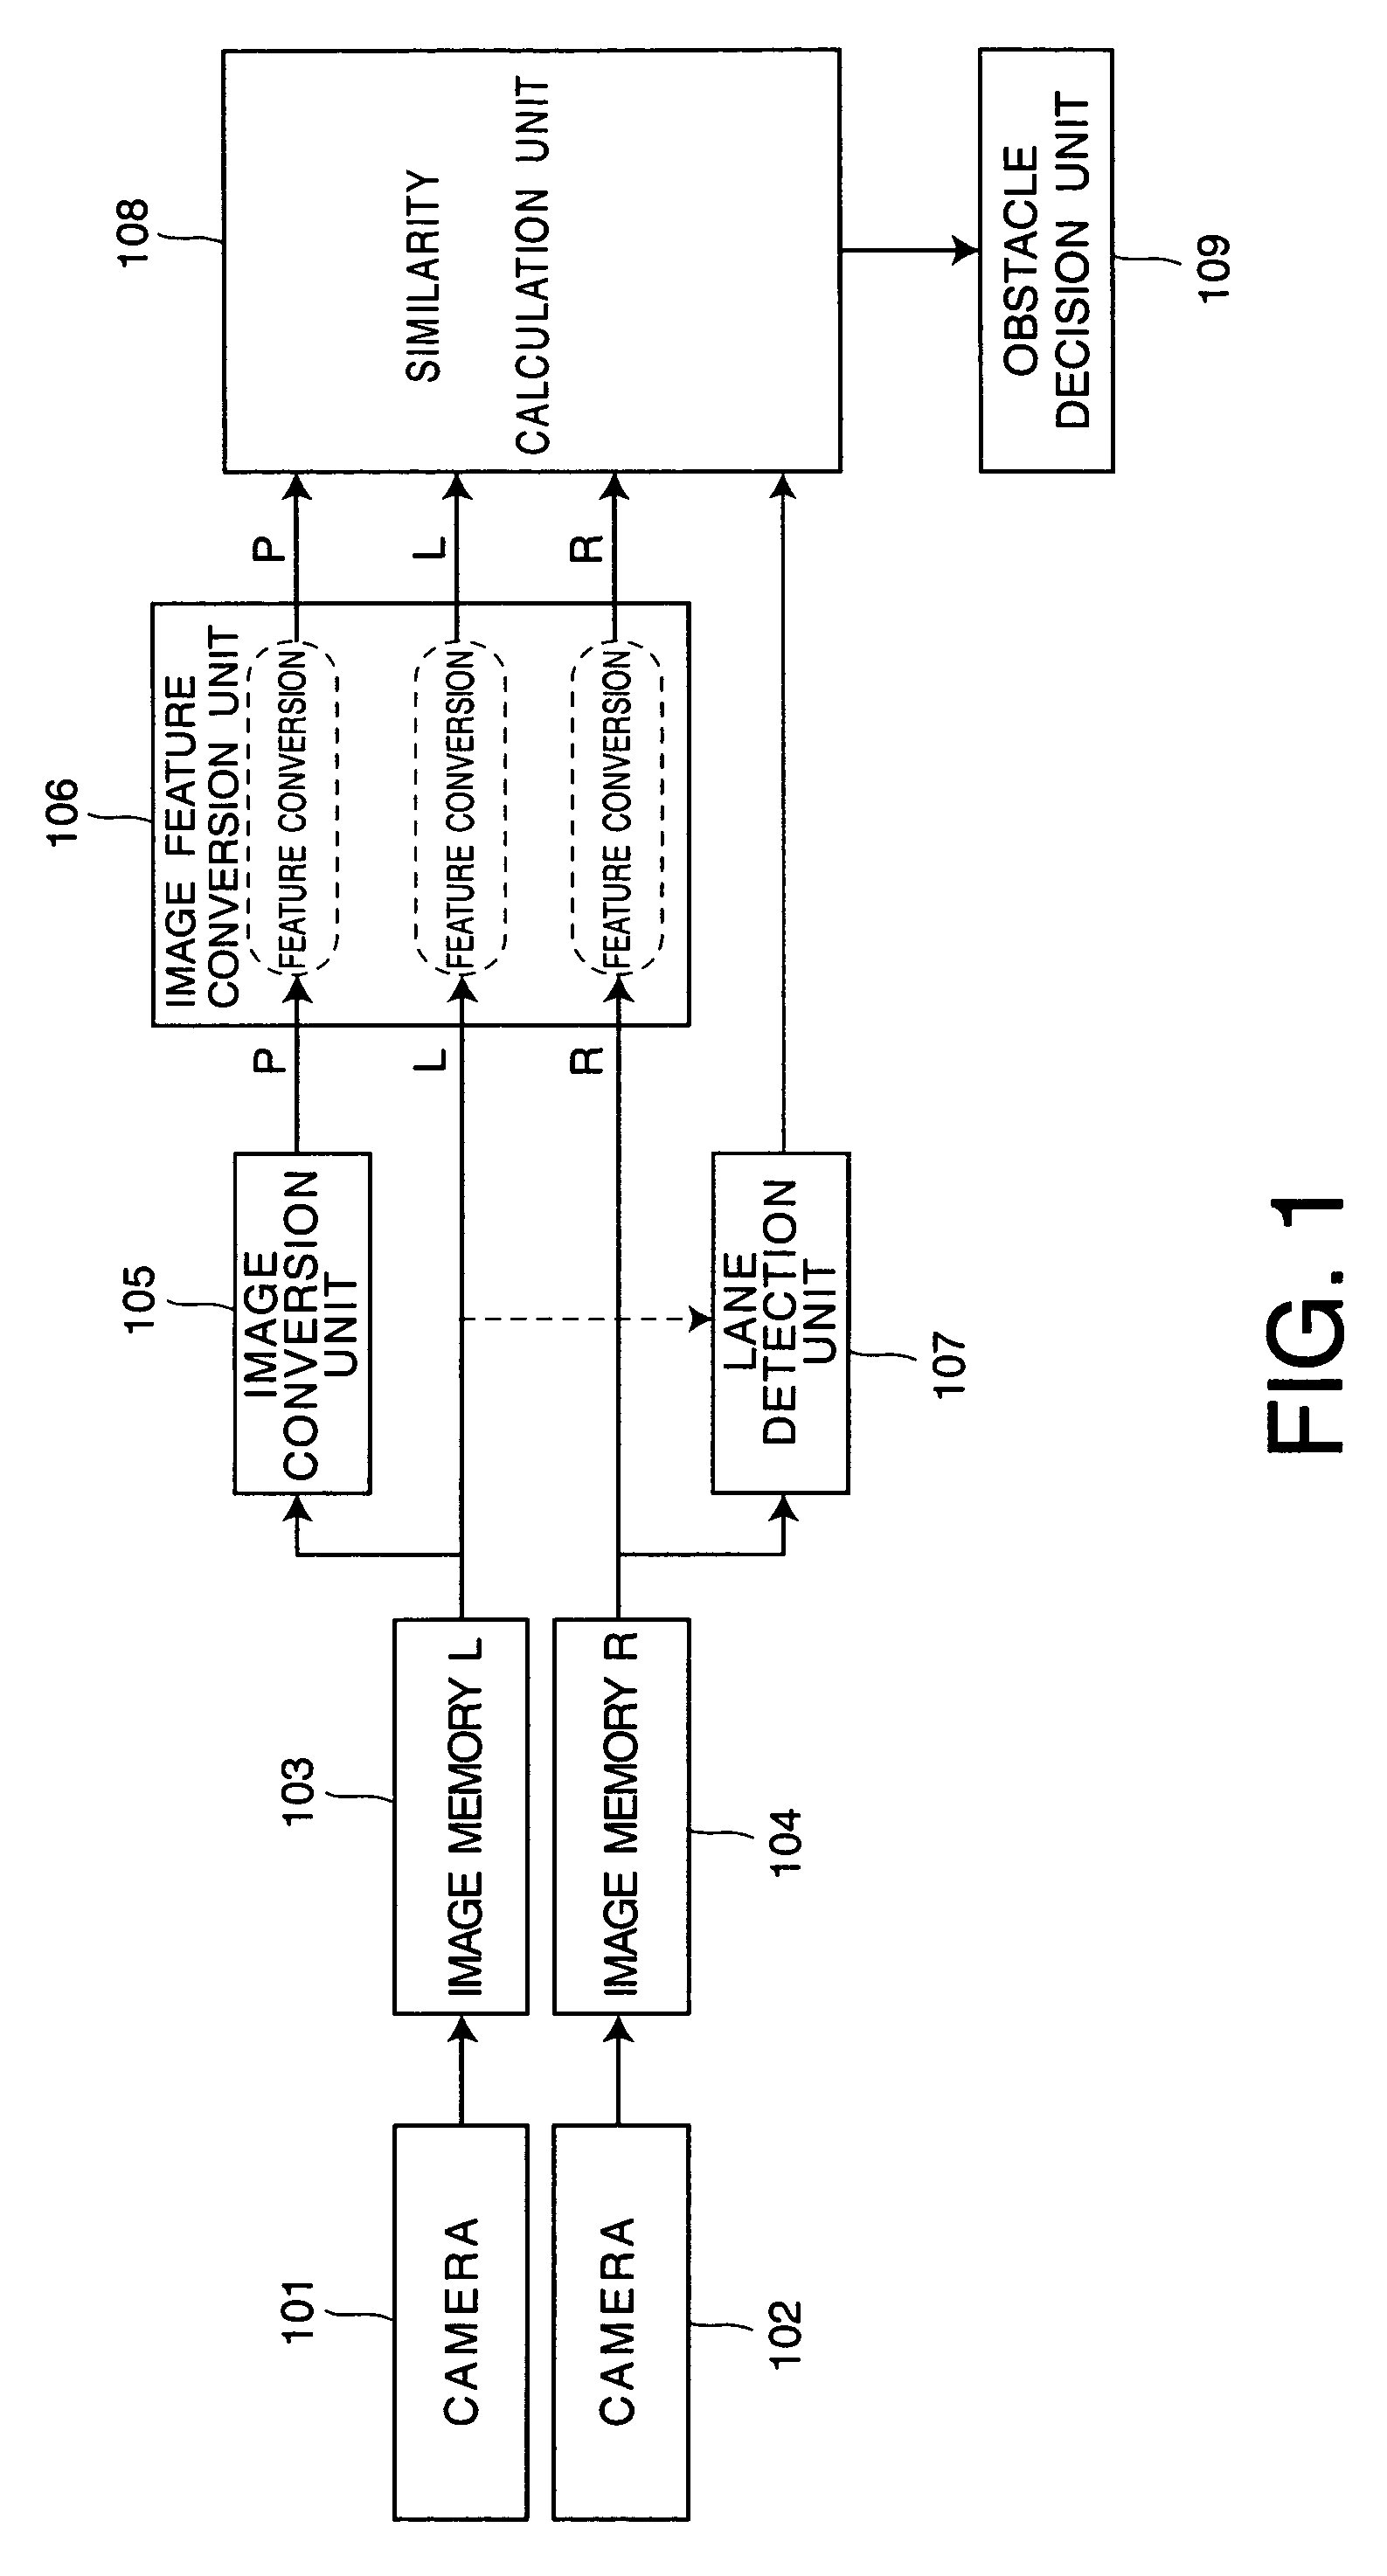
A stereo camera inputs a first image and a second image each including a predetermined plane. An image conversion unit projects each pixel of the predetermined plane from the first image onto a corresponding pixel of the second image as a third image. A feature conversion unit respectively emphasizes edges included in the first image, the second image and third image. A similarity calculation unit sets a plurality of areas on the predetermined plane from the second feature conversion image, calculates a first similarity between each area of the second feature conversion image and a corresponding area of the first feature conversion image, and calculates a second similarity between each area of the second feature conversion image and a corresponding area of the third feature conversion image. An obstacle decision unit detects an obstacle based on the first similarity and the second similarity.
Description
CROSS-REFERENCE TO RELATED APPLICATIONS[0001]This application is based upon and claims the benefit of priority from the prior Japanese Patent Application P2002-278422, filed on Sep. 25, 2002; the entire contents of which are incorporated herein by reference.FIELD OF THE INVENTION[0002]The present invention relates to an obstacle detection apparatus and method for detecting an obstacle existing on a road by using a pair of cameras.BACKGROUND OF THE INVENTION[0003]Common techniques to detect an obstacle typically use a laser or a supersonic wave, and a technique using a TV camera. The technique using the laser is typically expensive and not practical. The technique using the supersonic wave includes a problem for detection accuracy of the obstacle because resolution of the supersonic wave is usually low. Furthermore, in a single active sensor using the laser or the supersonic wave, a driving lane of a vehicle cannot be recognized.[0004]On the other hand, the TV camera is relatively ch...
Claims
Application Information
Patent Timeline
Application Date:The date an application was filed.
Publication Date:The date a patent or application was officially published.
First Publication Date:The earliest publication date of a patent with the same application number.
Issue Date:Publication date of the patent grant document.
PCT Entry Date:The Entry date of PCT National Phase.
Estimated Expiry Date:The statutory expiry date of a patent right according to the Patent Law, and it is the longest term of protection that the patent right can achieve without the termination of the patent right due to other reasons(Term extension factor has been taken into account ).
Invalid Date:Actual expiry date is based on effective date or publication date of legal transaction data of invalid patent.
