Real-time monitoring of service performance through the use of relational database calculation clusters

a relational database and cluster technology, applied in the field of real-time monitoring of service quality, can solve the problems of insufficient service platforms, difficult management, and difficulty in defining minimum quality standards, etc., and achieve the effect of improving service quality, improving service quality, and improving service quality

Inactive Publication Date: 2006-08-29
VALTRUS INNOVATIONS LTD +1
View PDF10 Cites 131 Cited by
  • Summary
  • Abstract
  • Description
  • Claims
  • Application Information

AI Technical Summary

Benefits of technology

[0015]The use of calculation clusters permits timely calculation of parameters for a very flexible service model. Advantageously, the service model is technology-neutral, and can be customized to represent any telecommunications-related service. Hence, a user can define the service characteristics during the service development. This includes breaking the service down into components, defining associated performance parameters, and defining performance objectives for the service.

Problems solved by technology

The sheer size of the telecommunications infrastructure makes it difficult to manage.
The complexity of the telecommunications technology often makes the specification of the minimum quality standard a challenging affair.
One of their existing challenges is to minimize the delay between creation and roll-out of new added-value services.
Existing service platforms, which depend on technology-specific software development, are inadequate.
The existing platforms, which only provide customers with dedicated resources, will be unable to compete.
These models are directed at service level assurance for the provider, and are unsuitable for monitoring individual customer QoS.
Further, this approach requires that service models for new technologies be developed from scratch, and the resulting heterogeneity of tools required to monitor the different services and / or different steps of the service lifecycle and / or different data required to compute the service status (faults, performance data) guarantees inefficiency and confusion.

Method used


Image

  • Real-time monitoring of service performance through the use of relational database calculation clusters
  • Real-time monitoring of service performance through the use of relational database calculation clusters
  • Real-time monitoring of service performance through the use of relational database calculation clusters

Examples


Embodiment Construction

[0029]First, a brief note about terminology. In this document, the term “customer” is used to refer to companies that contract with the telecommunications entity for services. For example, customers may be voice-mail providers or internet access providers. Further, as used herein, the term “real time” means that the effect of measurements received by the system are propagated through to the system outputs in less than five minutes. “Near-real-time” means that the effect of these measurements are propagated through the system in less than twenty minutes, but no less than 5 minutes. “Batch” processing means that the system periodically calculates the effect of the measurements, typically on an hourly or daily basis.

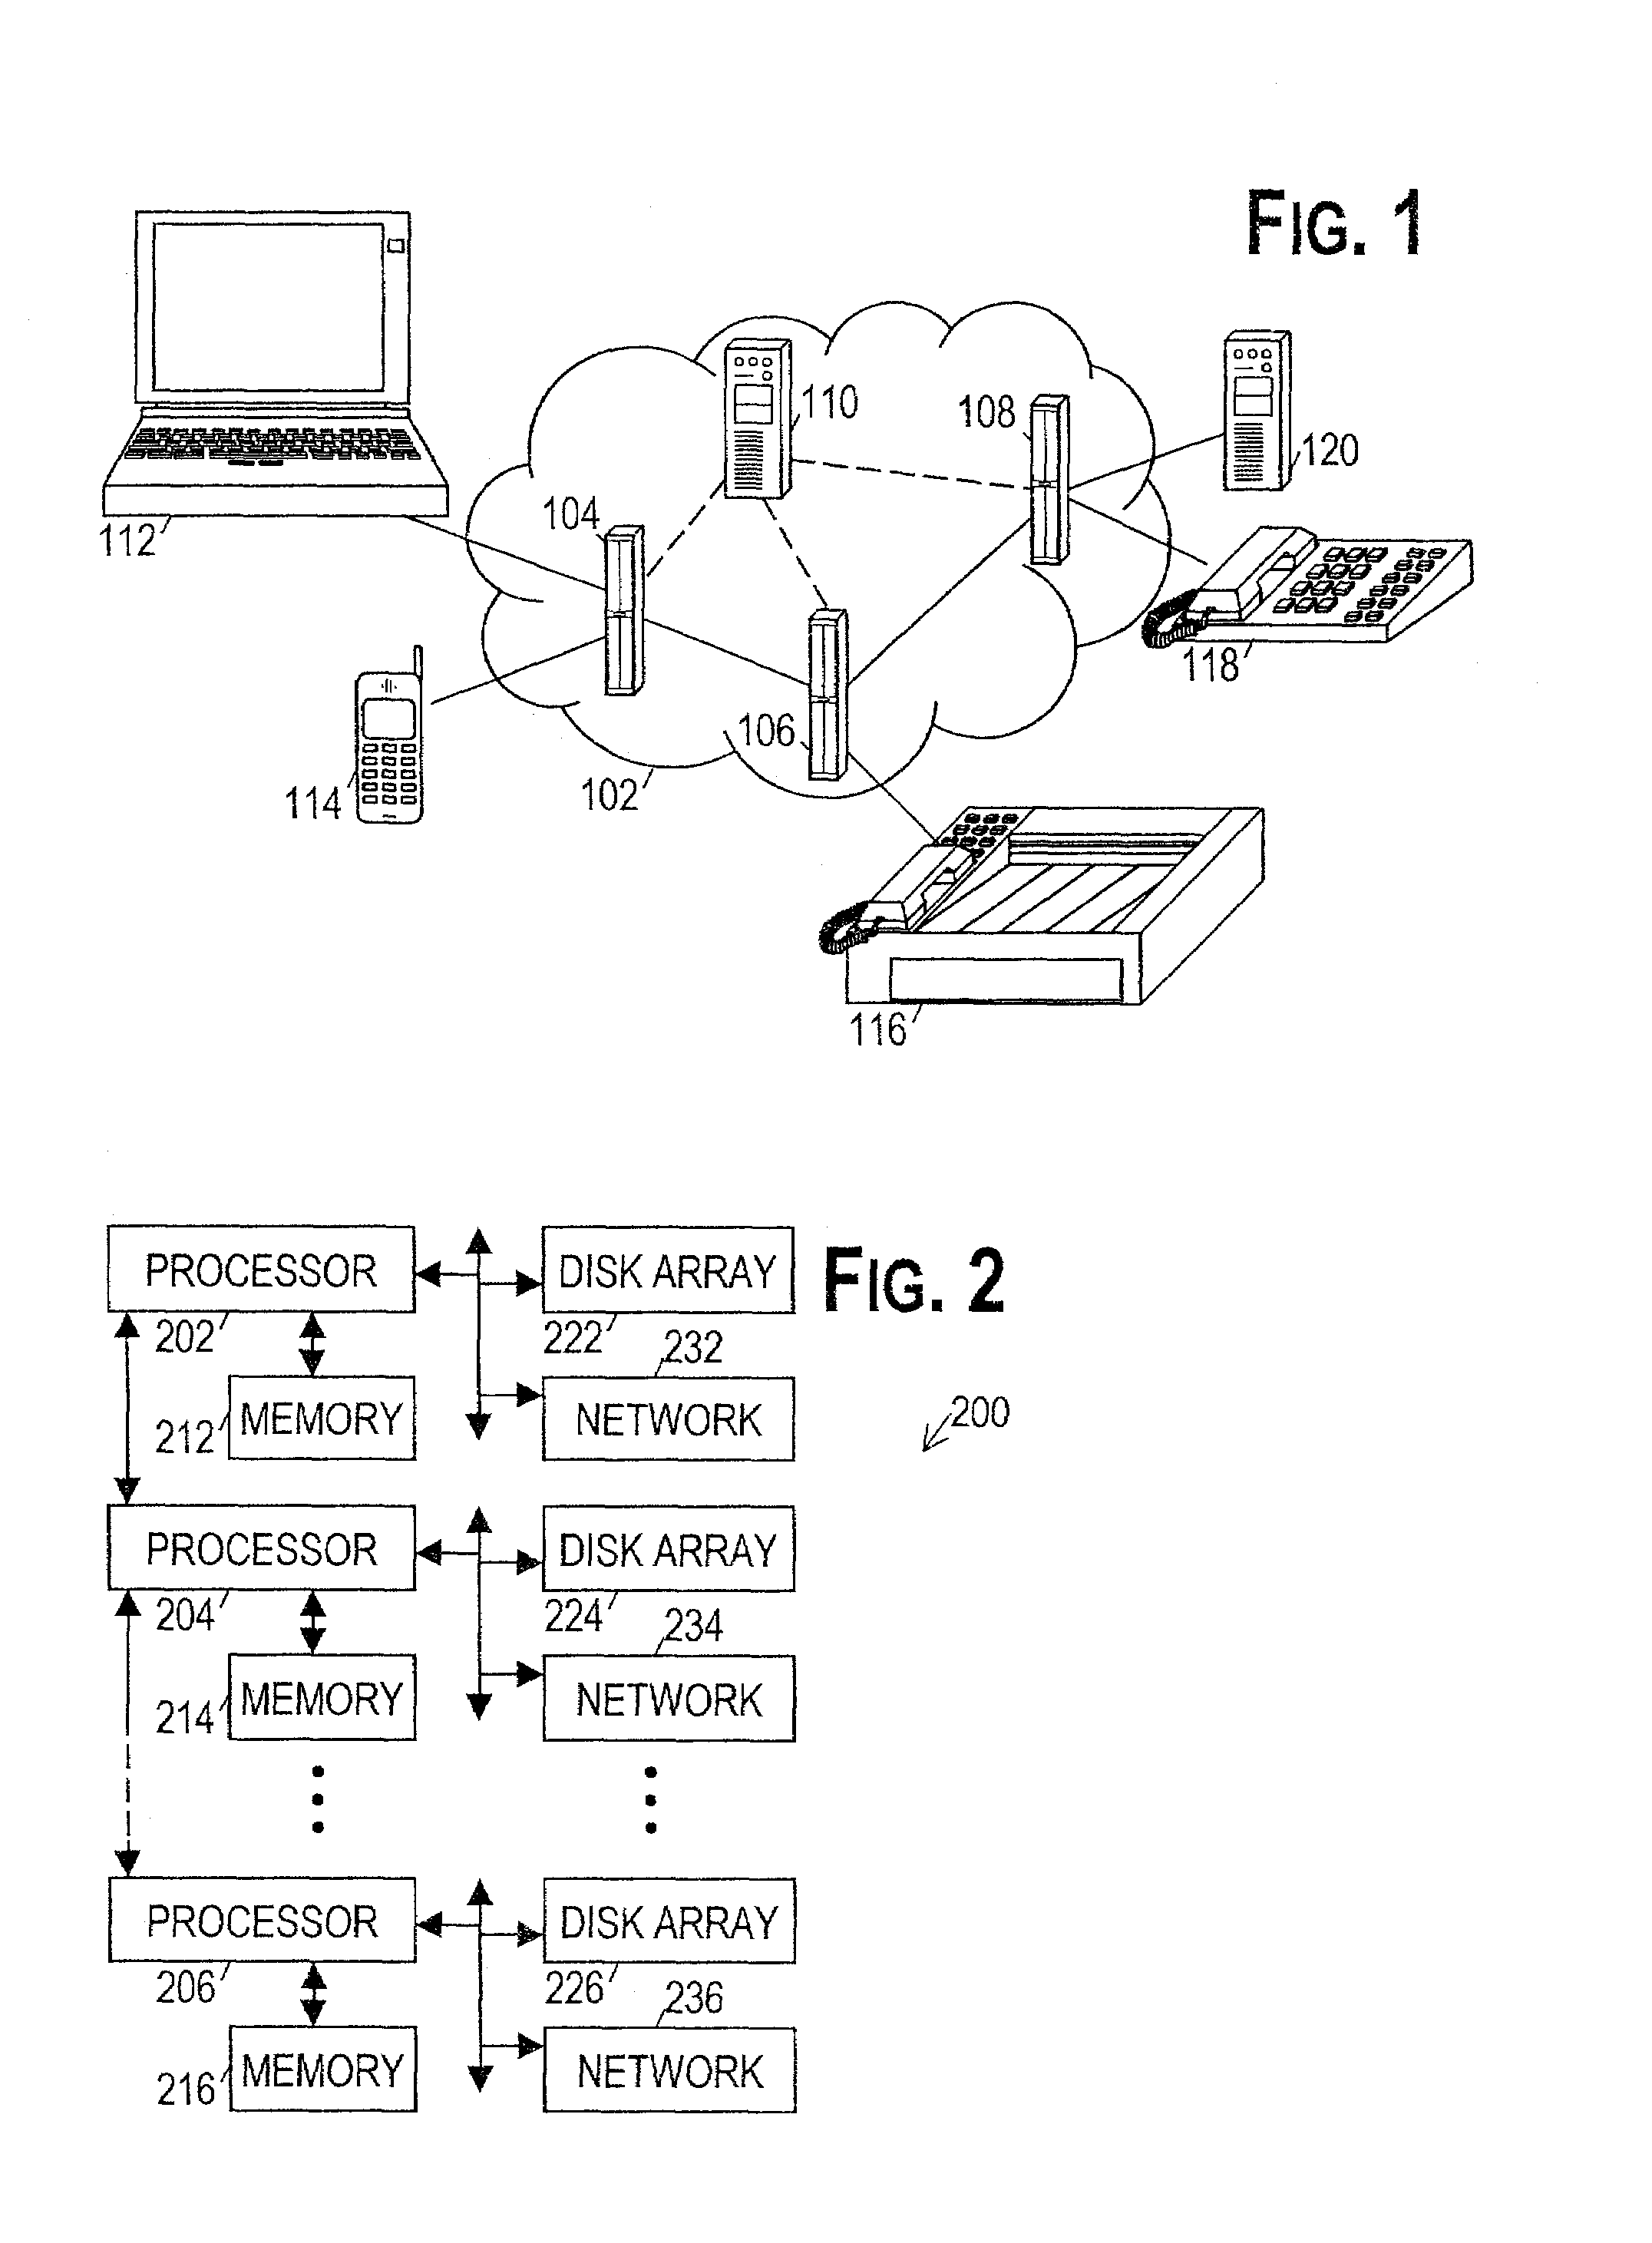
[0030]Turning now to the figures, FIG. 1 shows a telecommunications network 102 having a set of switches 104, 106, 108 that route signals between various devices 112, 114, 116, 118 and resources 120. The network elements are coupled together by communications links, which m...


PUM


Abstract

A system and method for monitoring service performance are disclosed. In a preferred embodiment, the method comprises: (a) collecting service information from one or more sources in a telecommunications network; (b) converting the service information into values of primary parameters of a service model; and (c) calculating values of secondary parameters of the service model from the primary parameter values, wherein the calculating is performed using relational database tables based on calculation clusters. The calculation clusters are preferably determined from a hierarchical model of the service by dividing the hierarchy in a manner that separates shared service components from the service components that share them, and that separates service components related by 1-to-n and n-to-1 relationships.

Description

CROSS-REFERENCE TO RELATED APPLICATIONS[0001]This application claims priority to European Patent Application No. 01403342.7, filed Dec. 21, 2001.STATEMENT REGARDING FEDERALLY SPONSORED RESEARCH OR DEVELOPMENT[0002]Not applicable.BACKGROUND OF THE INVENTION[0003]1. Field of the Invention[0004]This invention generally relates to systems and methods for Quality of Service management. More specifically, this invention relates to an improved system for providing real-time monitoring of service quality.[0005]2. Description of the Related Art[0006]The field of telecommunications is evolving. Telecommunications networks began as lines of signaling towers that visually relayed messages from tower to tower. The invention of the telegraph led to electrical communication over wires strung between the transmitter and receiver. Switching techniques were then created to allow a given wire to be used for communication between different transmitters and receivers. What really fueled the expansion of...

Claims


Application Information

Patent Timeline
Patent Type & Authority Patents(United States)
IPC IPC(8): G06F17/30H04L12/24
CPCH04L41/145H04L41/5048H04L41/5054H04L41/22H04L41/5003H04L41/5009Y10S707/922Y10S707/99945Y10S707/956Y10S707/959Y10S707/954
Inventor TACAILLE, OLIVIEREYNARD, FREDERICLAYE, CHRISTOPHE T.
Owner VALTRUS INNOVATIONS LTD
Why Eureka
Try Eureka