
Formatting object for modifying the visual attributes of visual objects to reflect data values

a technology of visual attributes and formatting objects, applied in the field of system and method for visually conveying information, can solve the problems of large and complex table, difficult to emphasize certain entries within standard tables, and difficult to emphasize entries within standard charts

Inactive Publication Date: 2007-02-13
MICROSOFT TECH LICENSING LLC
View PDF8 Cites 7 Cited by
  • Summary
  • Abstract
  • Description
  • Claims
  • Application Information

AI Technical Summary

Benefits of technology

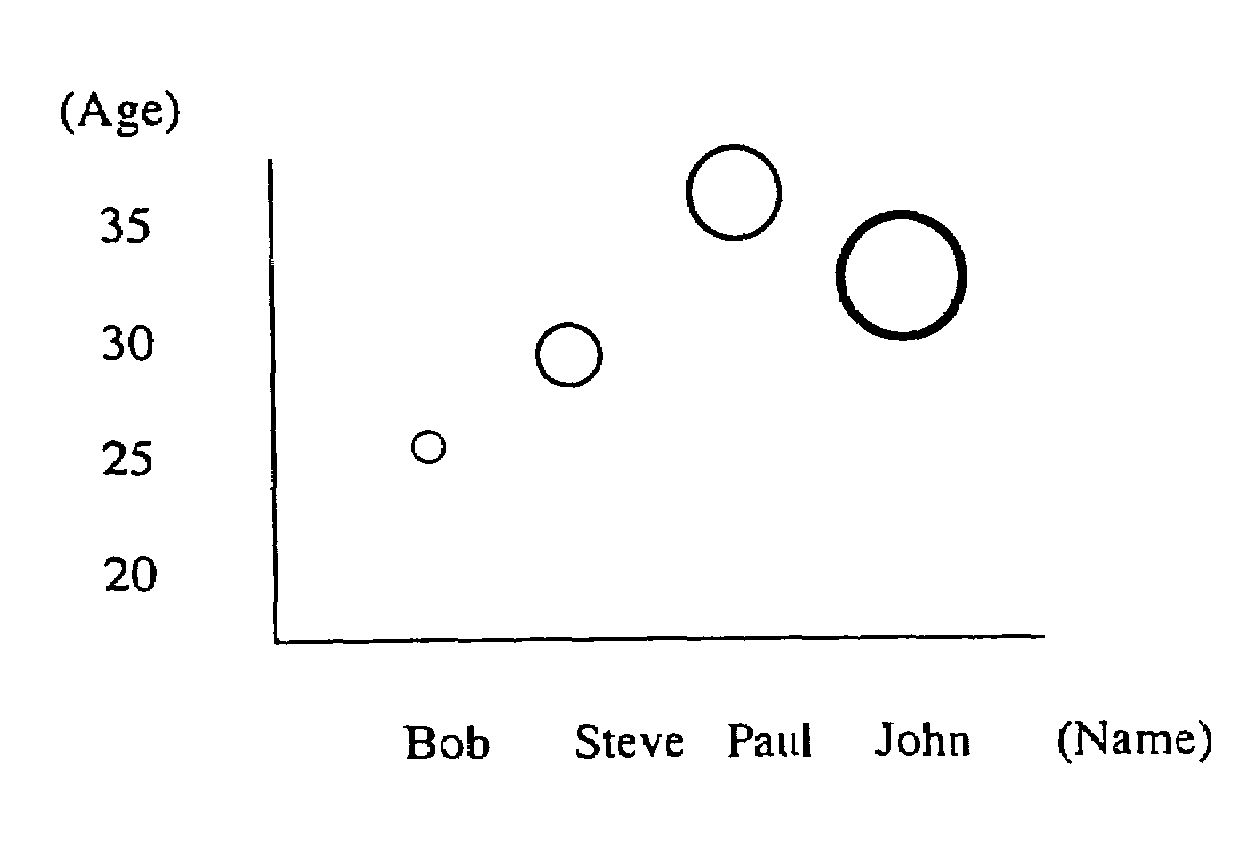
The present invention is a method for visually conveying information using the attributes of characters or markers in a table or chart. It emphasizes data points that meet certain criteria by modifying the visual attributes of characters or markers within the table or chart. The invention can also increase information density within a chart by using multiple mapping segments with different boundary values to visually express the relationships between variables. The invention uses a formatting object that defines mapping segments with boundary values and applies interpolation techniques to determine visual attributes for data values. The boundary values can be real numbers or percentages, and the mapping segments can have equal or mixed types of boundary values. The invention allows for the flexible and effective representation of data values in a visually appealing way.

Problems solved by technology

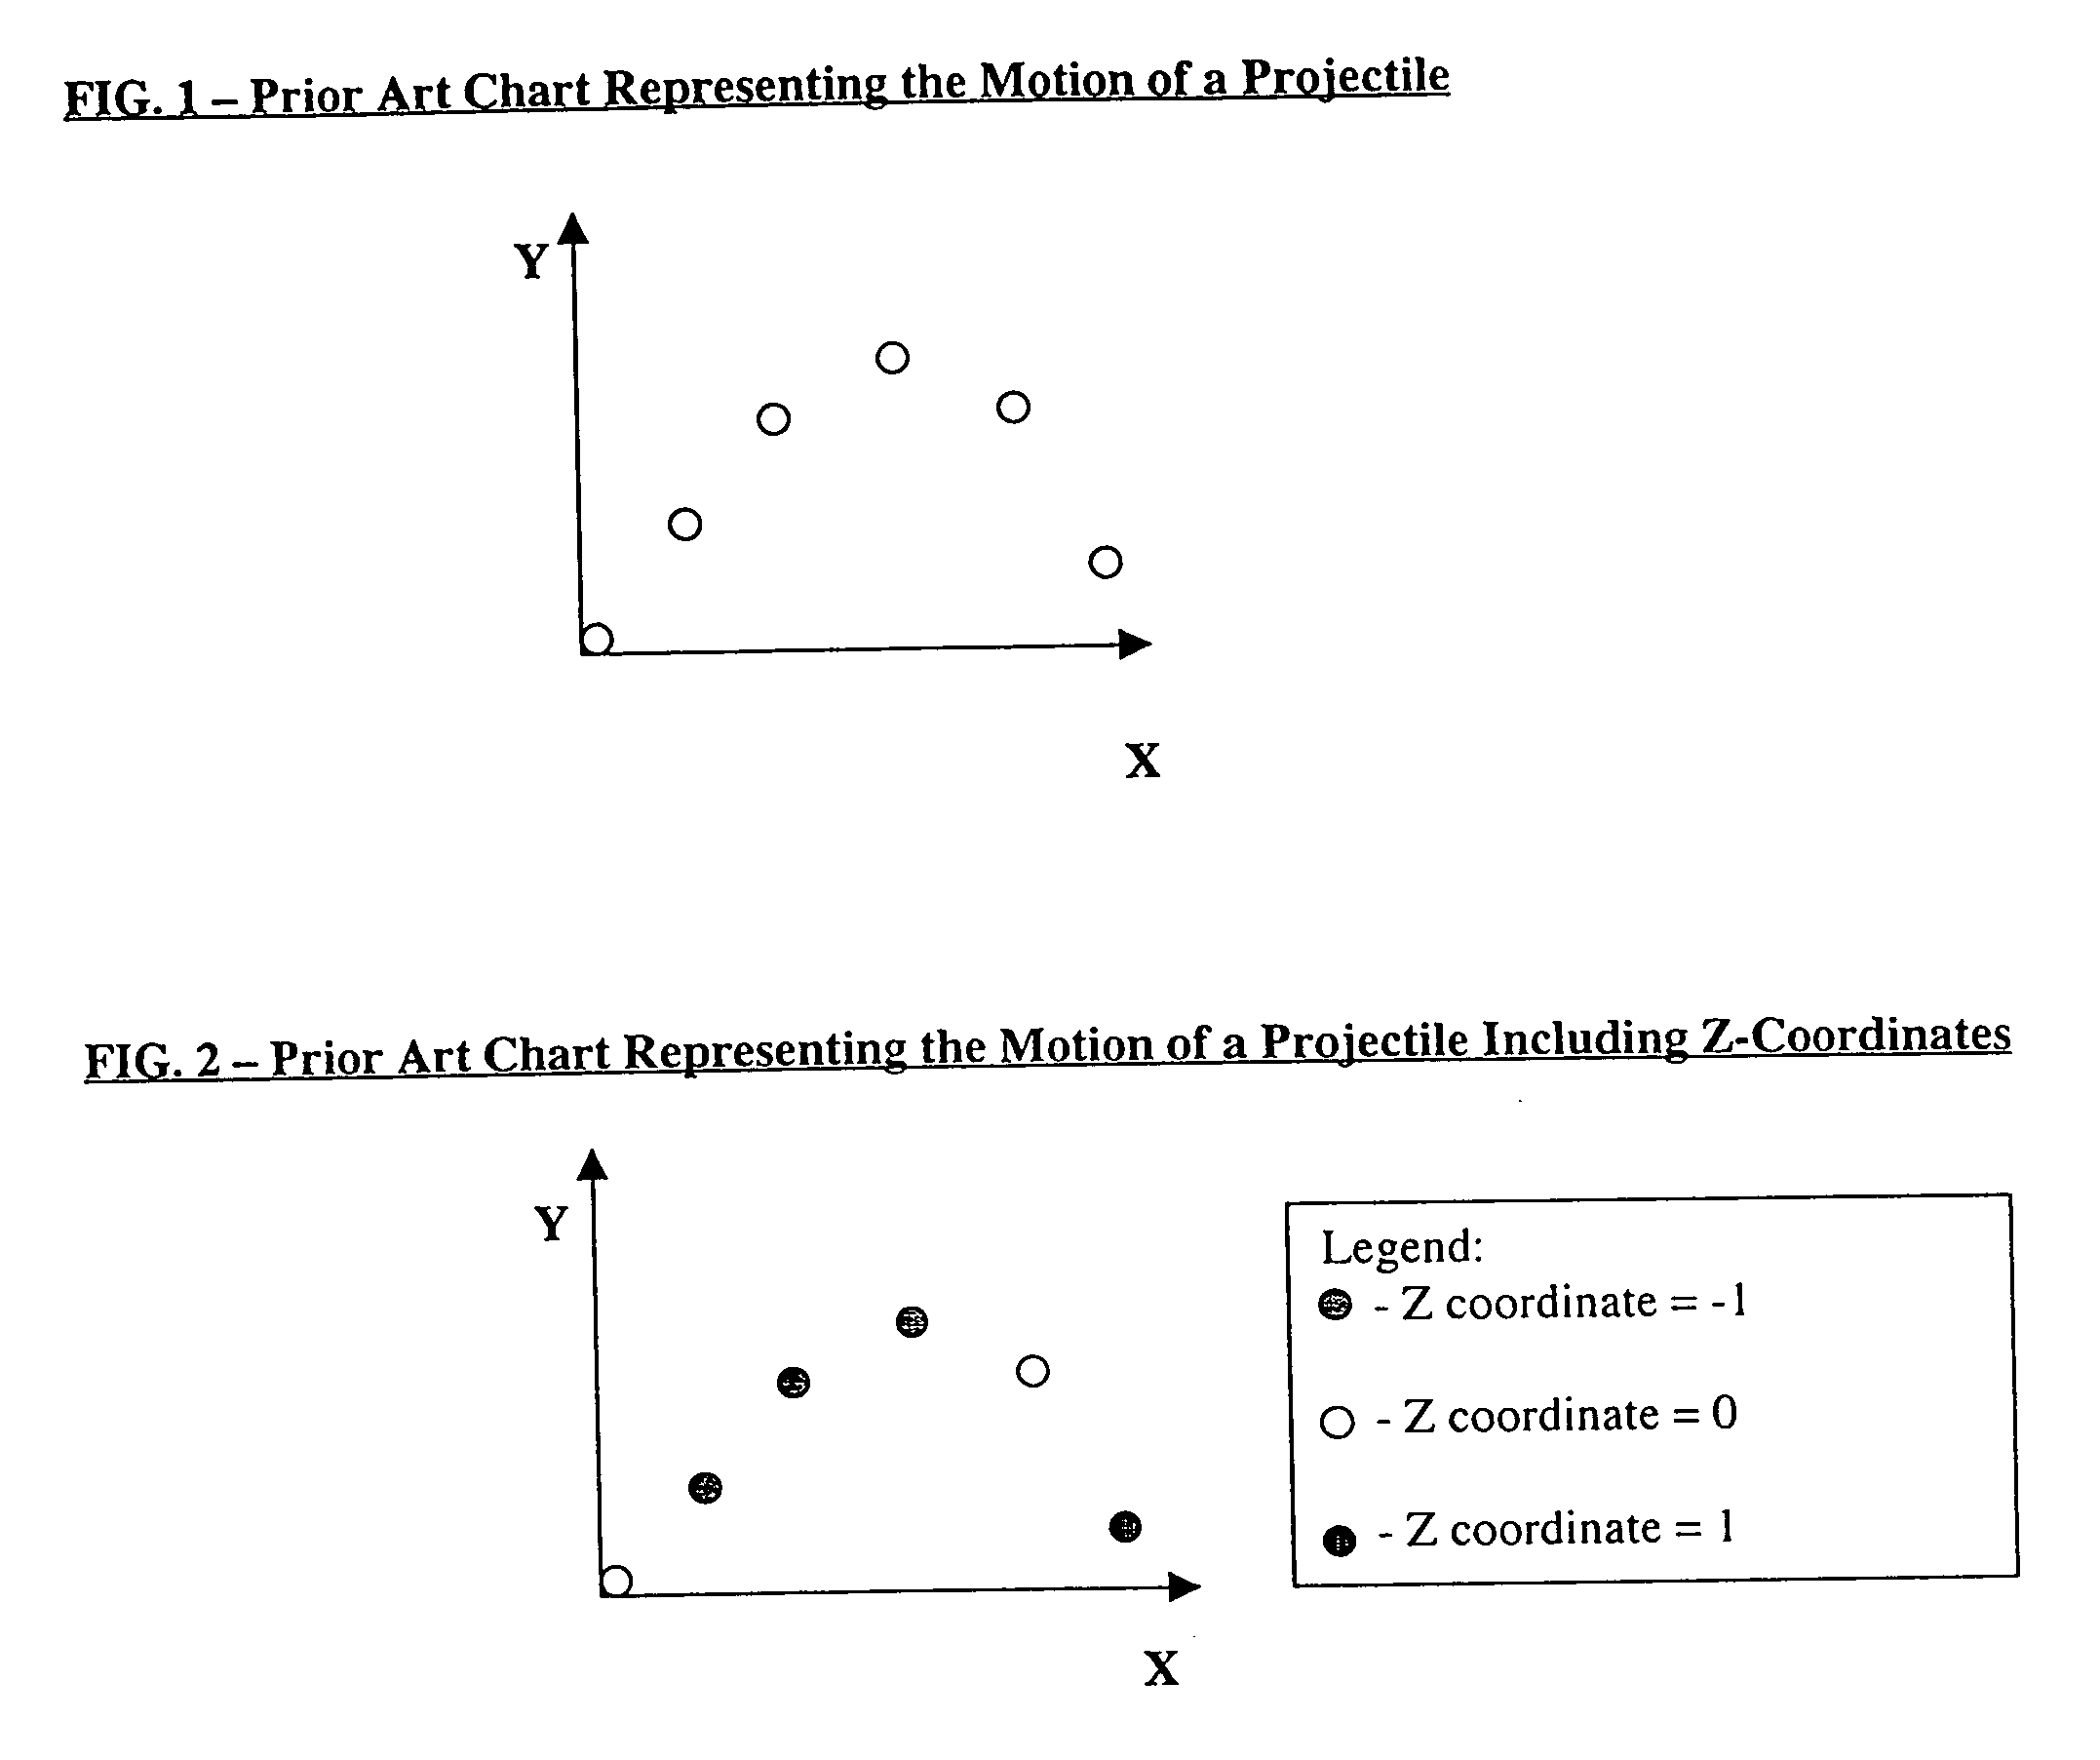
Thus, it is difficult to emphasize certain entries within standard tables.
Thus, it is also difficult to emphasize entries within standard charts.
The disadvantage of this technique is that it makes the table larger and more complex than a table having fewer columns.
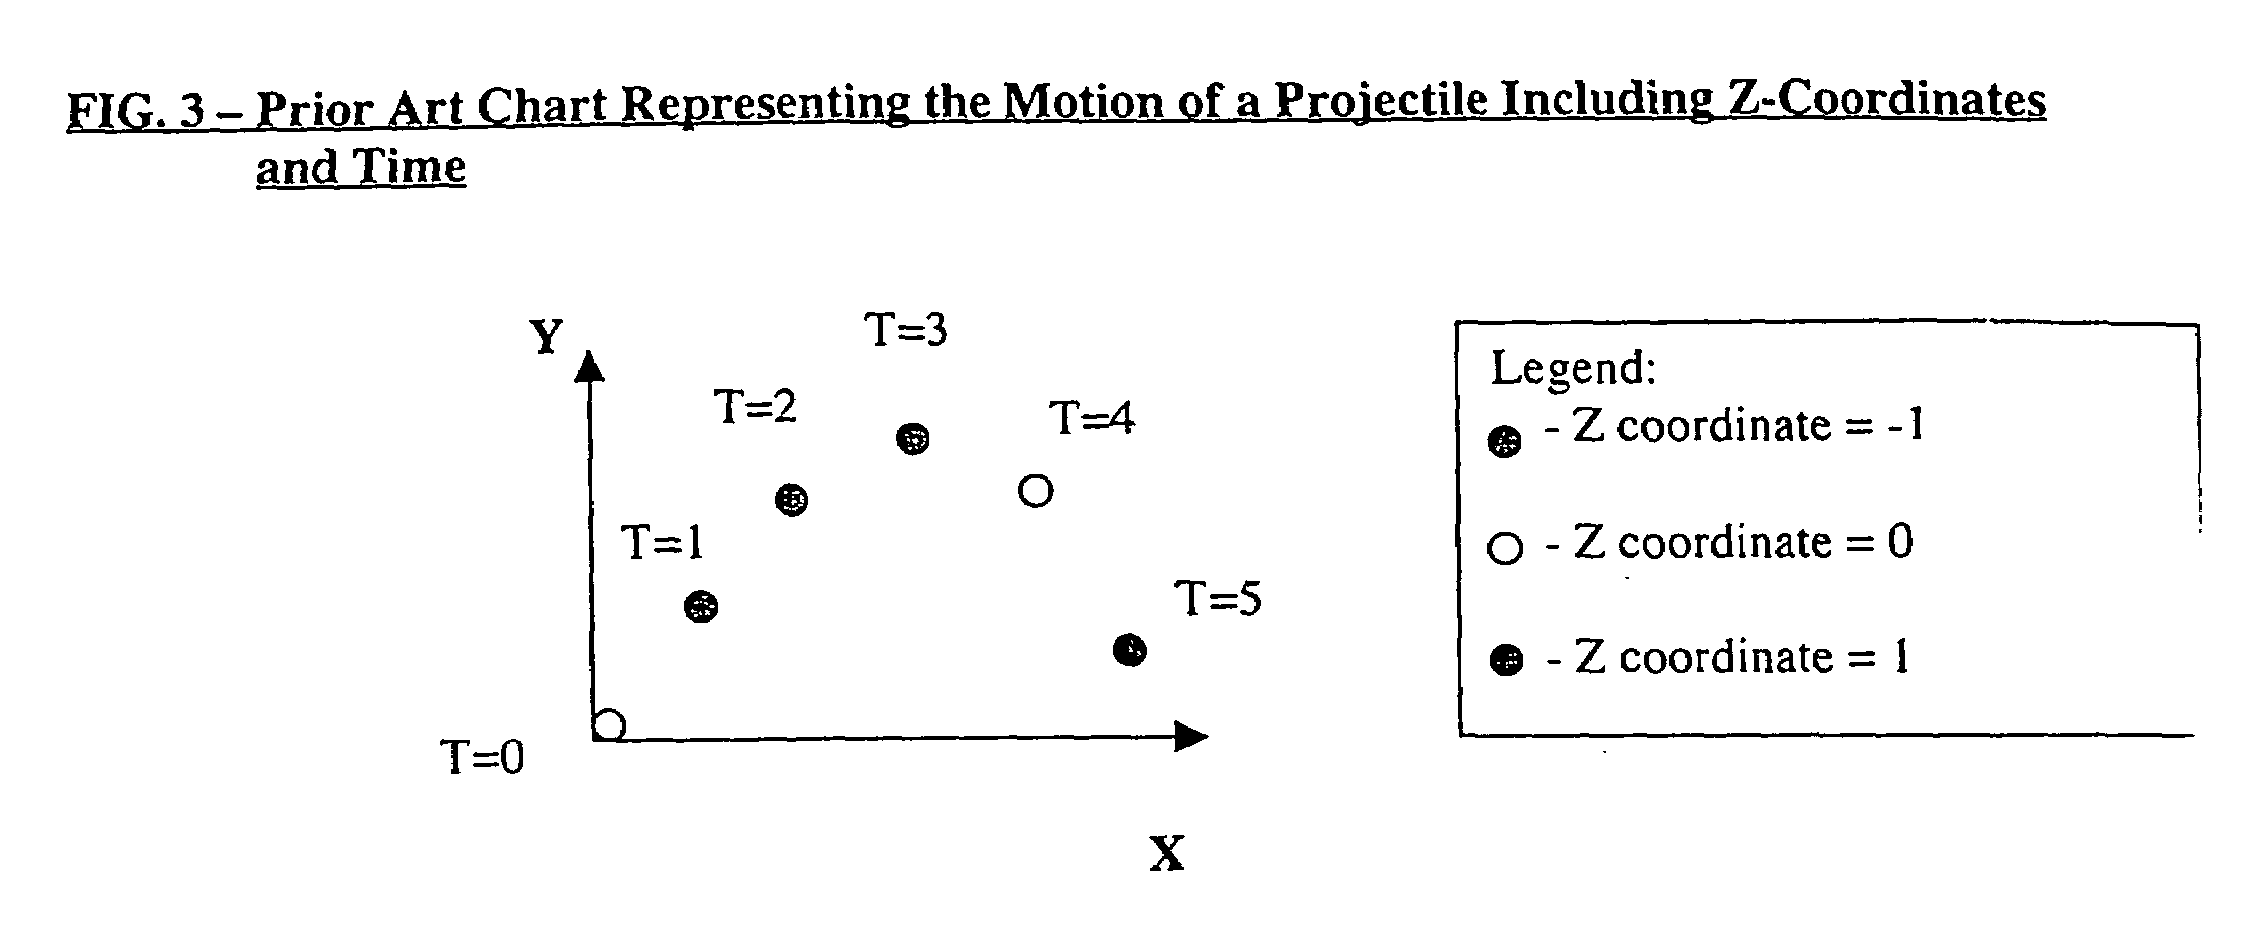
Authors have not been successful in developing an elegant technique for displaying the relationships between four or more interdependent variables in a two-dimensional chart.
However, such a technique causes charts to be cluttered and difficult to read.

Method used


Image

  • Formatting object for modifying the visual attributes of visual objects to reflect data values
  • Formatting object for modifying the visual attributes of visual objects to reflect data values
  • Formatting object for modifying the visual attributes of visual objects to reflect data values

Examples


Embodiment Construction

[0040]The present invention is directed to a method and a computer readable medium for modifying the visual attributes of visual objects to reflect data values. Such visual attributes include color and structural visual attributes (all visual attributes other than color). Structural visual attributes include such attributes as, for example, fill type, border width, line width, line style, font size, marker size and marker type.

[0041]The present invention may be implemented as a formatting object that is employed in conjunction with an application program that is capable of displaying visual representations of data, such as charts and graphs. In an exemplary embodiment of the invention, the formatting object is embodied in a dynamic-link library (DLL) that is used in conjunction with a spreadsheet program such as “MICROSOFT EXCEL”, which is published by the Microsoft Corporation of Redmond, Wash. In an alternative embodiment of the invention, the formatting object is be embodied dire...


PUM


Abstract

A formatting object according to the present invention conveys information to the reader of a document (such as a table or chart) by associating visual attributes (such as color, fill type, border width, line width, line style, font size, marker size and marker type) to characters or markers within the document. The formatting object may be used to emphasize data within a table or a chart by modifying the structural visual attributes of characters or markers within the table or chart according to pre-defined criteria. Similarly, the formatting object may be used to increase information density within a table or chart, and to elegantly represent the relationships between four or more interrelated variables in a two-dimensional chart. The formatting object accomplishes this by defining at least one format map that comprises one or more mapping segments. Each mapping segment includes a beginning boundary value, an ending boundary value, at least one beginning visual attribute corresponding to the beginning boundary value, and at least one ending visual attribute corresponding to the ending boundary value. The formatting object uses the information within the format maps, in combination with interpolation techniques, to determine one or more visual attributes that correspond to data points falling within the various mapping segments. The formatting object then expresses the data values by applying the appropriate visual attribute to a visual object displayed on a computer screen.

Description

RELATED APPLICATION[0001]This application of prior U.S. patent application Ser. No. 09 / 596,604, entitled “Formatting Object For Modifying The Visual Attributes Of Visual Objects To Reflect Data Values,” filed Jun. 19, 2000, which is hereby incorporated herein by reference in its entirety.TECHNICAL FIELD[0002]The present invention relates generally to a system and method for visually conveying information and more particulary to a system and method for conveying information by modifying the visual attributes of visual objects to reflect the value of one or more variables.BACKGROUND[0003]Individuals often have the need to visually convey information to others. In the past, standard tables and charts have been used to express such information. A standard table consists of a systematic arrangement of rows and columns of interrelated data. An example of such a table is shown below in Table 1.[0004]TABLE 1Motion of a ProjectilePosition on XPosition on YAxis (ft)Axis (ft)001426374653[0005]...

Claims


Application Information

Patent Timeline
Patent Type & Authority Patents(United States)
IPC IPC(8): G06T11/20G06F15/00G06F15/167
CPCG06F15/16
Inventor DAVIS, RANDALLCOUCKUYT, JEFFDAVIES, PAUL
Owner MICROSOFT TECH LICENSING LLC
Learn More