Program and method for displaying a radar chart

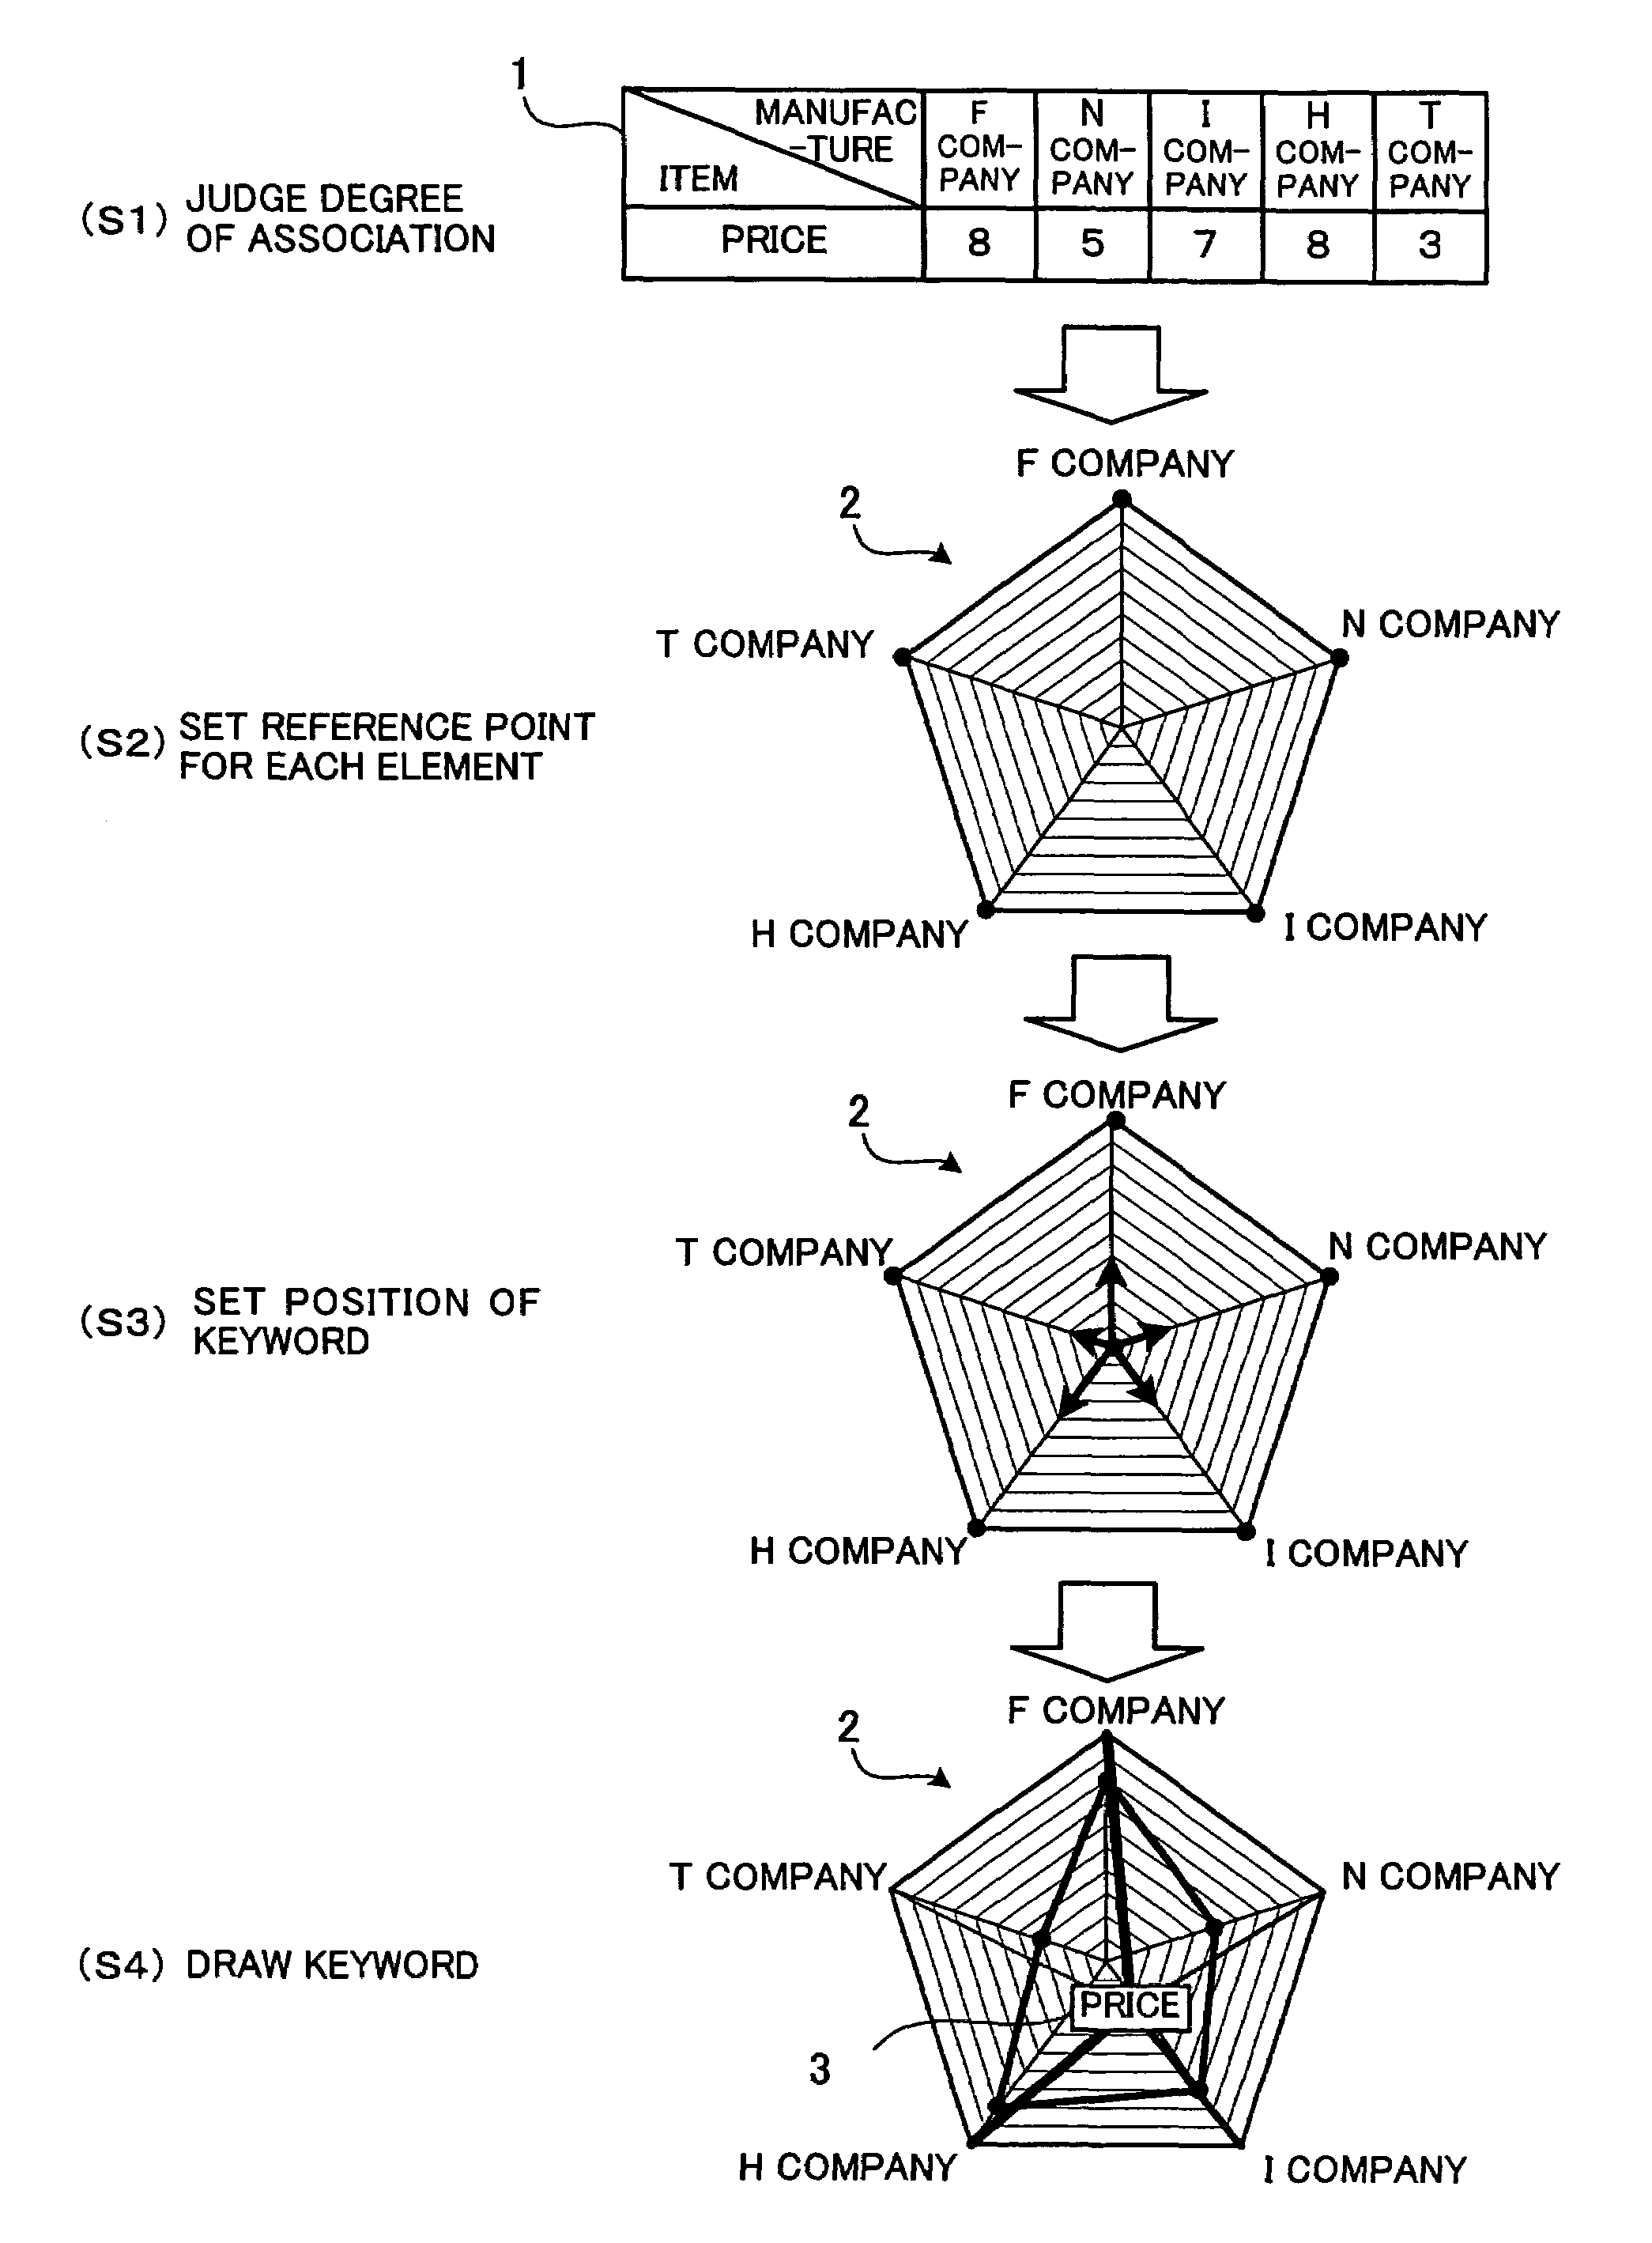
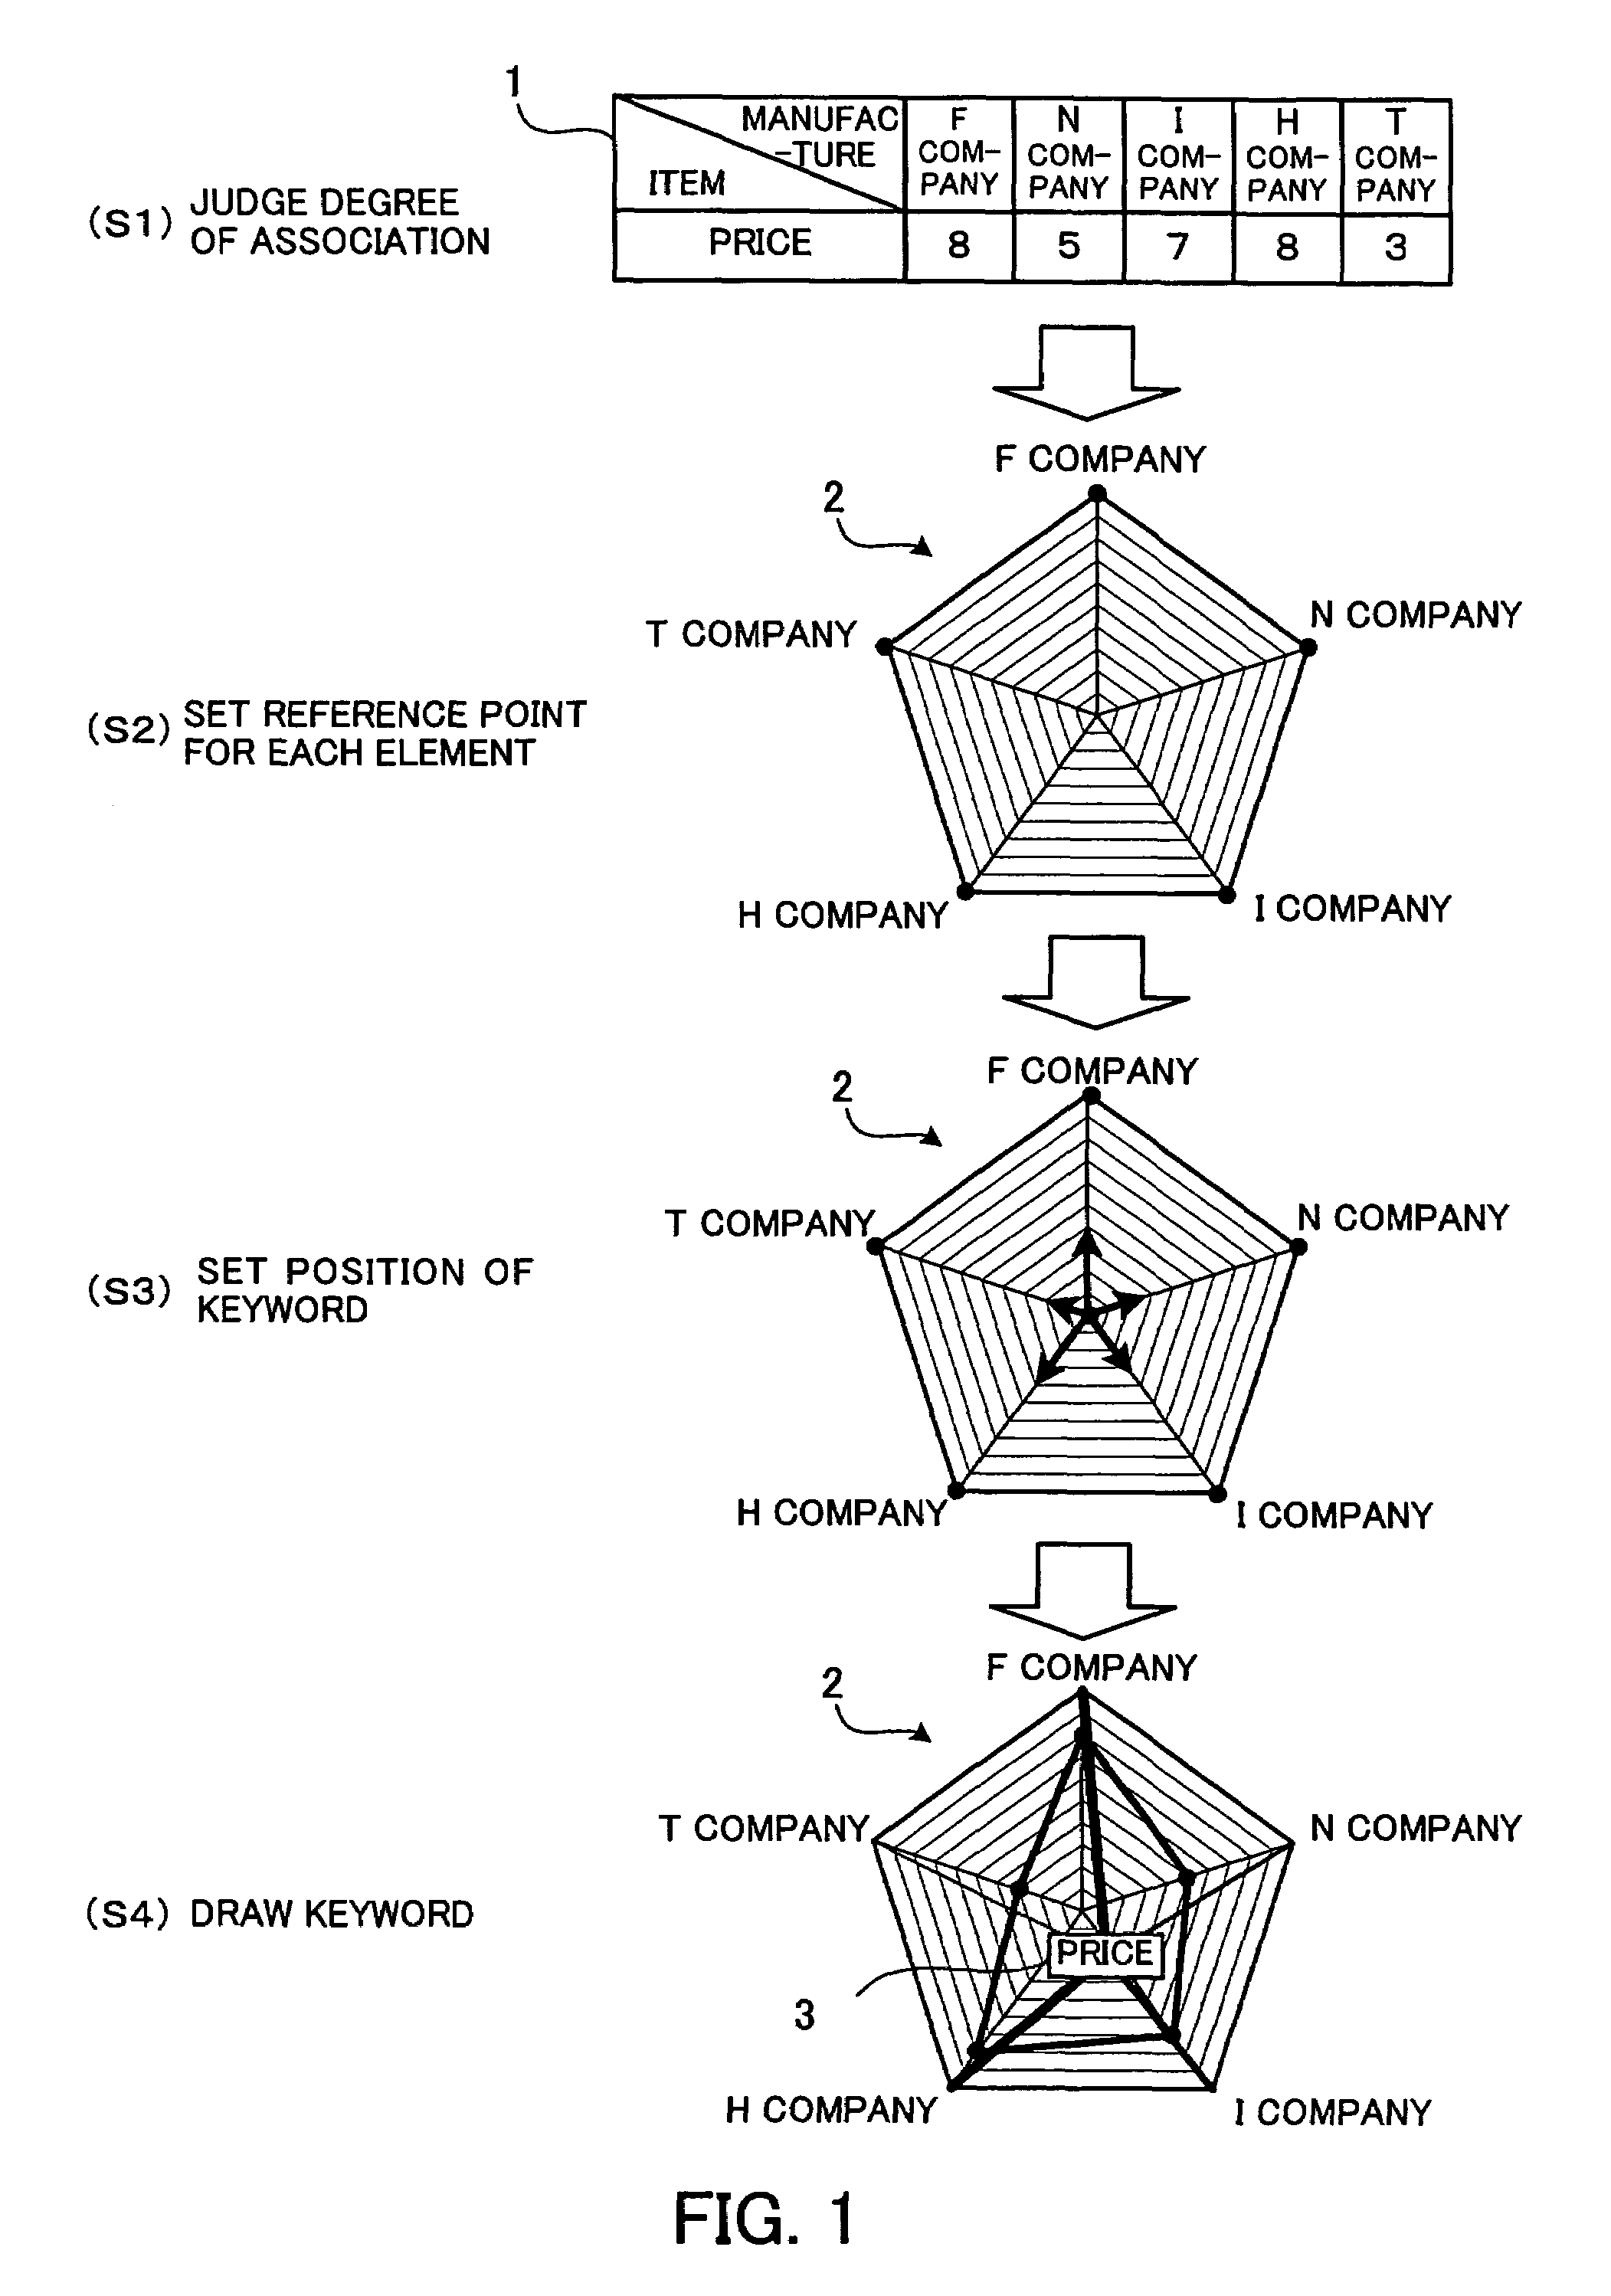
a radar chart and program technology, applied in the field of program and method for displaying radar charts, can solve the problems of poor visibility, difficult to compare items in detail, and difficult to use them for comparing statistical properties of a plurality of items

Inactive Publication Date: 2007-10-30
FUJITSU LTD
View PDF4 Cites 12 Cited by
  • Summary
  • Abstract
  • Description
  • Claims
  • Application Information

AI Technical Summary

Benefits of technology

[0013]In order to achieve the above object, a program for displaying a radar chart on the screen of a display unit is provided. This program causes a computer to perform the processes of judging a degree of association between each of a plurality of axial labels and at least one arranged keyword on the basis of data indicative of the relationship between each of the plurality of axial labels and the arranged keyword, assigning the plurality of axial labels to a plurality of axes on a radar chart and setting a reference point for the assigned axial label on each of the plurality of axes, setting a display position for the arranged keyword at a location nearer to a reference point for an axial label the degree of association of which with the arranged keyword is relatively high than to a reference point for an axial label the degree of association of which with the arranged keyword is relatively low, and displaying an image indicative of the arranged keyword at the determined display position on the radar chart.

Problems solved by technology

Radar charts which have been used are useful for indicating the statistical properties of an item, but it is difficult to use them for comparing the statistical properties of a plurality of items.
If the plurality of broken lines 311 through 316 are displayed on the radar chart 300 in this way, they will overlap one another, resulting in poor visibility.
However, it is difficult to compare items in detail.

Method used


Image

  • Program and method for displaying a radar chart
  • Program and method for displaying a radar chart
  • Program and method for displaying a radar chart

Examples


first embodiment

[0044]A case where a process in the first embodiment of the present invention is performed by a computer will be described concretely.

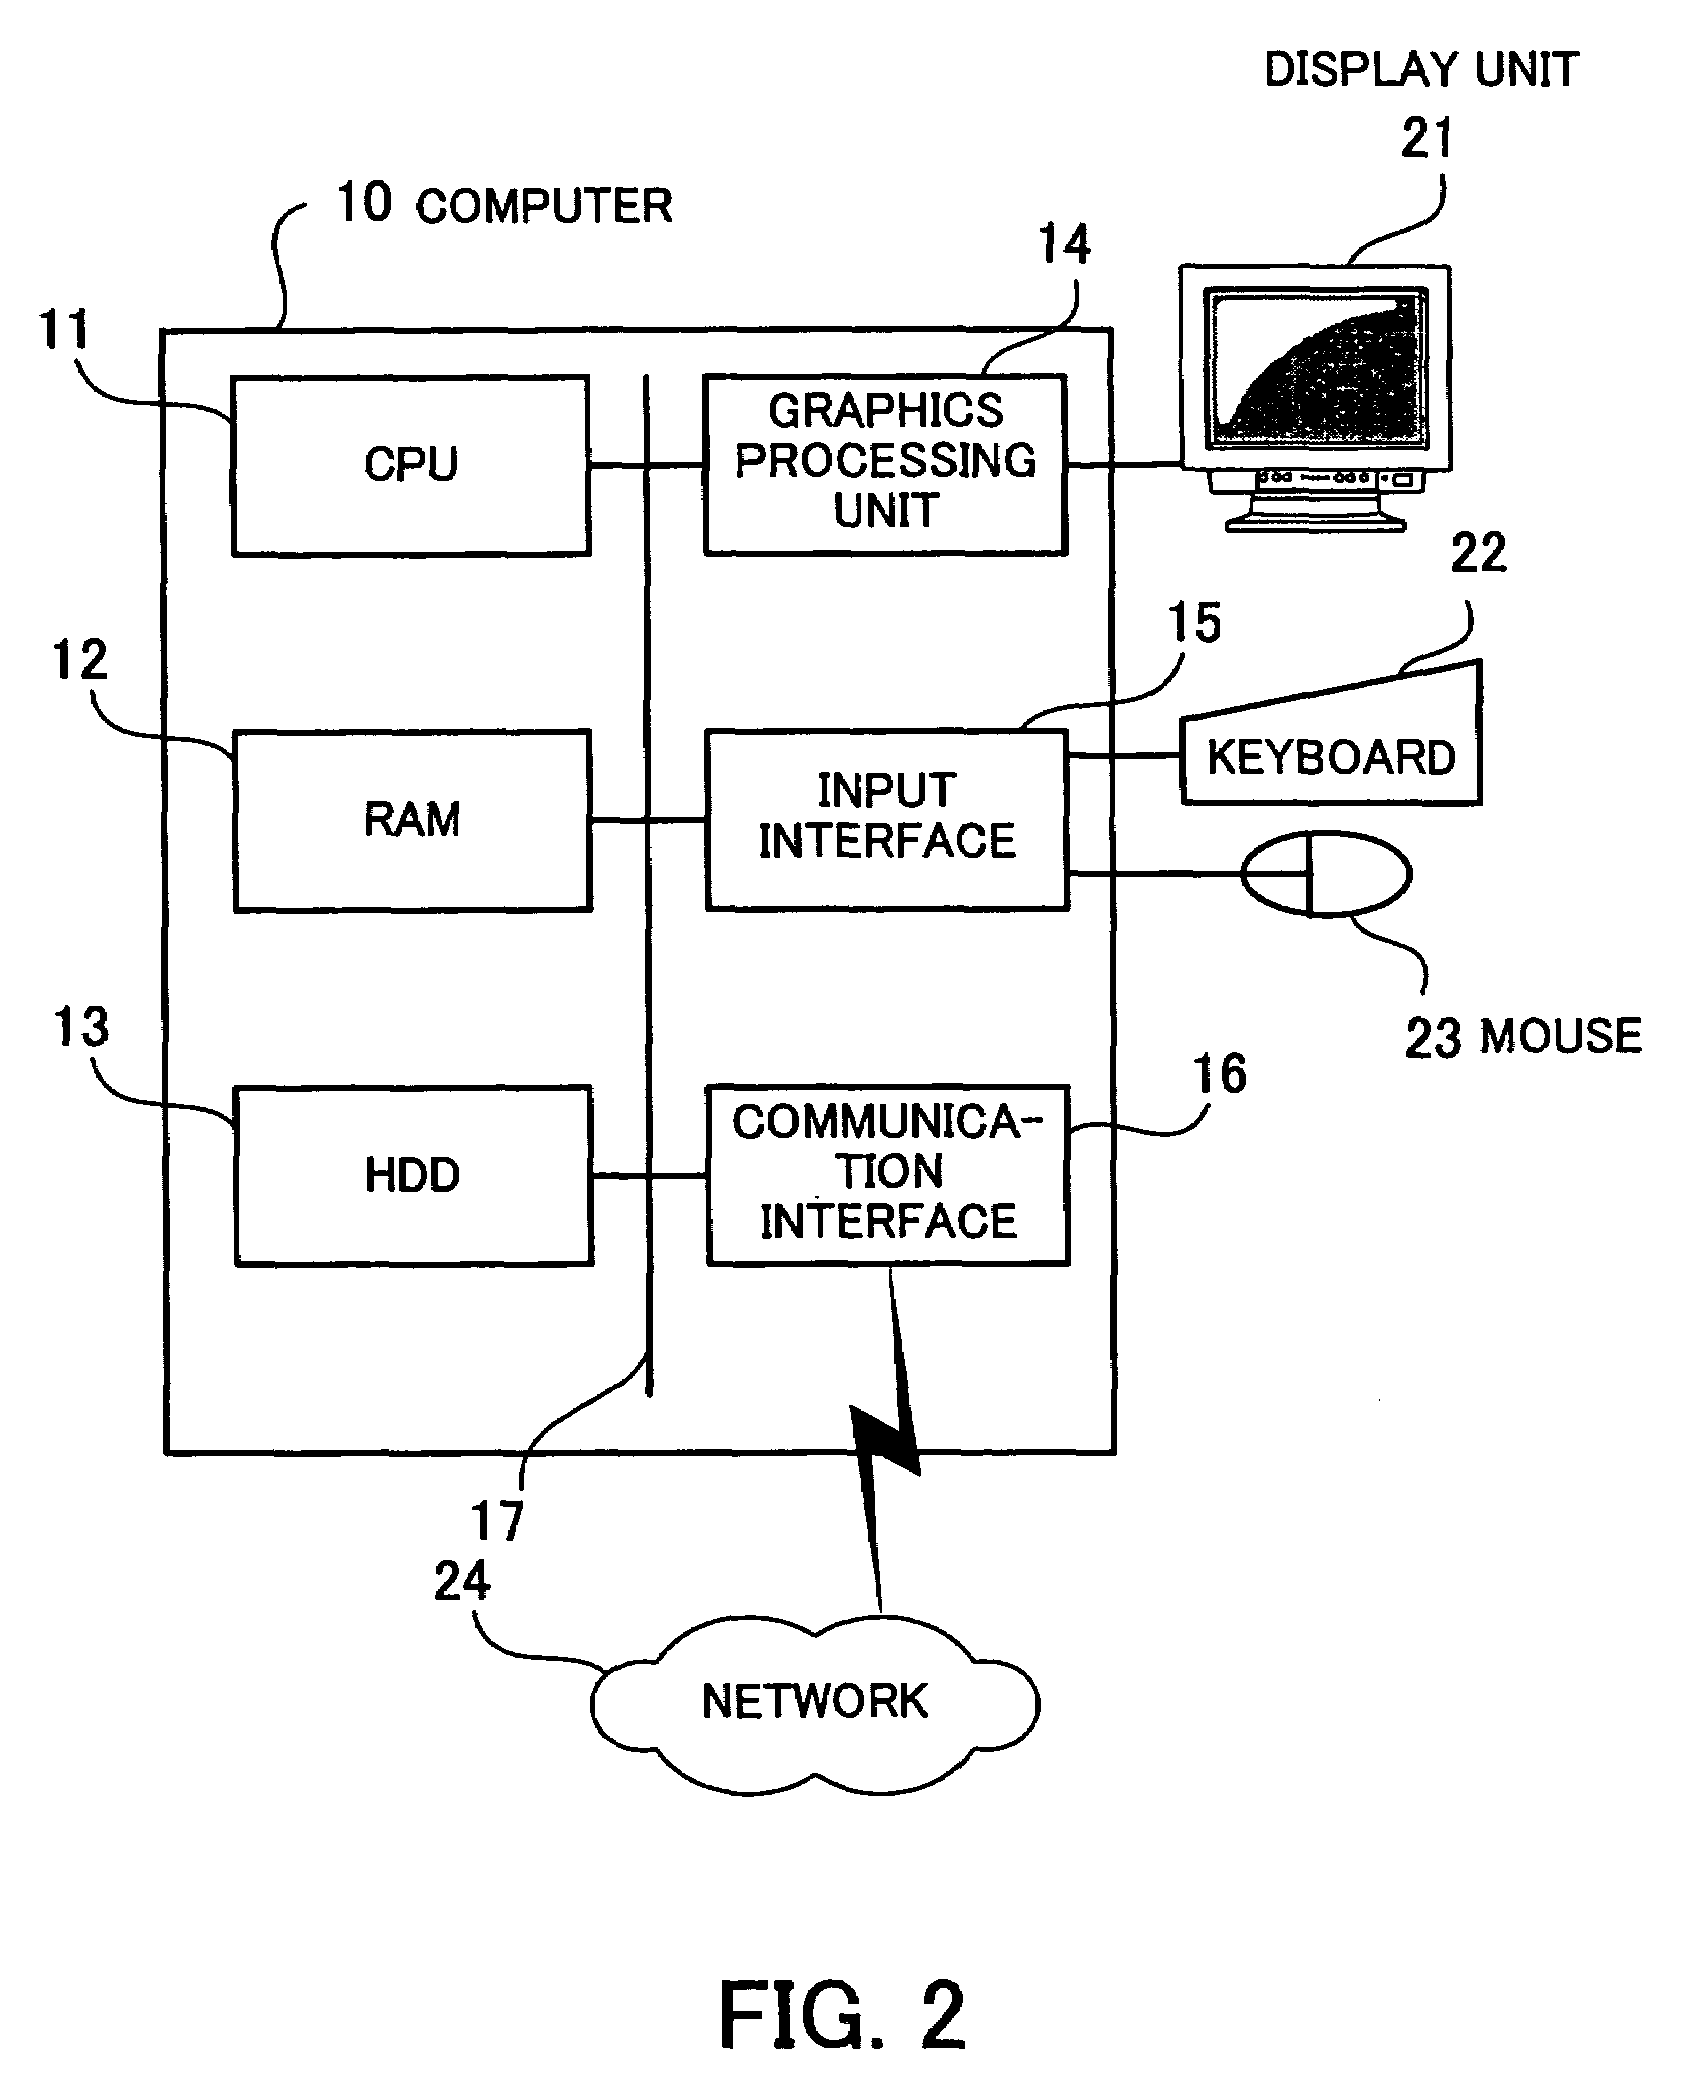
[0045]FIG. 2 is a view showing an example of the configuration of computer hardware used in the embodiments of the present invention. The whole of a computer 10 is controlled by a CPU 11. A RAM 12, a hard disk drive (HDD) 13, a graphics processing unit 14, an input interface 15, and a communication interface 16 are connected to the CPU 11 via a bus 17.

[0046]The RAM 12 temporarily stores at least part of an operating system (OS) program or an application program executed by the CPU 11. The RAM 12 also stores various pieces of data necessary for processing by the CPU 11. The HDD 13 stores an OS and a radar chart display control program.

[0047]A display unit 21 is connected to the graphics processing unit 14. The graphics processing unit 14 displays an image, such as a CAD drawing, on a screen of the display unit 21 in compliance with instructions from th...

second embodiment

[0103]The second embodiment will now be described. In the first embodiment, a radar chart is made by receiving tabular data input. In the second embodiment, however, a radar chart is made by receiving a plurality of pieces of text data input. The differences between the first and second embodiments will now be described.

[0104]Components of the processing function of a radar chart display control unit in the second embodiment are the same as those of the processing function of the radar chart display control unit in the first embodiment shown in FIG. 3. Therefore, the function of the radar chart display control unit in the second embodiment will be described by the use of the symbols with which the components shown in FIG. 3 are marked. Moreover, the radar chart display control unit in the second embodiment can be realized with a computer the hardware configuration of which is the same as that shown in FIG. 2.

[0105]Except for the inputting of tabular data (step S11 in FIG. 4) and the...


PUM


Abstract

With spreadsheet software, such as the MICROSOFT EXCEL, a radar chart can be compiled by the use of data in a table made.

Description

[0001]This application is a continuing application, filed under 35 U.S.C. §111(a), of International Application PCT / JP02 / 02730, filed Mar. 20, 2002, it being further noted that priority is based upon Japanese Patent Application No. 2001-100632, filed Mar. 30, 2001.BACKGROUND OF THE INVENTION[0002](1) Field of the Invention[0003]This invention relates to a program and method for displaying a radar chart and, more particularly, to a program and method for displaying a radar chart regarding a plurality of items.[0004](2) Description of the Related Art[0005]Now various pieces of data including statistical data are processed by a computer to make graphs, such as radar charts, or tables. With a radar chart, statistical variables are assigned to the vertices of a polygon and an axis for each variable is set on a line segment which connects the center of the polygon and each vertex. A point indicative of the value of each variable is arranged on each axis and a broken line which passes each...

Claims


Application Information

Patent Timeline
Patent Type & Authority Patents(United States)
IPC IPC(8): G06F3/00G06T11/20G06F3/048G06F17/30G06F19/00G06Q10/10G09G5/00
CPCG06F17/30554G06T11/206G06F16/248
Inventor FUSHIMI, TOSHIHIKOTSUZUKI, KOICHIYAMAMOTO, HISAYO
Owner FUJITSU LTD
Why Eureka
Try Eureka