System and method for determining sell-through time and inventory aging for retail products

Active Publication Date: 2008-05-20
TERADATA US
View PDF11 Cites 77 Cited by
  • Summary
  • Abstract
  • Description
  • Claims
  • Application Information

AI Technical Summary

Benefits of technology

[0022]Including data concerning customer returned retail products and returned retail product defects within the database allows for the determination

Problems solved by technology

Although integration of a data warehouse into a supply chain provides many benefits, the availability of data is typically limited to entities that are under the control of the organization or willing to cooperate.
While point-of-sale information is becoming more accessible, it is not always available to the supply chain integrator, often because of privacy or competitive advantage issues.
When the product reaches the consumer, there is generally little data available to the data warehouse.
Registration and customer servi

Method used


Image

  • System and method for determining sell-through time and inventory aging for retail products
  • System and method for determining sell-through time and inventory aging for retail products
  • System and method for determining sell-through time and inventory aging for retail products

Examples


case 1

[0051]The self monitoring product shows no evidence of use (i.e., zero power-ons or zero power-on hours) and the product is saleable (tests good).

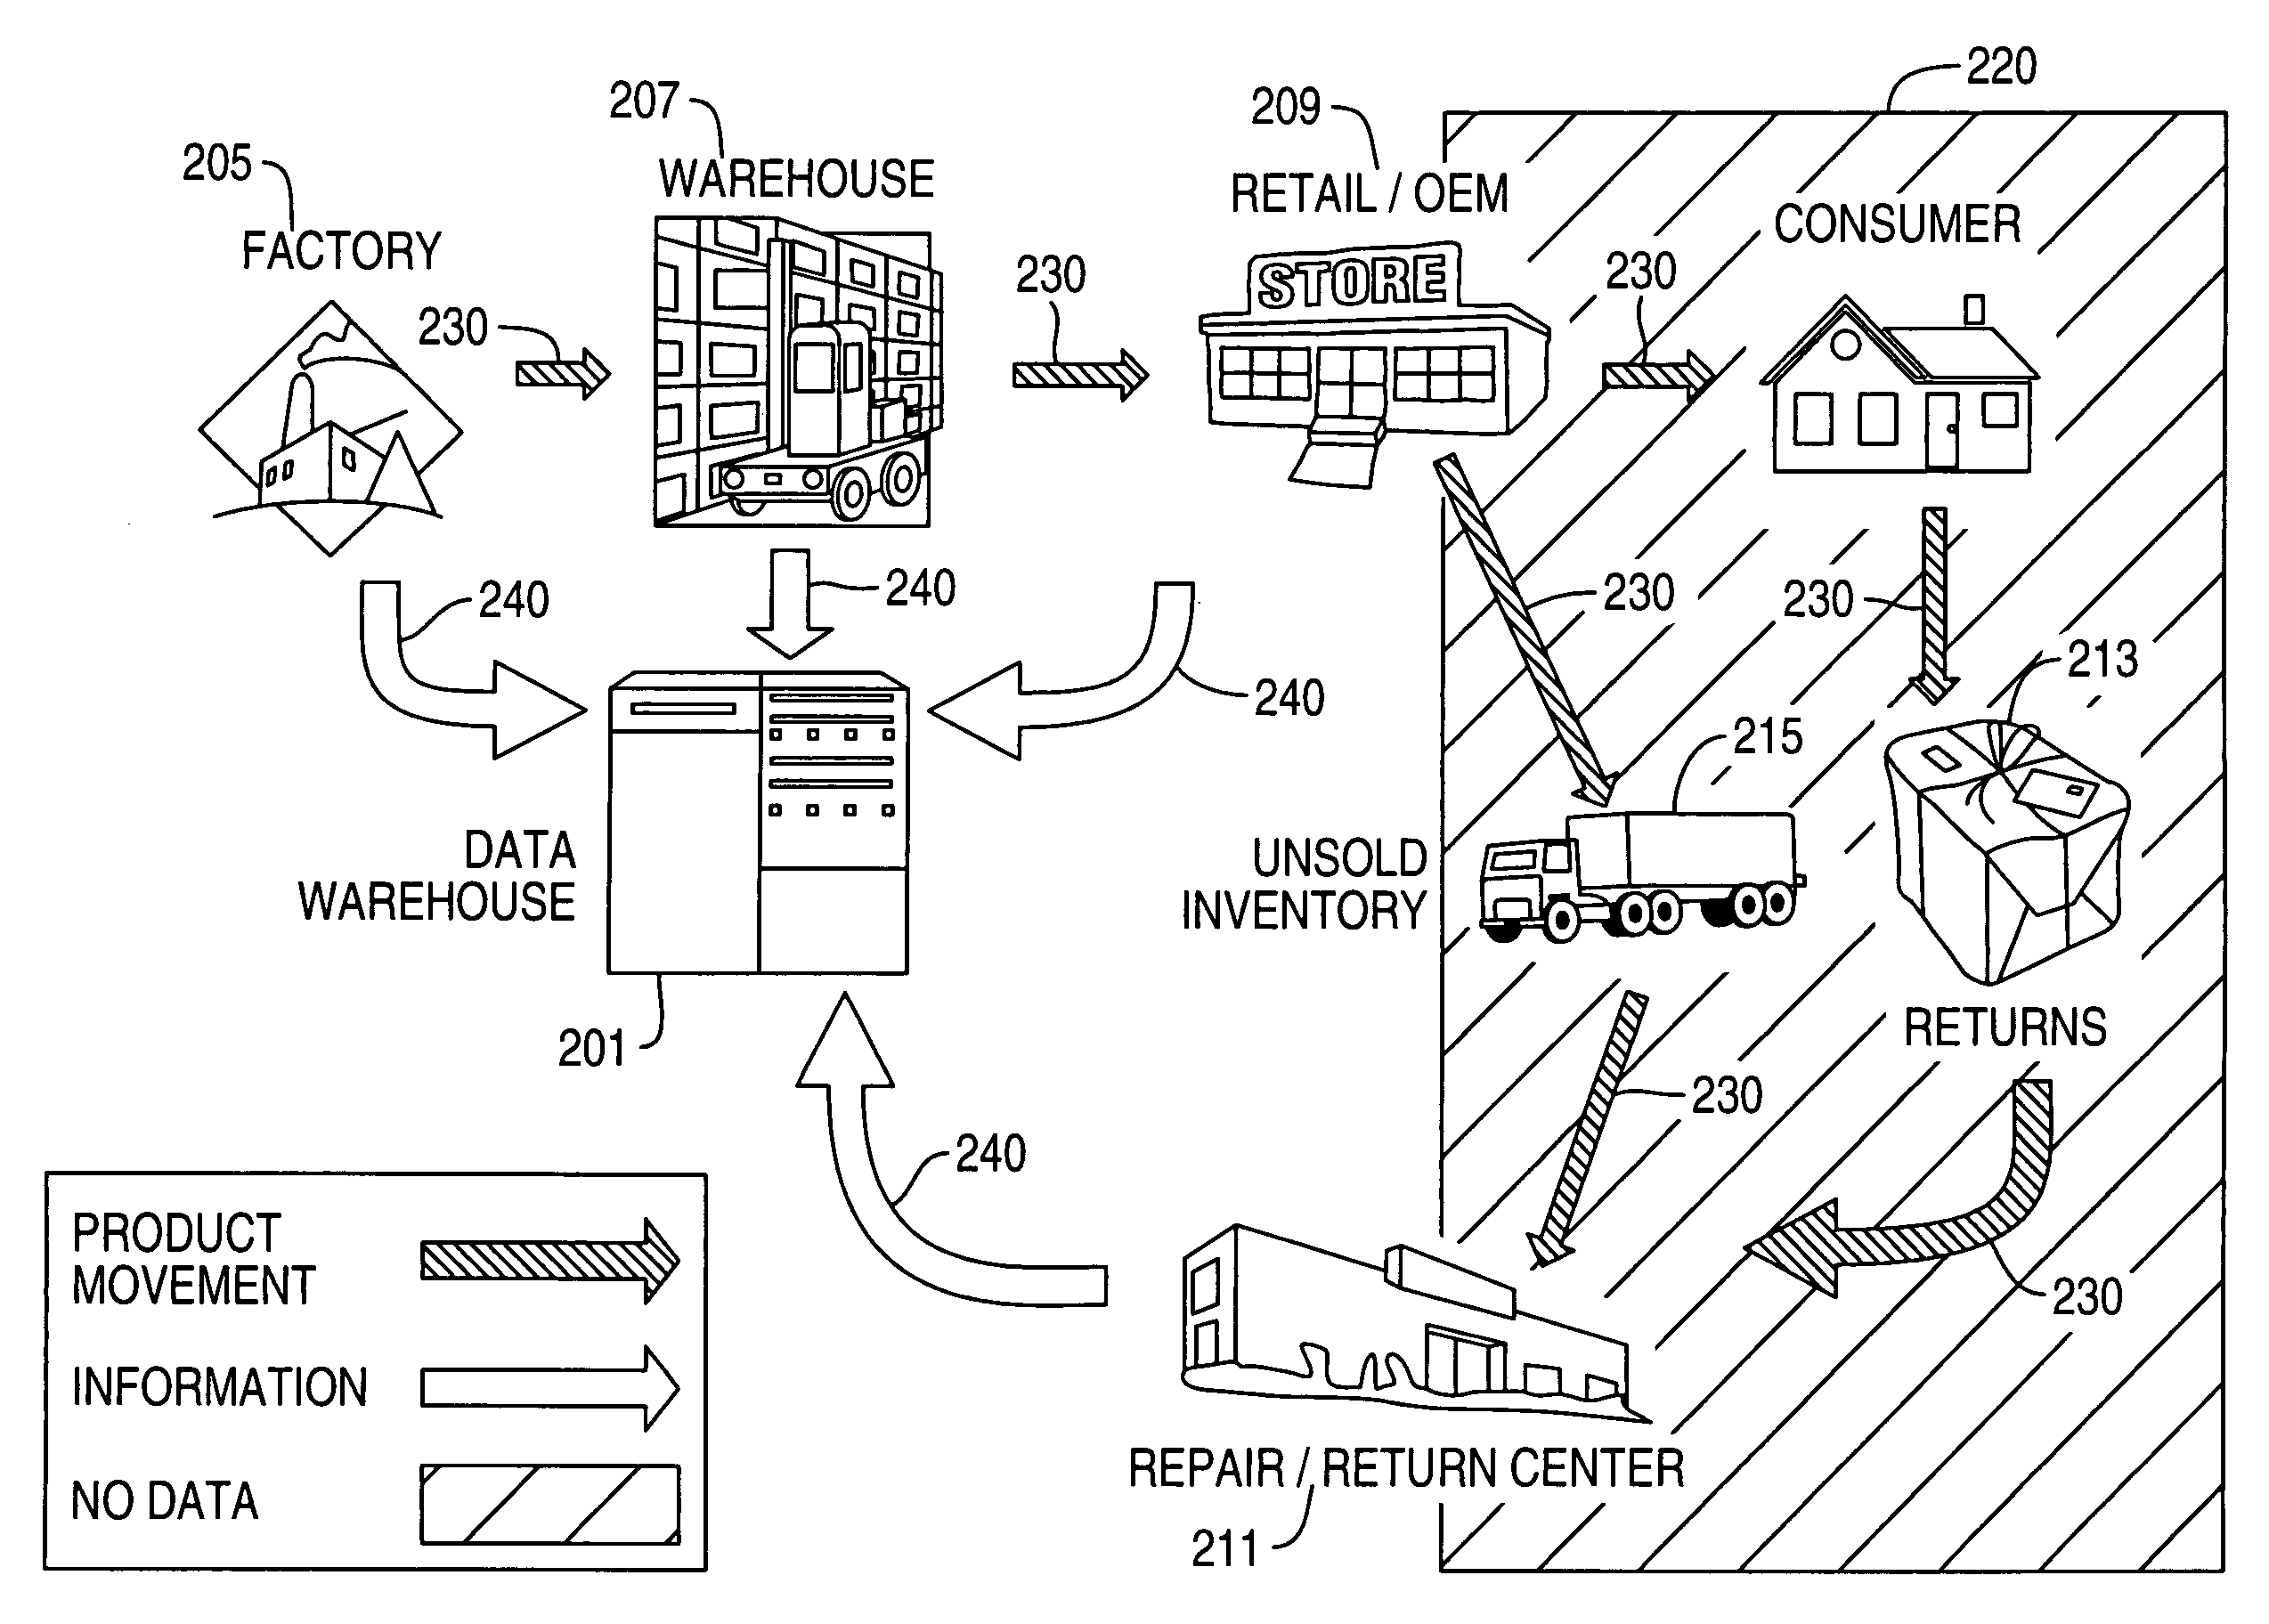
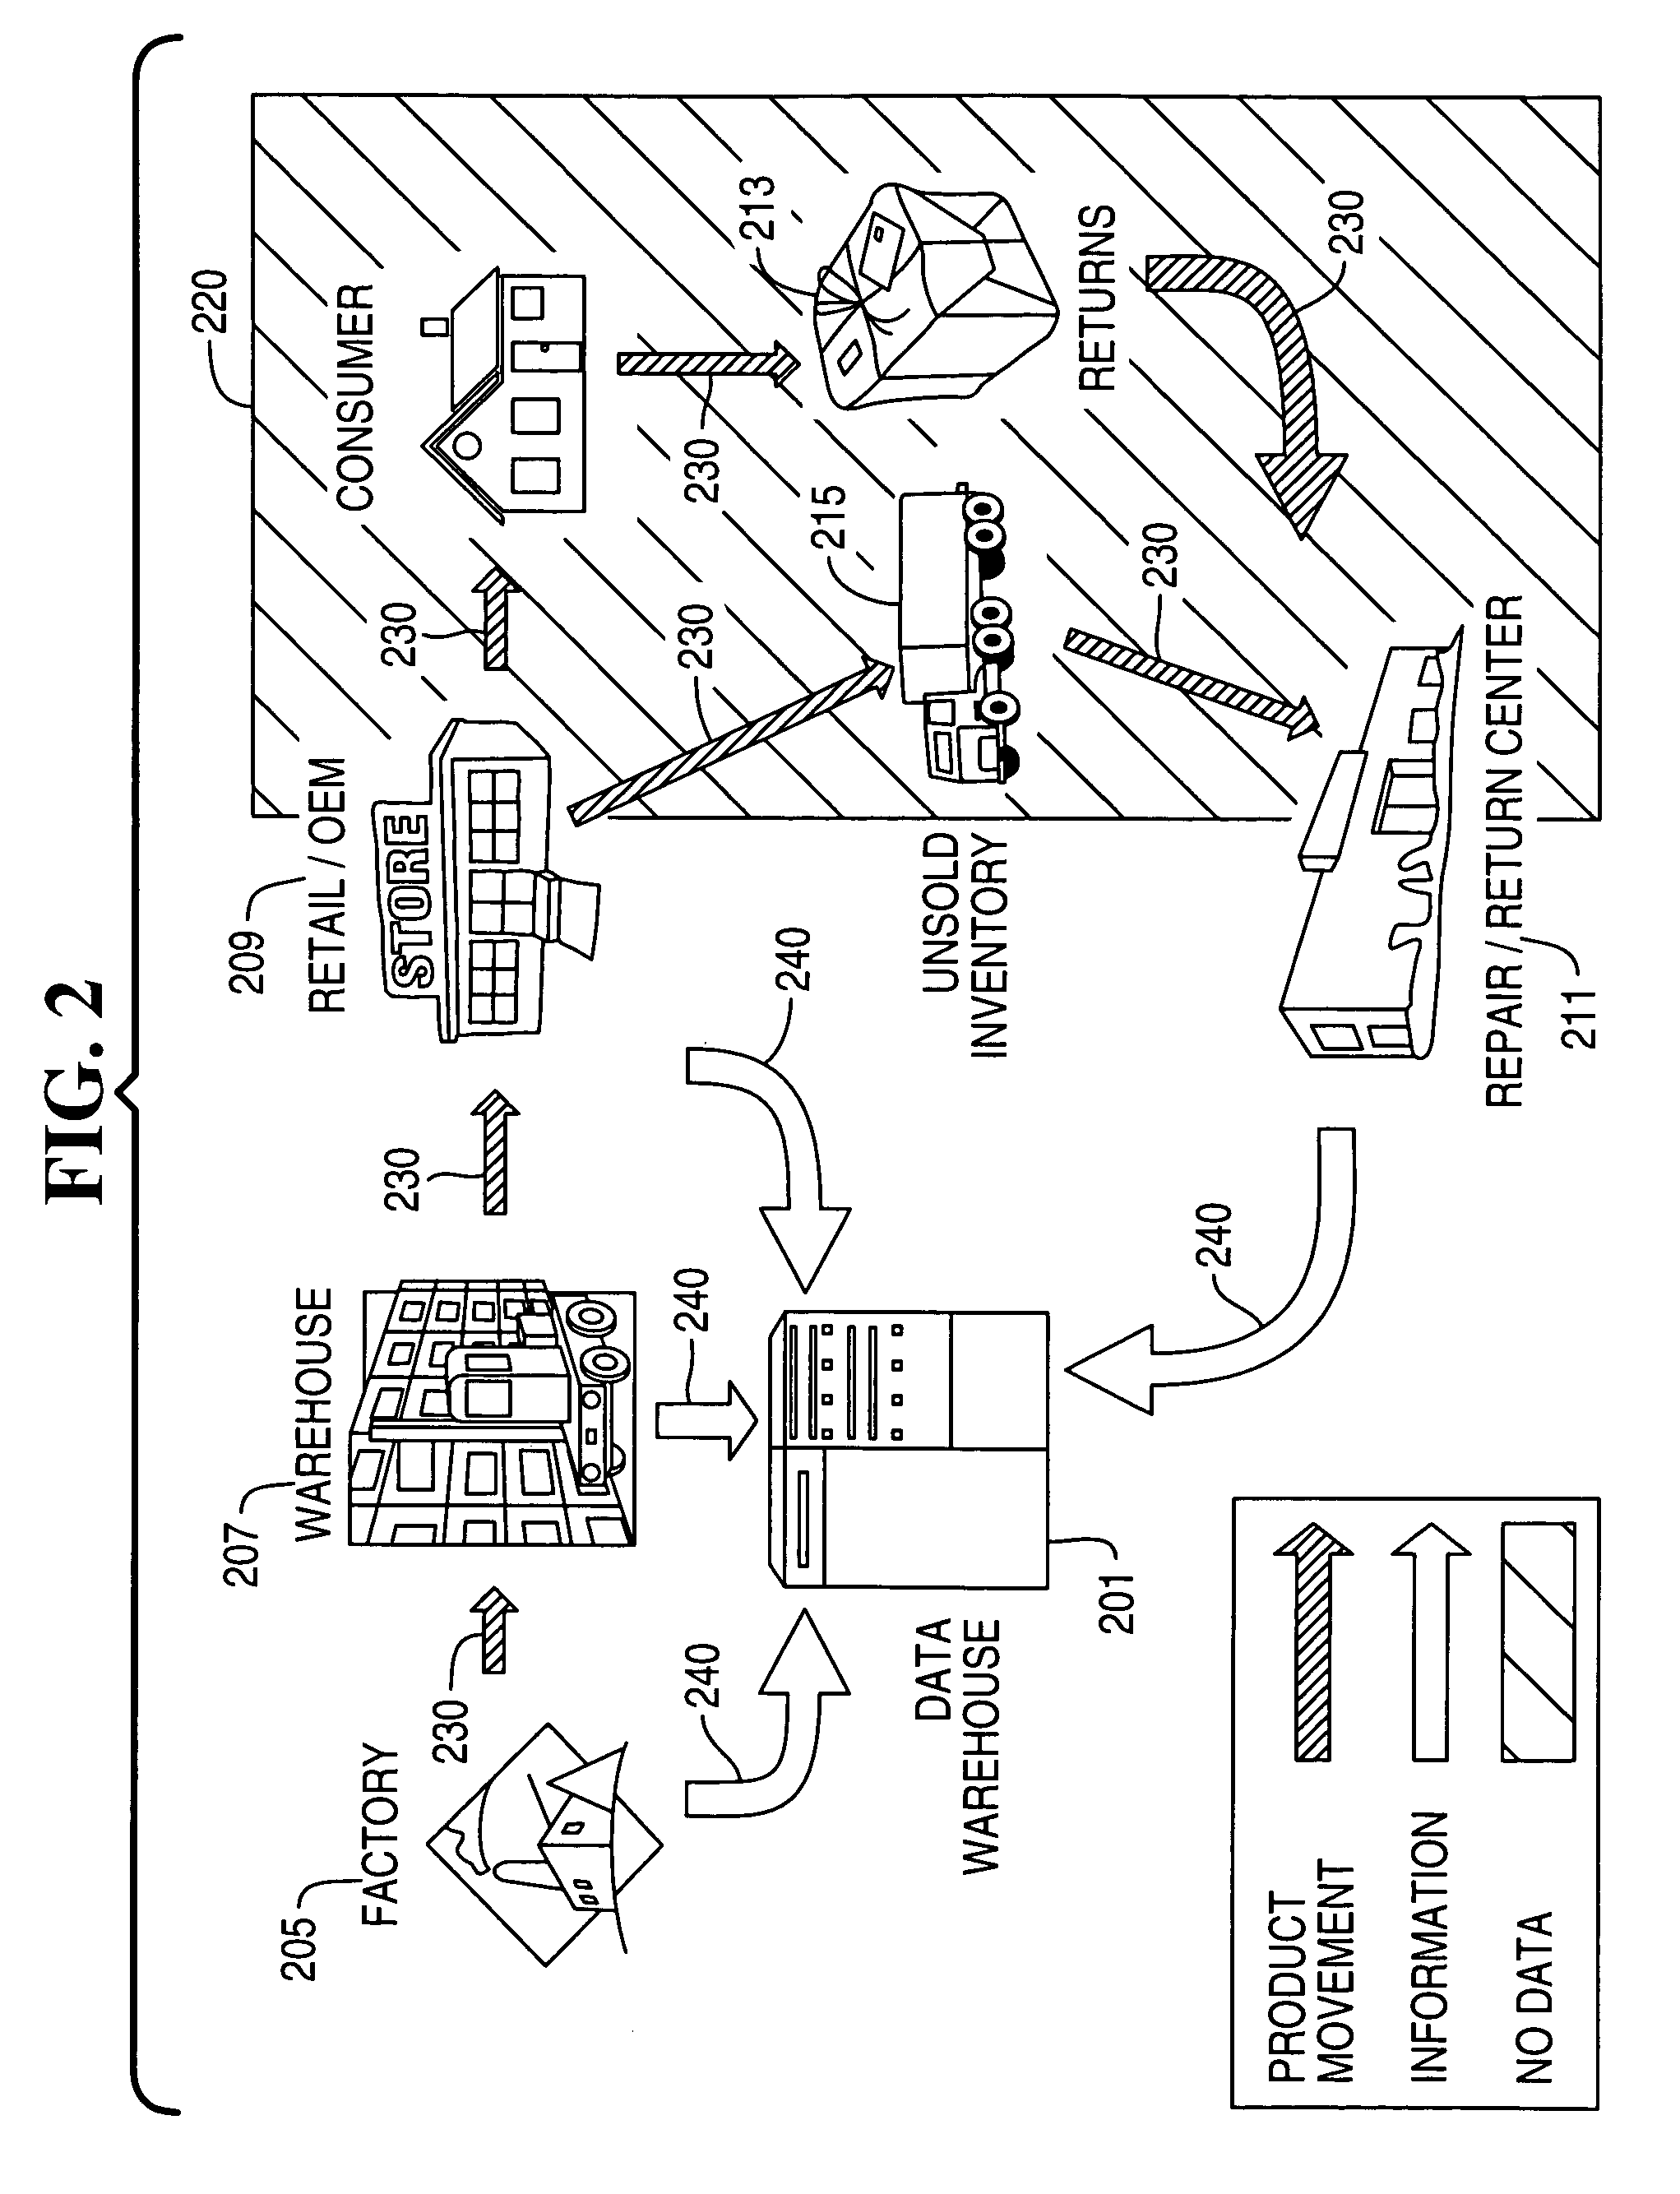
[0052]This would be the expected case (no use) for excess and obsolete inventory returned from a retailer or OEM. Using the data warehouse to identify these items and measuring the time between the last delivery and return provides a characterization of shelf time. The histogram of FIG. 3 illustrates the pattern of returns for an example product. Note the batching of returns near day 10, as expected from a retailer. Also note a bimodal distribution characterizing separate sources.

[0053]Evaluation of the data proceeds by observing the range, central values (mean or median) and variability of the distributions. The results in this case represent a worst case shelf life consistent with excess and obsolete inventory. This information can be used to evaluate inventory trends and improve return procedures for different retailers.

[0054]Alternativ...

case 2

[0061]The self monitoring product shows no evidence of use (i.e., zero power-ons or zero power-on hours) and the product is defective.

[0062]For returns from retail centers, in addition to providing sell through time information, returns in this category also imply product abuse, quality or handling issues. These can be correlated with the type of defect observed and evaluated. This category is a good indication of time between delivery and stock as it would be expected that the damage would be noticed prior to offering the product for sale. (As before, the sell through time should be compensated for whether the return originated with the customer or retailer).

[0063]Returns from customers in this category suggest improper installation or abuse by the customer. Again, these returns provide valuable information on sell through times (as previously described) while also identifying possible issues with handling or installation. As these costs are frequently absorbed by manufacturer, an ...

case 3

[0064]The self monitoring product shows small use times (or power-ons) and the product is good.

[0065]In general all returns of this type should have originated with the customer (except for known demo product)—whether the actual returns were made through the retailer / oem or not. Data from this class provides additional verification of sell through time to the final customer.

[0066]This scenario also indicates that the product did not perform up to customer expectations and analysis of the data may provide insight into the reasons.

[0067]Another alternative is fraudulent use. The product could have been used for a short time and returned—essentially equivalent to free rental of the product.


PUM


Abstract

A method and system for determining shelf life and sell-through time for retail products. The solution employs a data warehouse, a self monitoring product and product traceability. The data warehouse is utilized to track delivery information throughout the supply chain, e.g., time, quantity, product information, traceability; return information of unsold inventory returned from a retailer or customer as saleable; return information of inventory returned as unsaleable, damaged or defective; and data relating to evaluation of returned inventory. A self monitoring product is one that is capable of recording events such as number of times the product has been used, time since initial use, cumulative time and other items of interest such as stress variables, dates, min/max values, updates, etc. The solution involves evaluation of all returned product and comparing the information on the self monitoring product with known information from the supply line and return results contained in the database. The returns effectively act as a sample of all products and provide information about the product shelf-life, use profiles, installation issues, abuse, defects, etc.

Description

FIELD OF THE INVENTION[0001]This invention relates in general to systems for managing and evaluating supply chain product flows, and in particular, to a system and method for evaluating sell-through time and inventory aging for retail products.BACKGROUND OF THE INVENTION[0002]A “supply chain” refers to a chain of entities, paths, and other points across which a raw material, part, or product is processed, transferred, and / or otherwise manipulated. Typically, the supply chain for a business enterprise includes suppliers, manufacturing centers, warehouses, distribution centers, and retail outlets. Efficient and cost-effective supply chain management requires controlling the flow and storage of raw materials, work-in-process inventory and finished products within and between various facilities. The goal of a properly managed supply chain is to allow merchandise to be produced and distributed in the right quantities, to the right locations and at the right time, while minimizing system-...

Claims


Application Information

Patent Timeline
IPC IPC(8): G06Q10/00
CPCG06Q10/087
Inventor ALDRIDGE, BRUCE E.
Owner TERADATA US
Why Eureka
Try Eureka