Method for obtaining and processing surface analysis data

a surface analysis and data technology, applied in material analysis using wave/particle radiation, instruments, nuclear engineering, etc., can solve the problems of not being able to perform the same measurement at the same location, not being able to measure the correct variation occurring, and not being able to derive data that would be identical with the data obtained

Active Publication Date: 2009-03-03
JEOL LTD
View PDF3 Cites 4 Cited by
  • Summary
  • Abstract
  • Description
  • Claims
  • Application Information

AI Technical Summary

Problems solved by technology

It has not been possible to measure the correct variation occurring during the irradiation of 100 seconds.
Therefore, it is impossible to perform the same measurement at the same location.
In this way, it has been impossible to derive data that would be identical with data obtained from 5 second-interval measurements after measurements were performed at intervals of 10 seconds in practice.
Furthermore, where a sample is irradiated with a focused ion beam for 100 seconds, there has been no means for investigating the relationship between the variation in the intensity of a certain chemical element contained in the sample and the process of creating the sample using the focused ion beam if it is desirable to utilize such means.
Any of the above-described conventional works has been cumbersome and laborious to perform.

Method used


Image

  • Method for obtaining and processing surface analysis data
  • Method for obtaining and processing surface analysis data
  • Method for obtaining and processing surface analysis data

Examples


Embodiment Construction

[0029]The preferred embodiments of the present invention are hereinafter described with reference to the accompanying drawings.

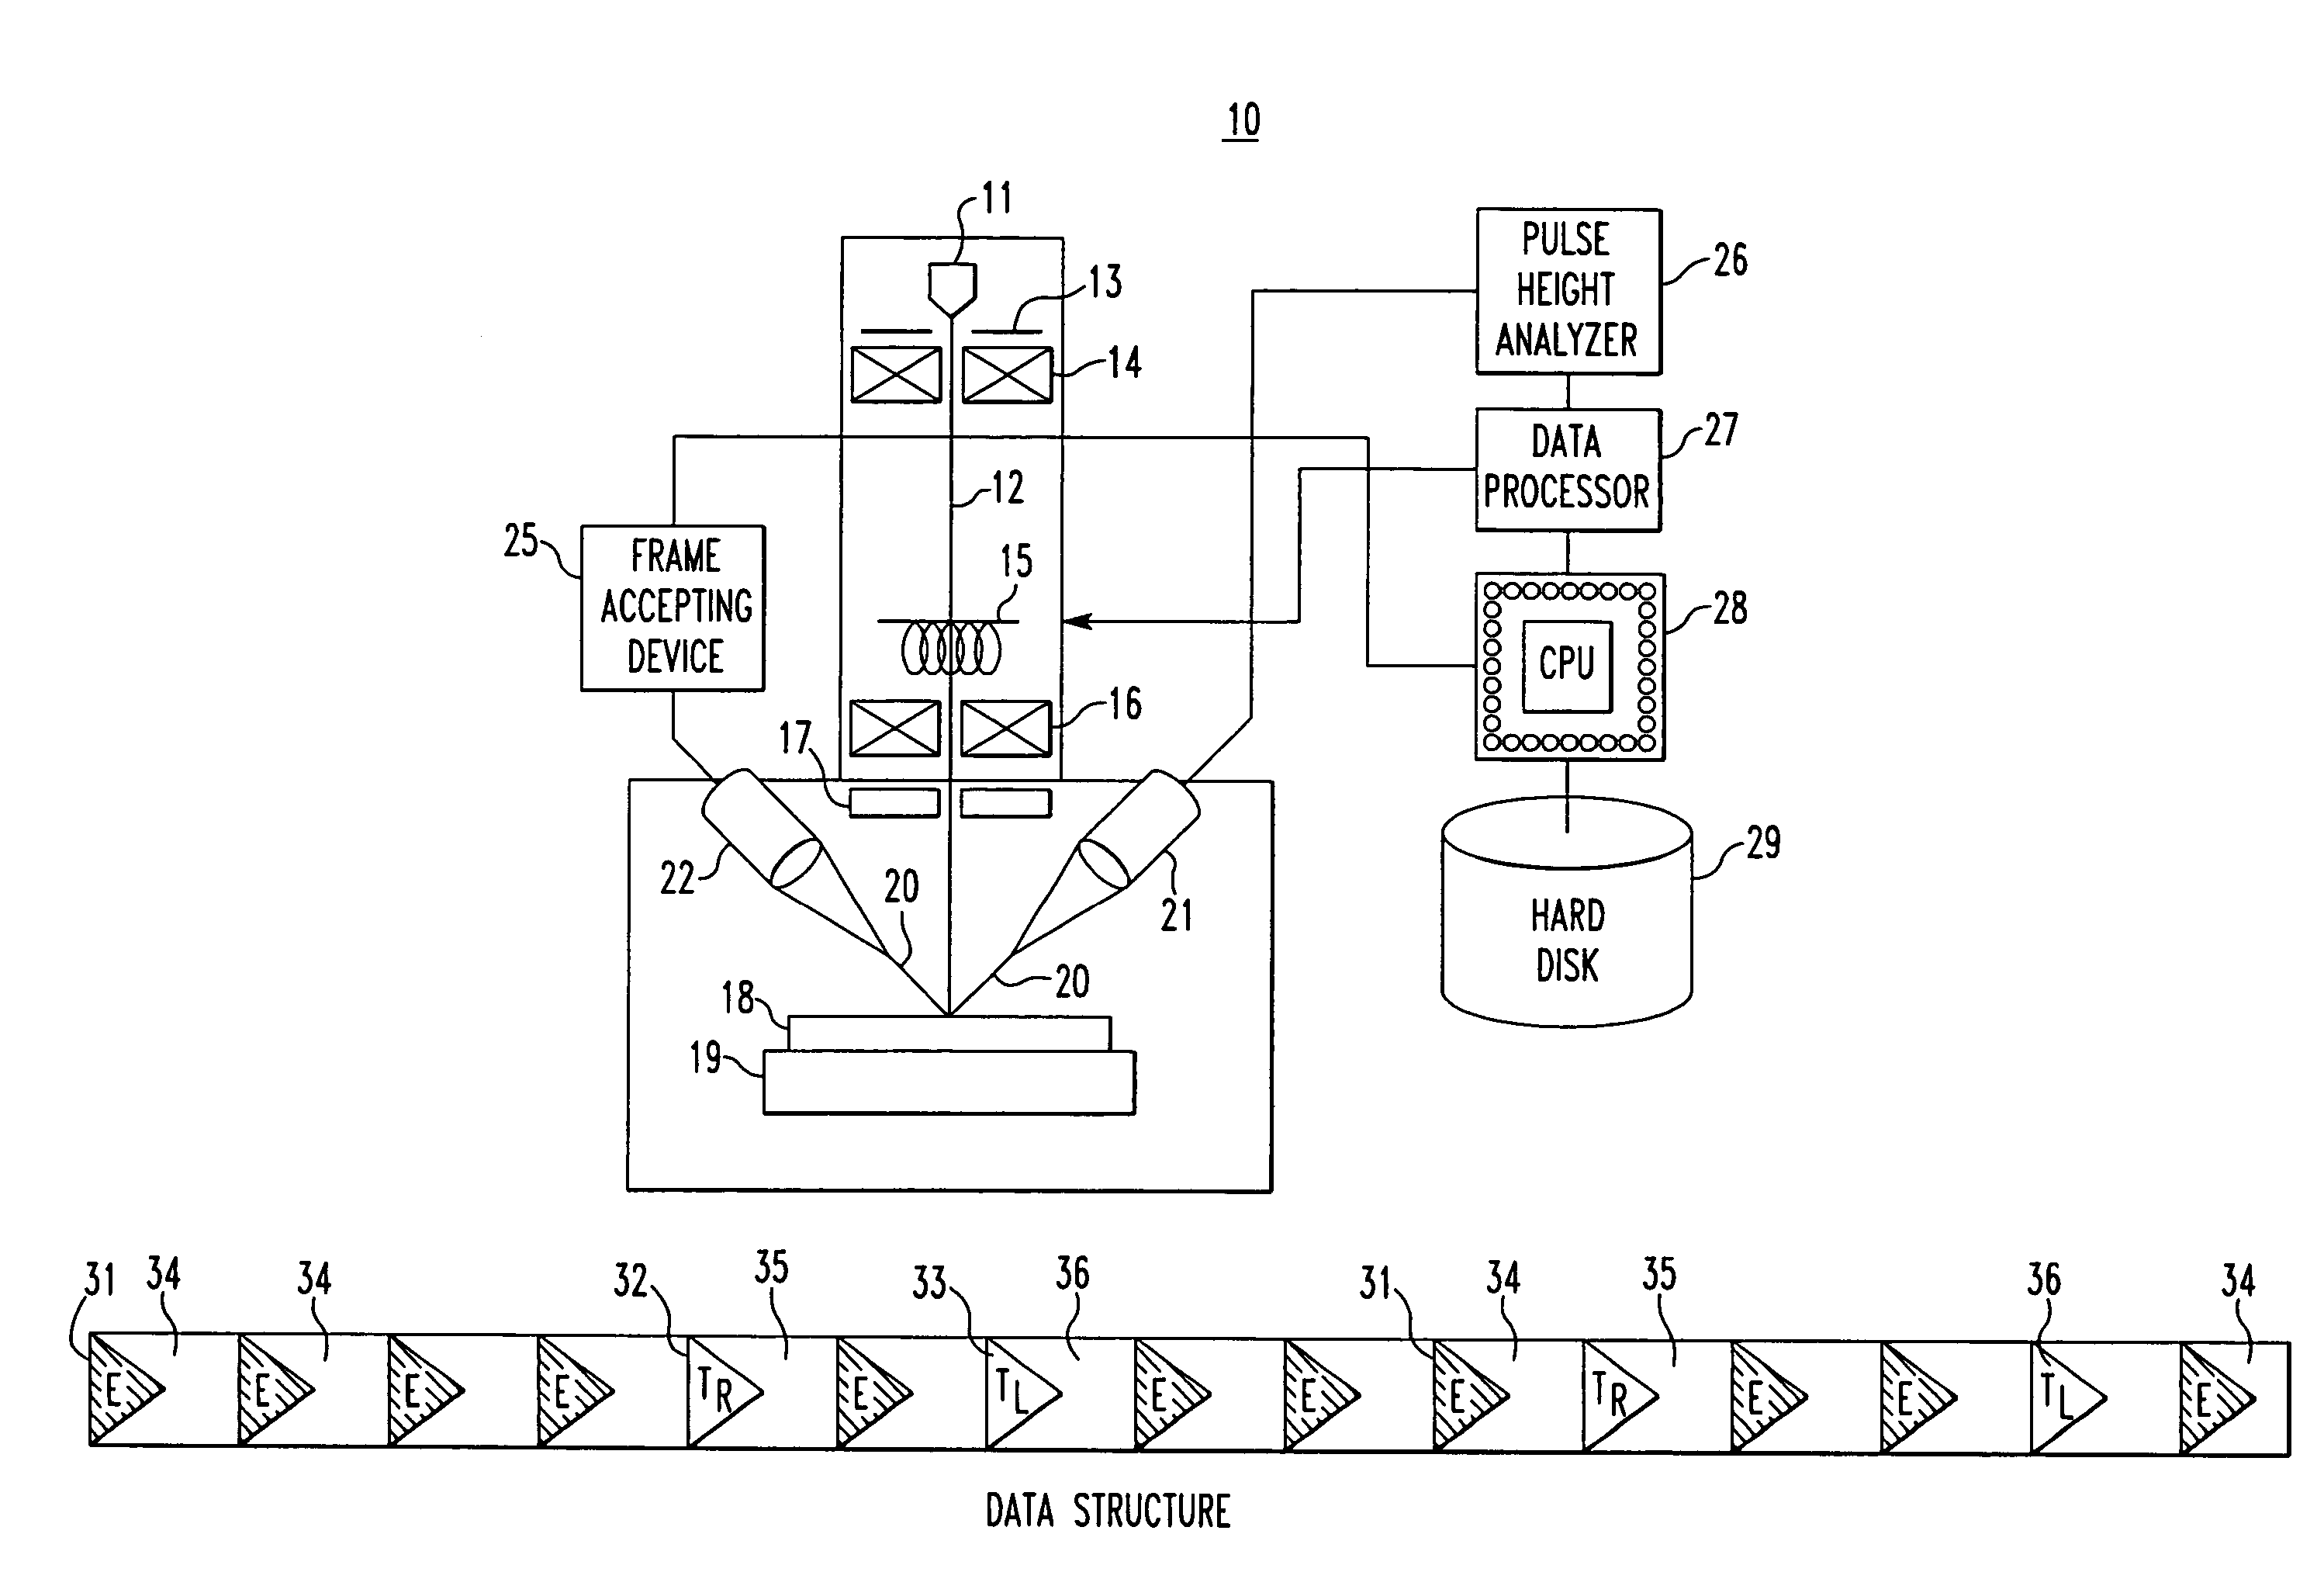
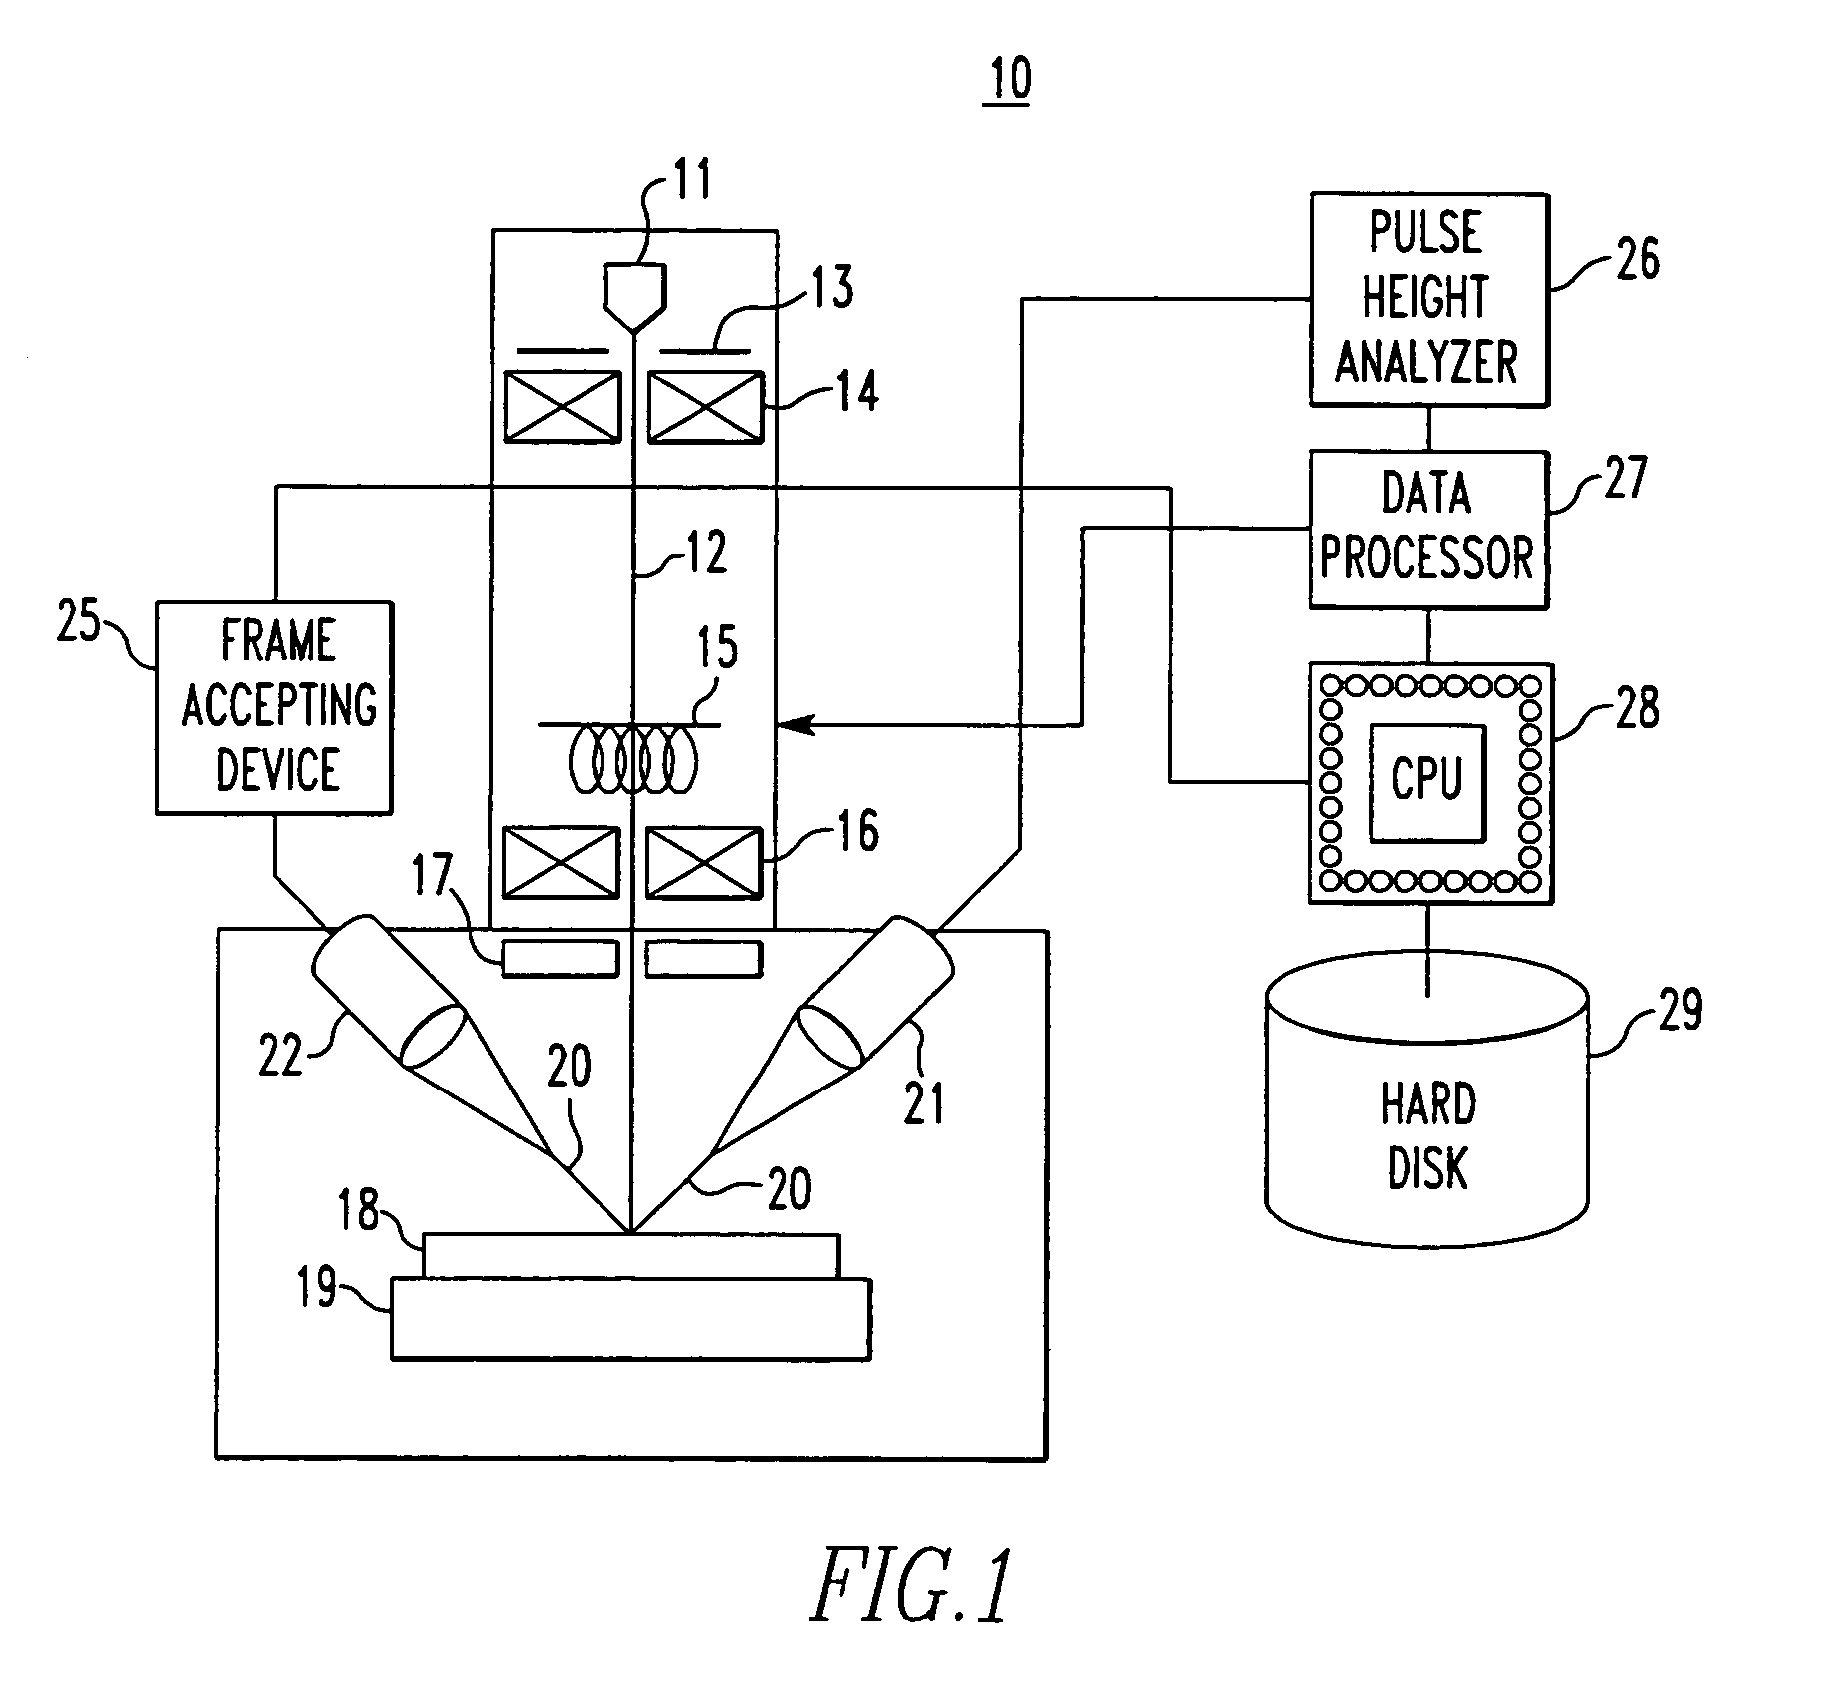
[0030]FIG. 1 is a diagram of a surface analysis instrument according to one embodiment of the present invention. The surface analysis instrument consists of an electron probe microanalyzer (EPMA), generally indicated by reference numeral 10. The instrument has an electron gun 11 emitting an electron beam which is directed at a sample to produce secondary rays (X-rays in this embodiment) from the sample. The secondary rays are spectrally analyzed by an energy dispersive X-ray spectrometer (EDS) 21. The obtained spectrum is analyzed, reproduced, and displayed on a display device (not shown) by a pulse height analyzer (PHA) 26 (described later) forming a computer, a data processing circuit 27, and a CPU 28. The display device is connected with the CPU 28. It is assumed that the recorded energies of photons are described as a function of time.

[0031]The electron ...


PUM

PropertyMeasurementUnit
time resolutionaaaaaaaaaa
timeaaaaaaaaaa
timeaaaaaaaaaa

Abstract

A method of managing data obtained by measurements. The method permits EDS (energy dispersive spectroscopy) spectra to be collected in one operation. Energies detected by an EDS detector are converted by a pulse height analyzer into pulses of heights corresponding to the energies. The heights of the pulses in a distribution are assigned to multiple channels. The number of pulses in each channel is counted. A data processing circuit sends data blocks to a CPU. In each data block, a tag indicative of being X-ray energy data and the value of energy are combined. The CPU sequentially stores incoming data blocks into a hard disk.

Description

BACKGROUND OF THE INVENTION[0001]1. Field of the Invention[0002]The present invention relates to a method of obtaining and processing (managing) data obtained by a measurement or measurements (hereinafter referred to as “measurement data”) using a surface analysis instrument, such as an electron probe microanalyzer (EPMA), to which an energy dispersive X-ray spectrometer (EDS) is attached. The invention also relates to a measurement data structure adapted for this method. Furthermore, the invention relates to a method of reproducing a spectrum from measurement data having the above-described measurement data structure and to a surface analysis instrument using the measurement data structure.[0003]2. Description of Related Art[0004]Heretofore, a technique for detecting chemical elements present in a desired region on the surface of a sample using an energy dispersive X-ray spectrometer (EDS) has been known as disclosed in Japanese Patent Laid-Open No. S61-93938. In particular, the de...

Claims


Application Information

Patent Timeline
Patent Type & Authority Patents(United States)
IPC IPC(8): G01N23/223
CPCG01N23/2252G01N2223/306
Inventor KANEYAMA, MIYUKIKATAGAMI, MASUMI
Owner JEOL LTD
Why Eureka
Try Eureka