Scoring method for correlation anomalies

a scoring method and correlation anomaly technology, applied in the field of system and methodology for implementing fault analysis systems, can solve problems such as misleading answers, differences, and methods that are only applicable to very static data

Inactive Publication Date: 2009-05-05
INT BUSINESS MASCH CORP
View PDF4 Cites 22 Cited by
  • Summary
  • Abstract
  • Description
  • Claims
  • Application Information

AI Technical Summary

Problems solved by technology

However, these methods are applicable only to very static data.
These methods, when used for data that takes into consideration the conditions of experimental fluctuations, the implementation of heterogeneities variables, and the diagnostic correlation between variables, an result in misleading answers.
In addition, if it has been determined that there is a significant difference between the two covariance matrices in one way or another, then the difference itself will not provide enough data for practical use.
If such actionable information is not provided, the analysis tool will be useless.
For similar reasons, methodologies with which to calculate and visualize, or rank the difference between a normal correlation matrix and an abnormal correlation, have usability problems.
Thus, traditional correlation coefficient analysis tools do not provide sufficient solutions.

Method used


Image

  • Scoring method for correlation anomalies
  • Scoring method for correlation anomalies
  • Scoring method for correlation anomalies

Examples


Embodiment Construction

[0016]One or more exemplary embodiments of the invention are described below in detail. The disclosed embodiments are intended to be illustrated only since numerous modifications and variations therein will be apparent to those of ordinary skill in the art.

[0017]Aspects of the present invention can be implemented within a conventional computing system environment comprising hardware and software elements. Specifically, the methodologies of the present invention can be implemented to program a computer to accomplish the prescribed tasks of the present invention as described below.

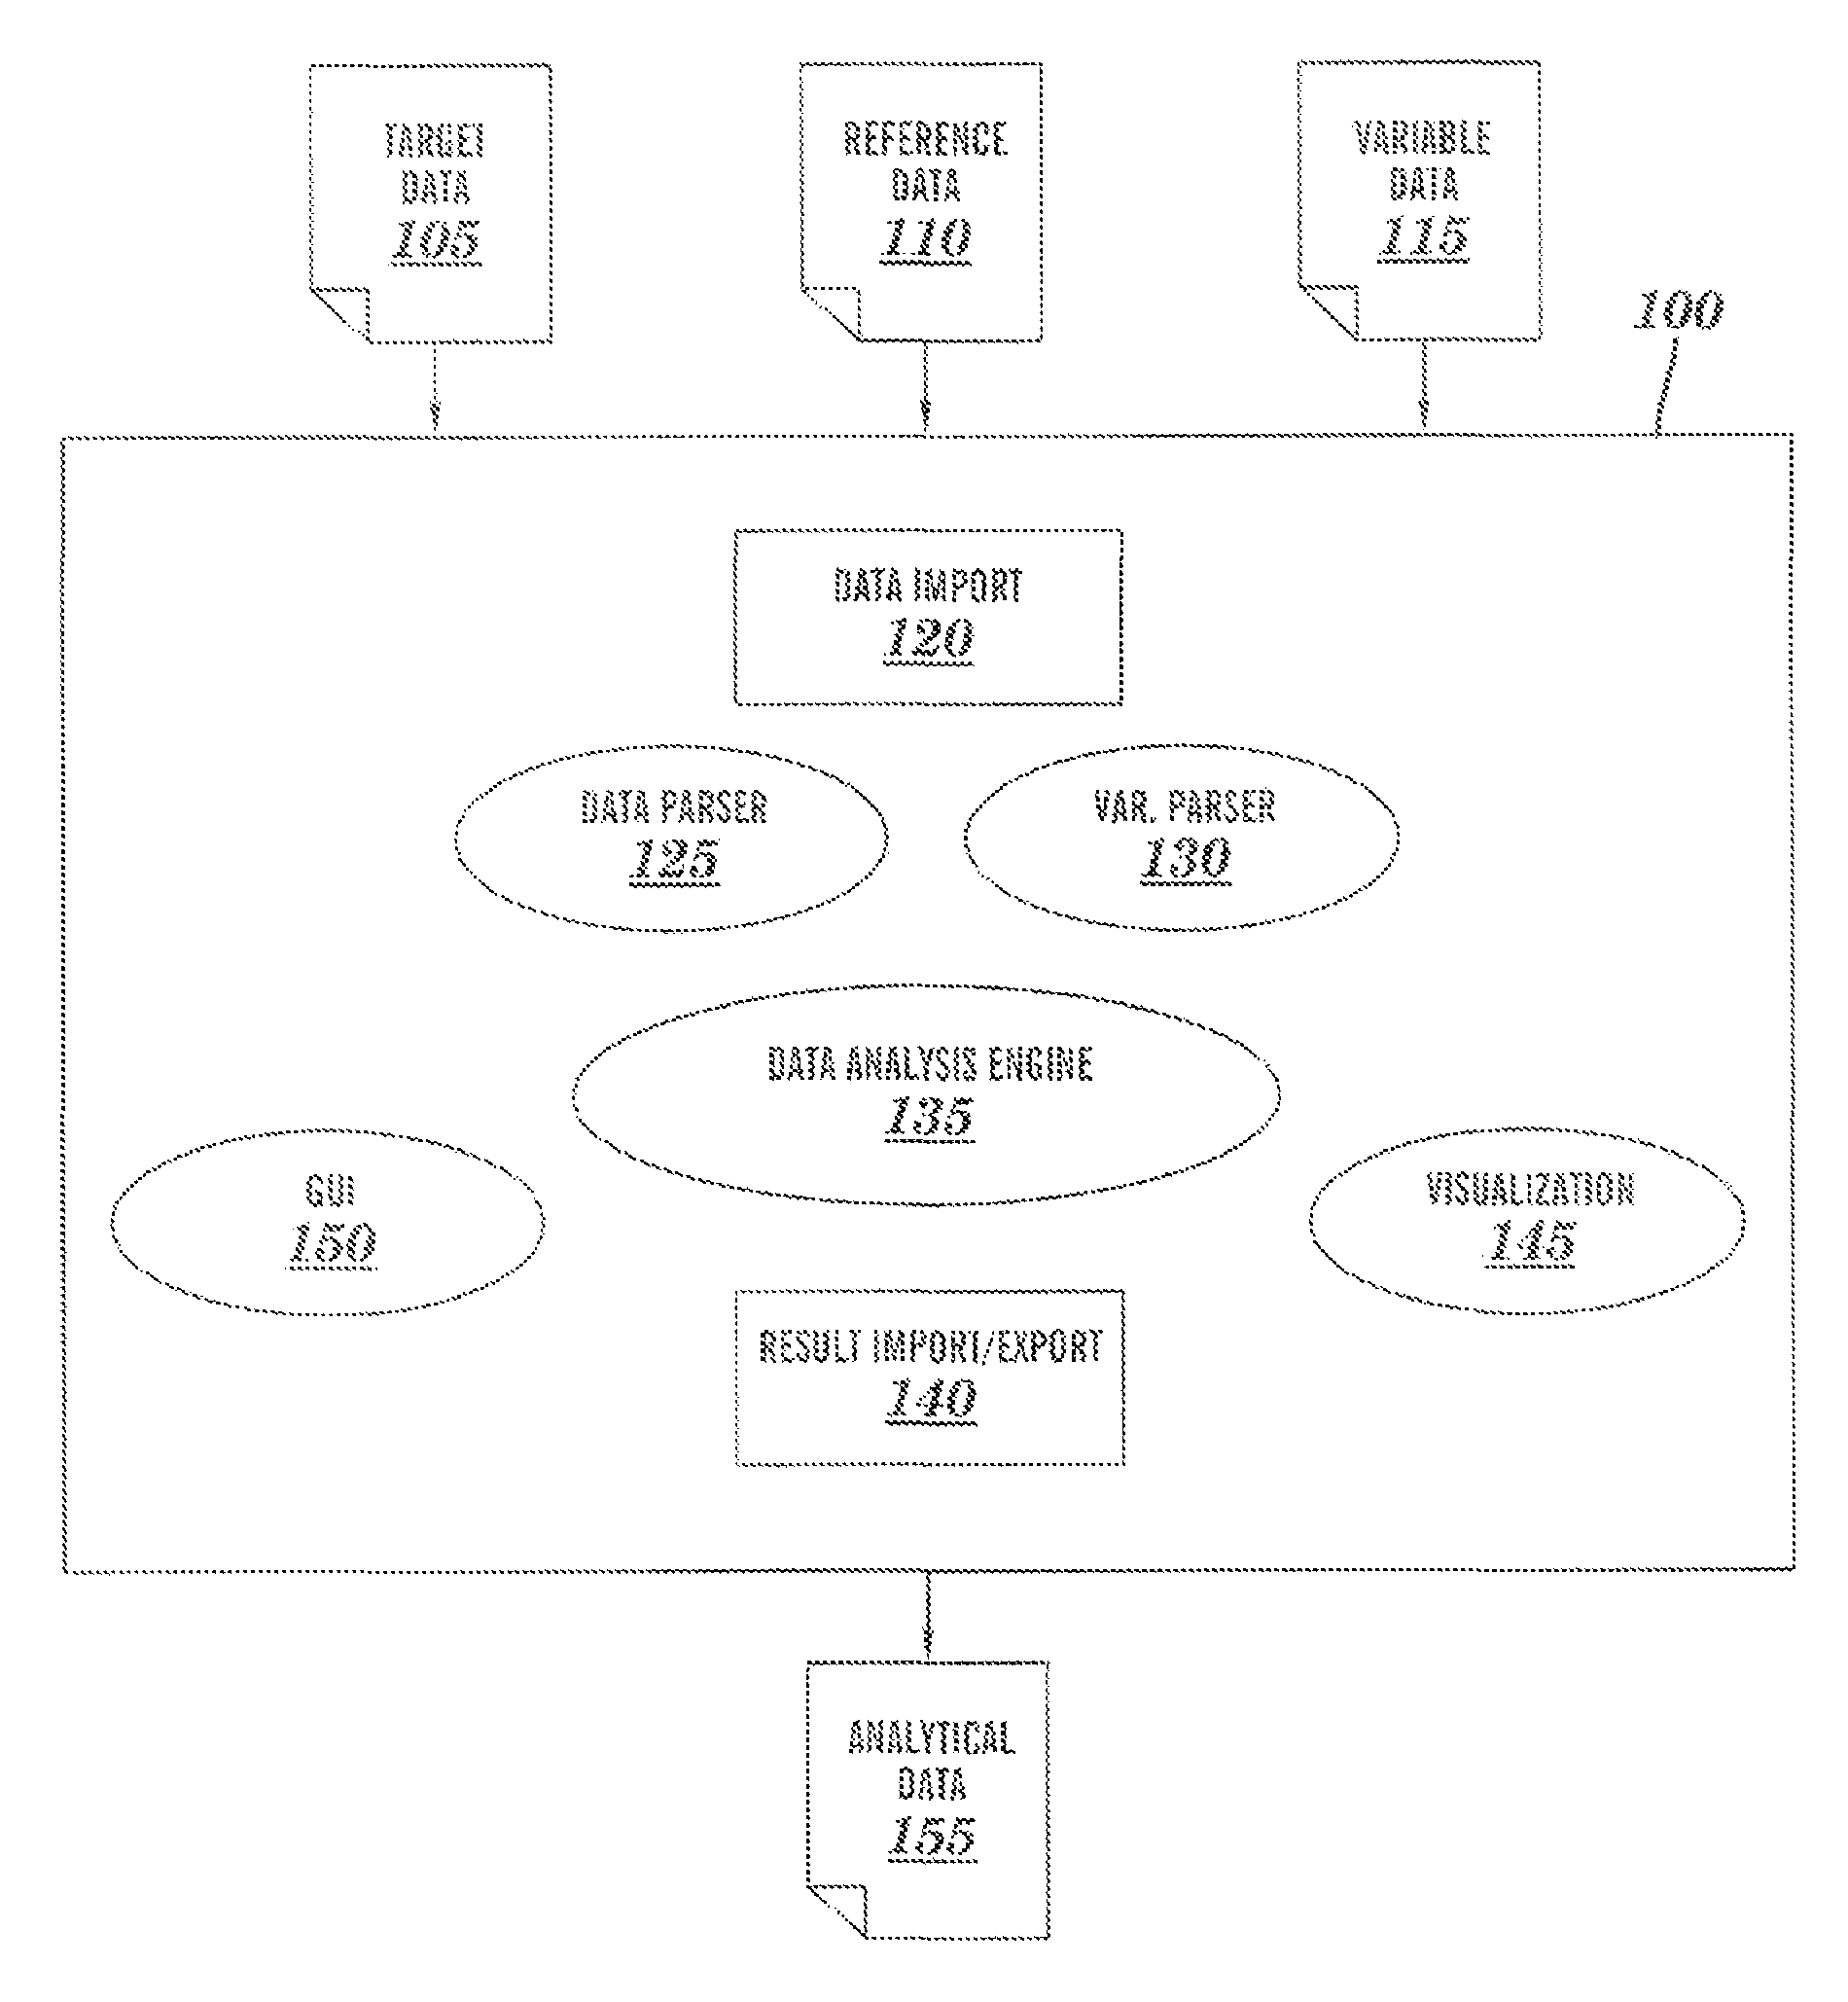
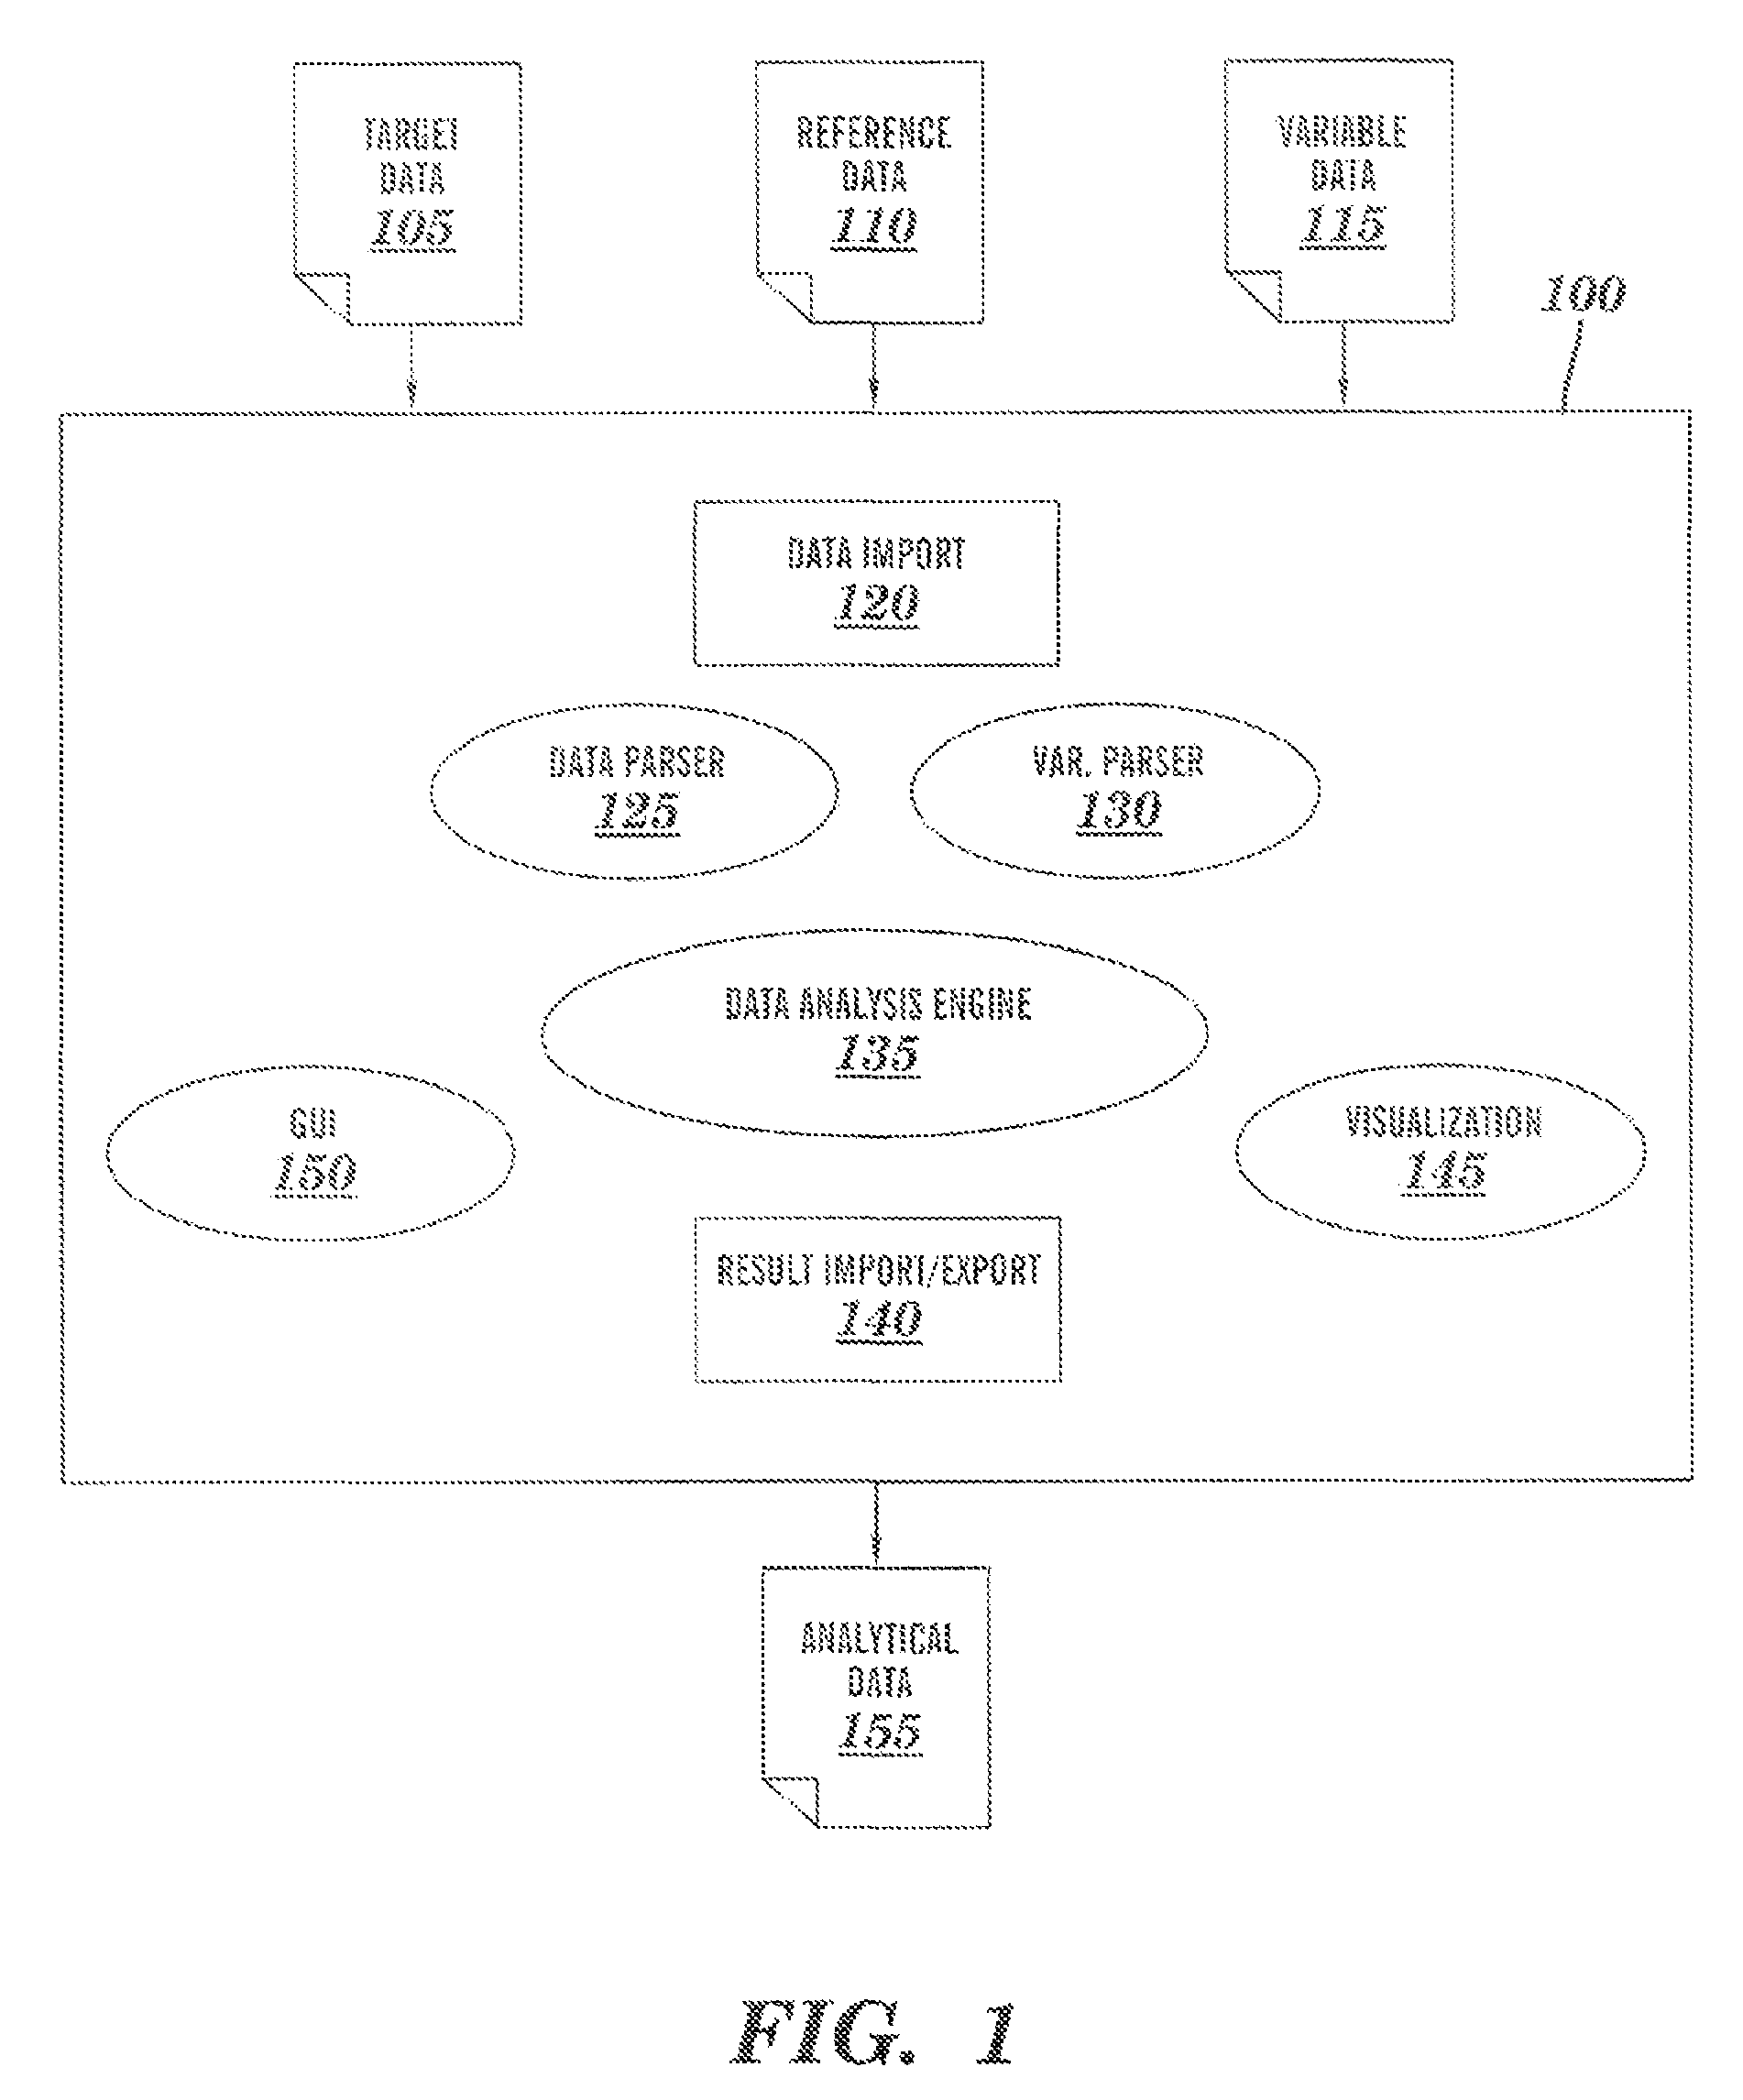
[0018]Turning now to the drawings in greater detail, it will be seen that in FIG. 1 there is a block diagram detailing software elements 100 that may be comprised within aspects of embodiments of the present invention. The software elements 100 of the programmed computer include a data import component 120, a data parsing component 125, a variable definition parser component 130, data analysis engine 135, a ...


PUM


Abstract

Within aspects of the present invention, correlation anomalies are calculated in four stages for a reference data set, and a target data set, respectively, the four stages are: Initially, a similarity matrix K of the variables to be diagnosed is calculated. This similarity matrix is embedded in a low-dimensional vector space in order to calculate and obtain the coordinates {z1, . . . zp} for each variable. Next, an energy value {e1, . . . ep} is calculated per variable from calculated coordinates. Lastly, a comparison is made of the energy values that have been calculated for the target data set with the energy values of that have been calculated for the reference data set in order to determine the degree of correlation anomalies that has occurred between the two data sets.

Description

BACKGROUND OF THE INVENTION[0001]1. Field of the Invention[0002]This invention relates to systems and methodologies for implementing fault analysis systems, and particularly to systems and methods for determining correlation anomalies of specified variables.[0003]2. Description of Background[0004]Before our invention popular approaches to the performance of correlation analysis usually comprised the utilization of a correlation coefficient or, equivalently, a covariance matrix. In the event that two covariance matrices were calculated from differently tagged data sets, the problem of correlation analysis was reduced to the comparison between two p-dimensional normal distributions, where p is the number of variables involved. Conventionally, several known methods exist to determine whether or not two covariance matrices are statistically identical. However, these methods are applicable only to very static data. These methods, when used for data that takes into consideration the condi...

Claims


Application Information

Patent Timeline
Patent Type & Authority Patents(United States)
IPC IPC(8): G01R31/28
CPCG06K9/6253G06F18/40
Inventor IDE, TSUYOSHISUZUKI, SHOKO
Owner INT BUSINESS MASCH CORP
Why Eureka
Try Eureka