Method and system for processing multi-dimensional measurement data

a multi-dimensional measurement and data processing technology, applied in particle spectrometer methods, instruments, material analysis, etc., can solve the problems of reducing the possibility of finding and affecting the effect of pattern recognition analysis

Inactive Publication Date: 2010-03-09
ROCHE DIAGNOSTICS OPERATIONS INC
View PDF13 Cites 25 Cited by
  • Summary
  • Abstract
  • Description
  • Claims
  • Application Information

AI Technical Summary

Benefits of technology

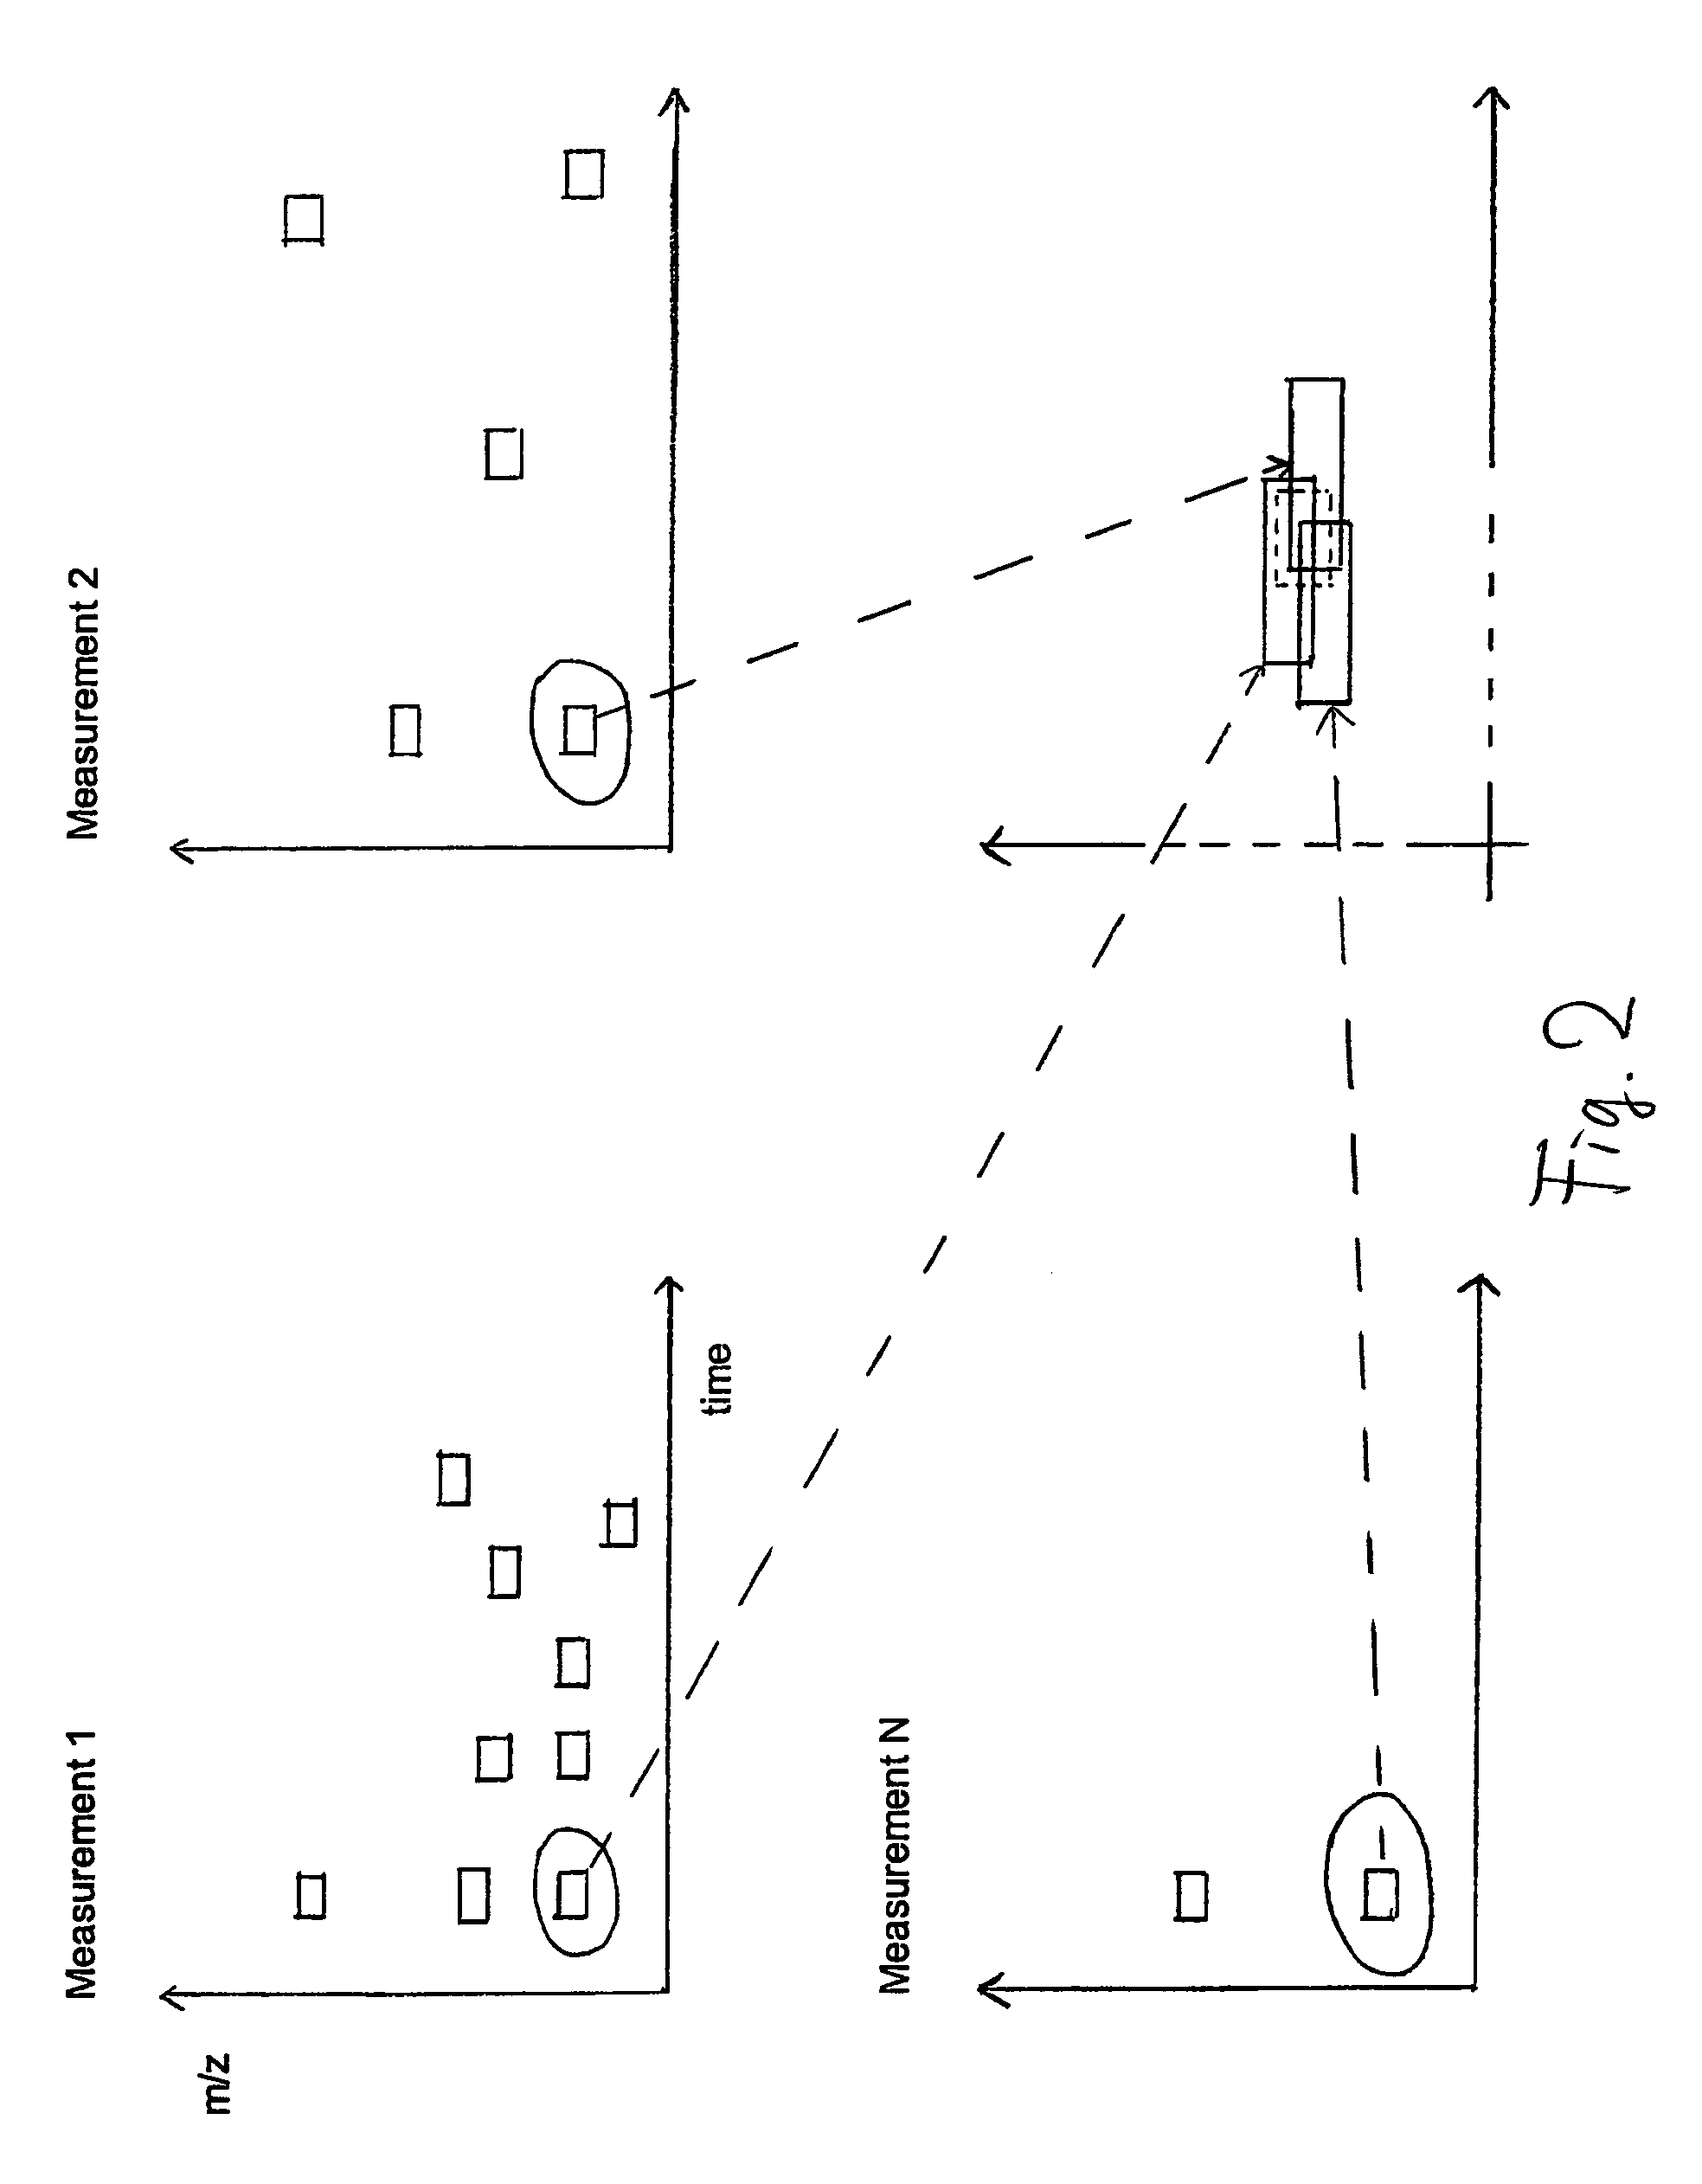
[0059]With respect to step e) should be added, that preferably only data or visualizations of data which reflect or include groups of data tuples obtained from said grouping or / and intervals of respective characterizing measurement values obtained from said grouping are stored or / and displayed or / and printed, and that other data not falling in the groups or intervals are discarded. This leads to a major data reduction. Additional reduction of data in the sense of some sort of data compression may be obtained if not the data tuple of a respective group or falling in a respective interval are stored but instead data describing the group or the interval, in the case of LC-MS data, e.g. an average m / z value, an average t value or N value and possibly a summarizing intensity value (e.g. the sum of all individual intensities, integral over the area under a curve defined by the data tuples, average intensity value, and the like). Additionally or alternatively to the average m / z value and t value or N value the m / z interval and t interval or N interval may be stored, possibly by storing the boundaries of the respective interval or by storing a central value and the width of the respective interval. However, it should be emphasized that such a data reduction and even data compression is not always necessary, in particular if large data storage space is available and if fast processors are available. Under such circumstances a grouping of the data as such may be of high value for facilitating the analysis of the data. E.g. data tuples belonging to the same group may be identified in a visualization of the data by attributing different colors to different groups, such as known from false color or phantom color representations, so that a qualitative analysis of the respective sample or samples is facilitated for the scientist or operator viewing the visualization on a display or on a printout.
[0275]On the basis of the knowledge about the applied techniques, e.g. about the chromatographic process and the mass spectrometric detection, many setting parameters of the data preprocessing and processing process may be automatically found, in particular for a statistical modeling on which the grouping is based. The estimate of the setting parameter can be done both sample specific for individual samples and globally for a number of samples, depending on what is representative according to the modeling applied. Thus, a manual setting of important parameters of the data preprocessing and processing can be avoided to a great extent or can at least be done appropriately and precise in view of the measurement situation and the sample or samples to be analyzed. This makes it easier to transmit the data preprocessing and processing from one instrument to another, from one operator to another.

Problems solved by technology

Due to the number of data points, a manual selection of relevant information is not imaginable, at least in practical applications; therefore a technological approach using a suitable algorithm is necessary.
For many 2-dimensional, 3-dimensional or even higher dimensional data sets, like LC-MS data, run-to-run variation on within the dimensions is observed as having a detrimental effect on pattern recognition analysis.
A false assignment of peaks to a chemical individual within the pattern reduces the possibility to find the ‘true’ pattern.

Method used


Image

  • Method and system for processing multi-dimensional measurement data
  • Method and system for processing multi-dimensional measurement data
  • Method and system for processing multi-dimensional measurement data

Examples


embodiments

[0461]As indicated, according to a preferred embodiment of the method, generally several samples are analyzed, namely blank samples, samples including only standards, real samples, calibration samples and real samples including internal standards. With reference to one real sample at least one associated standard measurement and at least one associated blank measurement should be used as basis for the initialization of the grouping with respect to the measurement data obtained from the real sample. Accordingly, first the measurement data for the blank sample and the standard sample have to be obtained before the grouping for the real sample is started. However, it should not be ruled out, that the data preprocessing and processing is effected globally with respect to a data set including all measurement data for said samples. Further, it should not be ruled out, that a data preprocessing and data processing is already effected simultaneously in course of effecting the techniques pro...

example

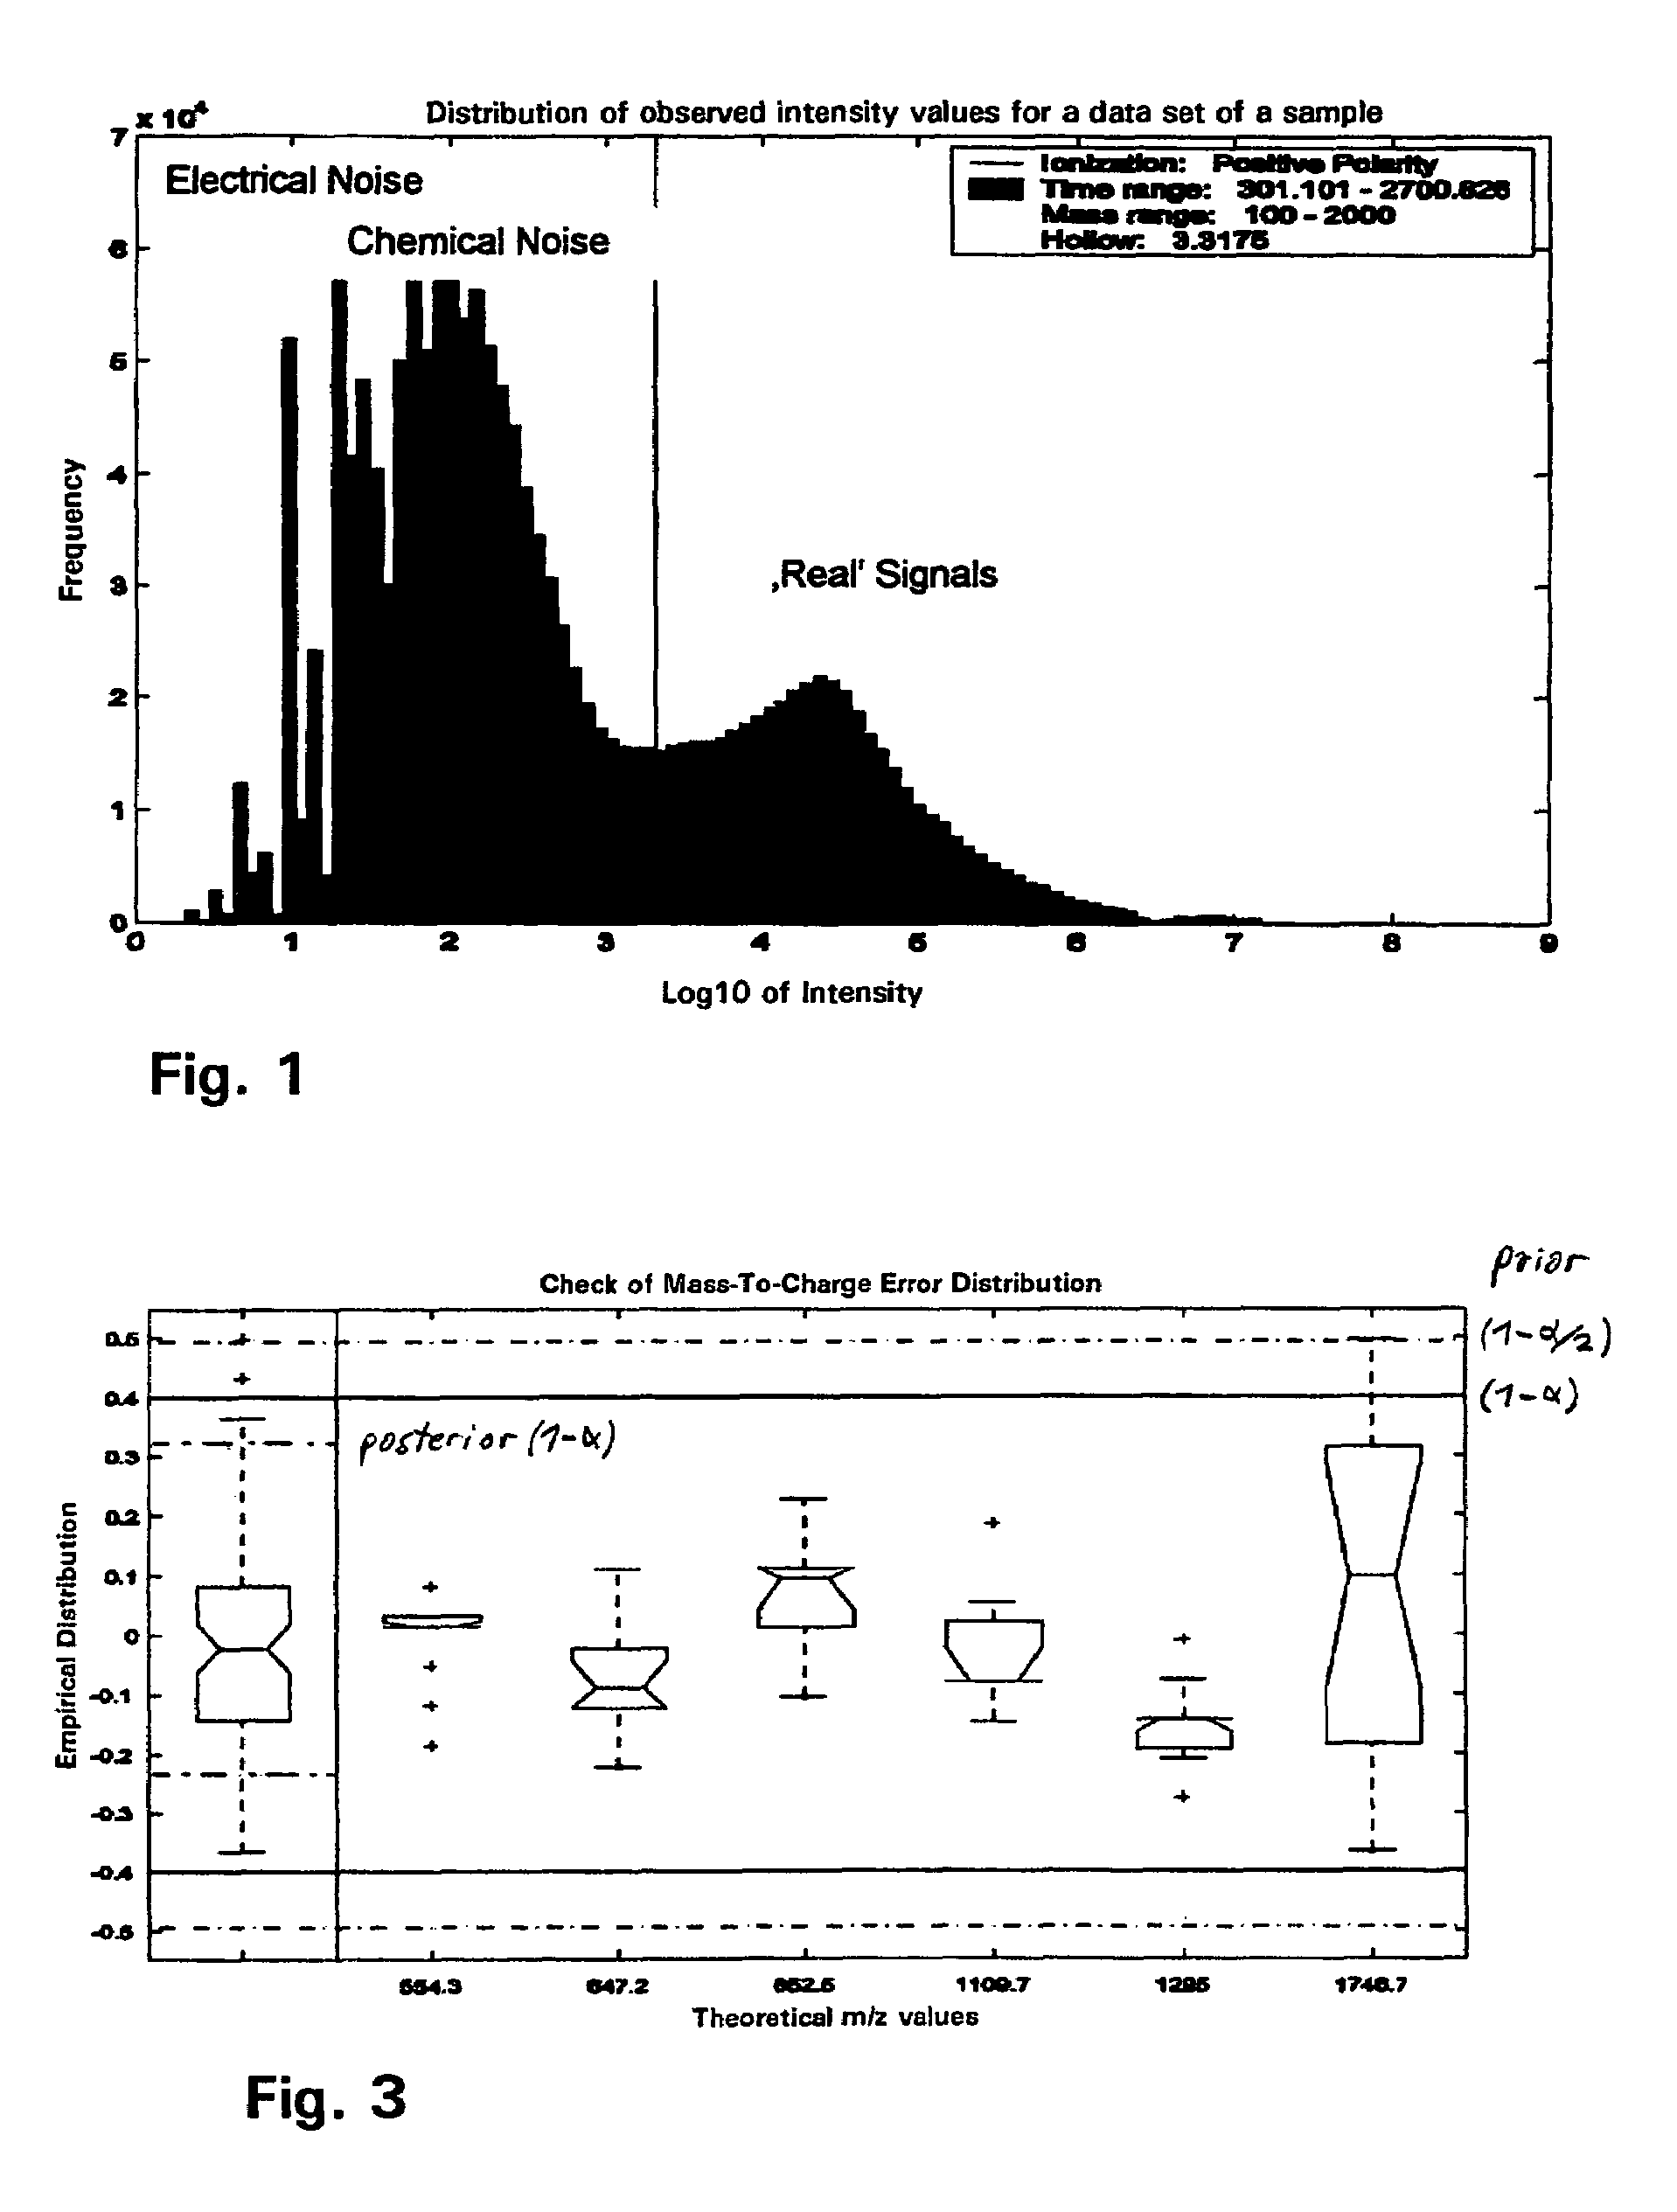
[0521]The data preprocessing and data processing in its various aspects was applied to an LC-ESI-MS set of data of a serum sample. By denoising, spike identification, deleting the sequence of the mobile phase and the internal standards and grouping the peaks into variable bins a new set of data was generated which keeps the complete relevant information about position and intensity of the “real” peaks while considerably reducing the amount of data. The raw data included about three million single data points, corresponding to an amount of data of about 22 MB. After the preprocessing and processing 1087 peaks remained, corresponding to an amount of data of about 700 kB. Accordingly, a considerable data reduction and compression was obtained, although all information was maintained which is needed for characterizing the sample with respect to constituents included therein.

[0522]FIG. 25 is a comparison of a three-dimensional representation of a LC-MS data set before (FIG. 25a; raw data...

numerical example

[0523]With reference to FIG. 26, which shows a diagram representing a peak found by grouping in a large LC-MS raw data set and with reference to a grouping protocol shown in FIGS. 27 to 78, in which protocol data representing the grouping underlying the grouping result according to FIG. 26 are included, a preferred embodiment of the grouping is further illustrated. FIGS. 27 to 78 represent an excerpt from the grouping protocol having many grouping protocol pages.

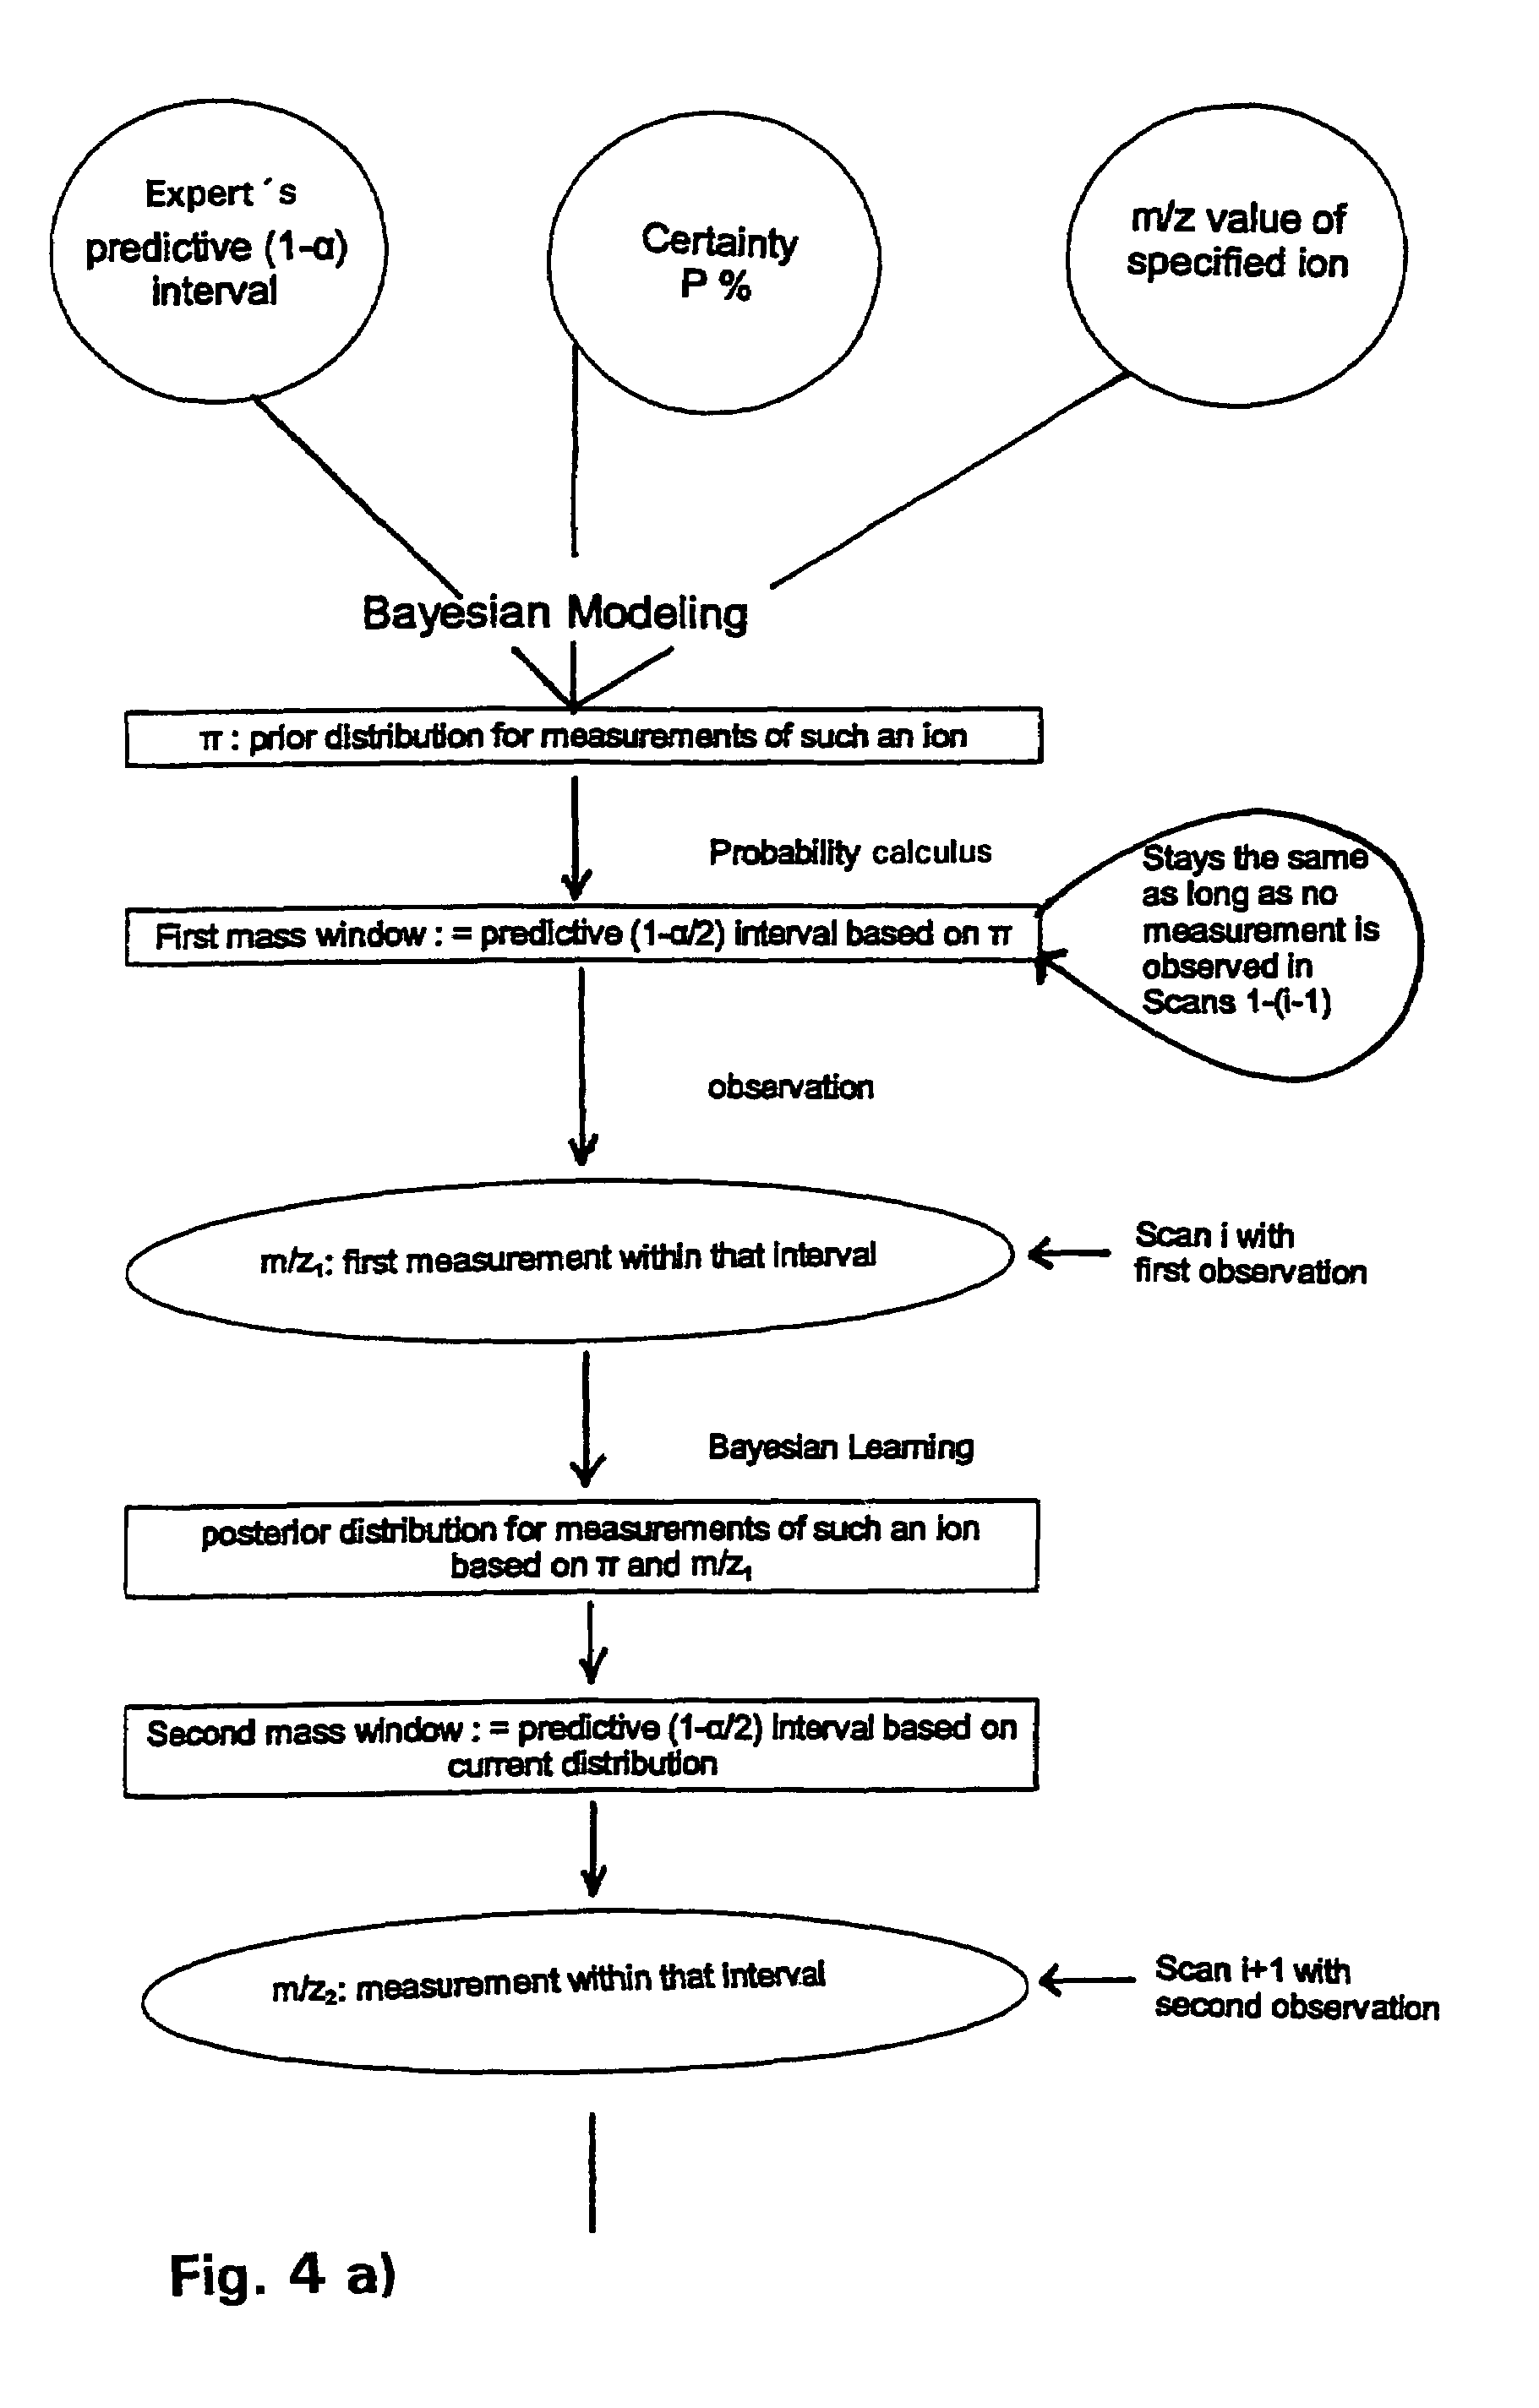
[0524]In an introductory portion 10 of the grouping protocol, on grouping protocol page 1 of FIG. 27, some parameters are given, on which the grouping is based. Important parameters are an intensity cutoff threshold, an unimodality cutoff threshold and a kurtosis cutoff threshold. In sections 12 and 14 of the protocol the type of prior distribution assumed and initialization data for the Bayesian statistics are given.

[0525]For reasons of simpler data processing, not the whole mass-to-charge axis is considered at once when sc...


PUM

PropertyMeasurementUnit
massaaaaaaaaaa
massaaaaaaaaaa
massaaaaaaaaaa

Abstract

The invention provides a method for grouping measurement data obtained by effecting two or more techniques to provide characterization data characterizing at least one sample with respect to characterizing substances. According to one aspect of the invention, the grouping is effected on the basis of at least one statistical distribution of deviations (Δm / zi) of a respective characterizing measurement value. According to another aspect of the invention, the grouping is effected on the basis of at least one collective characteristic of a plurality of respective quantitative measurement values (Ii).

Description

CROSS-REFERENCE TO RELATED APPLICATIONS[0001]This application claims priority under 35 U.S.C. §119, via the Paris Convention for the Protection of Industrial Property, to European patent application number 04009709.9, filed Apr. 23, 2004, which is hereby incorporated by reference.FIELD OF THE INVENTION[0002]This invention relates to sample analysis and preprocessing of data using a plurality of analyzing techniques to generate and group data tuples into intervals.BACKGROUND OF THE INVENTION[0003]Data preprocessing aimed at reducing the amount of data and extracting relevant information from multi- or high-dimensional data is a step of many data analysis techniques. For example, a Liquid Chromatography / Mass Spectrometry (LC-MS) data set may consist of several hundred scans with a broad mass range, e.g., from app. 50-100 Da to several thousand Da (typically 2000-10000 Da) expressed in mass / charge (m / z) values. A data set of a single measurement consists of millions of data points that...

Claims


Application Information

Patent Timeline
Patent Type & Authority Patents(United States)
IPC IPC(8): G01N33/48G01N27/62G01N30/72G01N30/86G06F17/00
CPCG01N30/8624H01J49/0027G01N30/8682G01N2030/862
Inventor GARCZAREK, URSULAKUBALEC, PAVELHOSEL, WOLFGANG
Owner ROCHE DIAGNOSTICS OPERATIONS INC
Why Eureka
Try Eureka