Data mining using variable rankings and enhanced visualization methods

a data mining and variable ranking technology, applied in the field of data mining, can solve the problems of insufficient user flexibility for evaluating existing data mining methods, lack of scientific approaches to selecting an appropriate method, and insufficient user flexibility of existing data mining methods

Active Publication Date: 2011-02-22
WRP IP MANAGEMENT LLC
View PDF8 Cites 1 Cited by
  • Summary
  • Abstract
  • Description
  • Claims
  • Application Information

AI Technical Summary

Benefits of technology

[0012]The computer program products for performing data mining using rankings of highly-attributed categorical variables and enhanced visualization methods include a storage medium readable by a processing circuit and storing instructions for execution by the processing circuit for facilitating a method. The method includes mining data using a method for ranking each of a plurality of variables. A tree diagram is generated from the mined data using any tree mining method suitable for a numeric target with categorical predictor variables. A population and a target value are obtained from a top node or a top field of the tree diagram. The population and the target value are stored by appending the population and the target value to a listing of sequential top node parameters. The top node or top field is removed from the variables mined by the tree mining method to create a new tree diagram with a next top node or a next top field. Obtaining a next population and a next target value for the next top node or the next top field, appending the next population and the next target value to the listing of sequential top node parameters, and removing the top node or top field from the variables used to obtain the new tree diagram, are repeated until the new tree diagram does not contain any more nodes or fields. The listing of sequential top node parameters is plotted on a tree cusp curve using at least one of a left branch of the tree cusp curve or a right branch of the tree cusp curve. The tree cusp curve provides a graphical user interface enabling visual identification of one or more fields which affect a greatest number of records, or one or more fields which affect a least number of records, based upon a magnitude of departure of the one or more fields from a norm as displayed on the tree cusp curve.

Problems solved by technology

Unfortunately, scientific approaches for selecting an appropriate method are lacking.
It is apparent that these data mining methods go far beyond anything discoverable with conventional statistical hypothesis testing.
Existing data mining methods provide insufficient user flexibility for evaluating and iteratively determining the most effective data mining approach for a given operational setting.
More specifically, many existing methods do not permit selection of a variable ranking method, and many do not permit changing the rankings of data mining results.
Some of the data mining methods offered by IM4D allow the selection of a variable ranking method such as chi-squared versus entropy, but this capability is not provided if one wishes to use IM4D to implement a classification tree or perform neural classification.
Another shortcoming of existing data mining methods is that they do not provide a graphical user interface that enable users to accurately assess the significance of mining results.
When assessing mining results from a classification tree, it is often difficult or impossible to determine the top ten (or top x) most significant results, where x is an integer from 1 to 100.
Even here, it is difficult to judge by eye which results are the most significant.
The problem with this approach is that each node represents a smaller population so it is easy to misrepresent what is important for an entire dataset when finding the best field to split a node in a far or remote region of the entire dataset.

Method used


Image

  • Data mining using variable rankings and enhanced visualization methods
  • Data mining using variable rankings and enhanced visualization methods
  • Data mining using variable rankings and enhanced visualization methods

Examples


Embodiment Construction

[0029]In the following description, details are set forth to provide an understanding of the invention. In some instances, certain software, circuits, structures and methods have not been described or shown in detail in order not to obscure the invention. The term “data processing system” is used herein to refer to any machine for processing data, including the client / server computer systems and network arrangements described herein. The present invention may be implemented in any computer programming language provided that the operating system of the data processing system provides the facilities that may support the requirements of the present invention. The invention may be implemented with software, firmware, or hardware, or any of various combinations thereof.

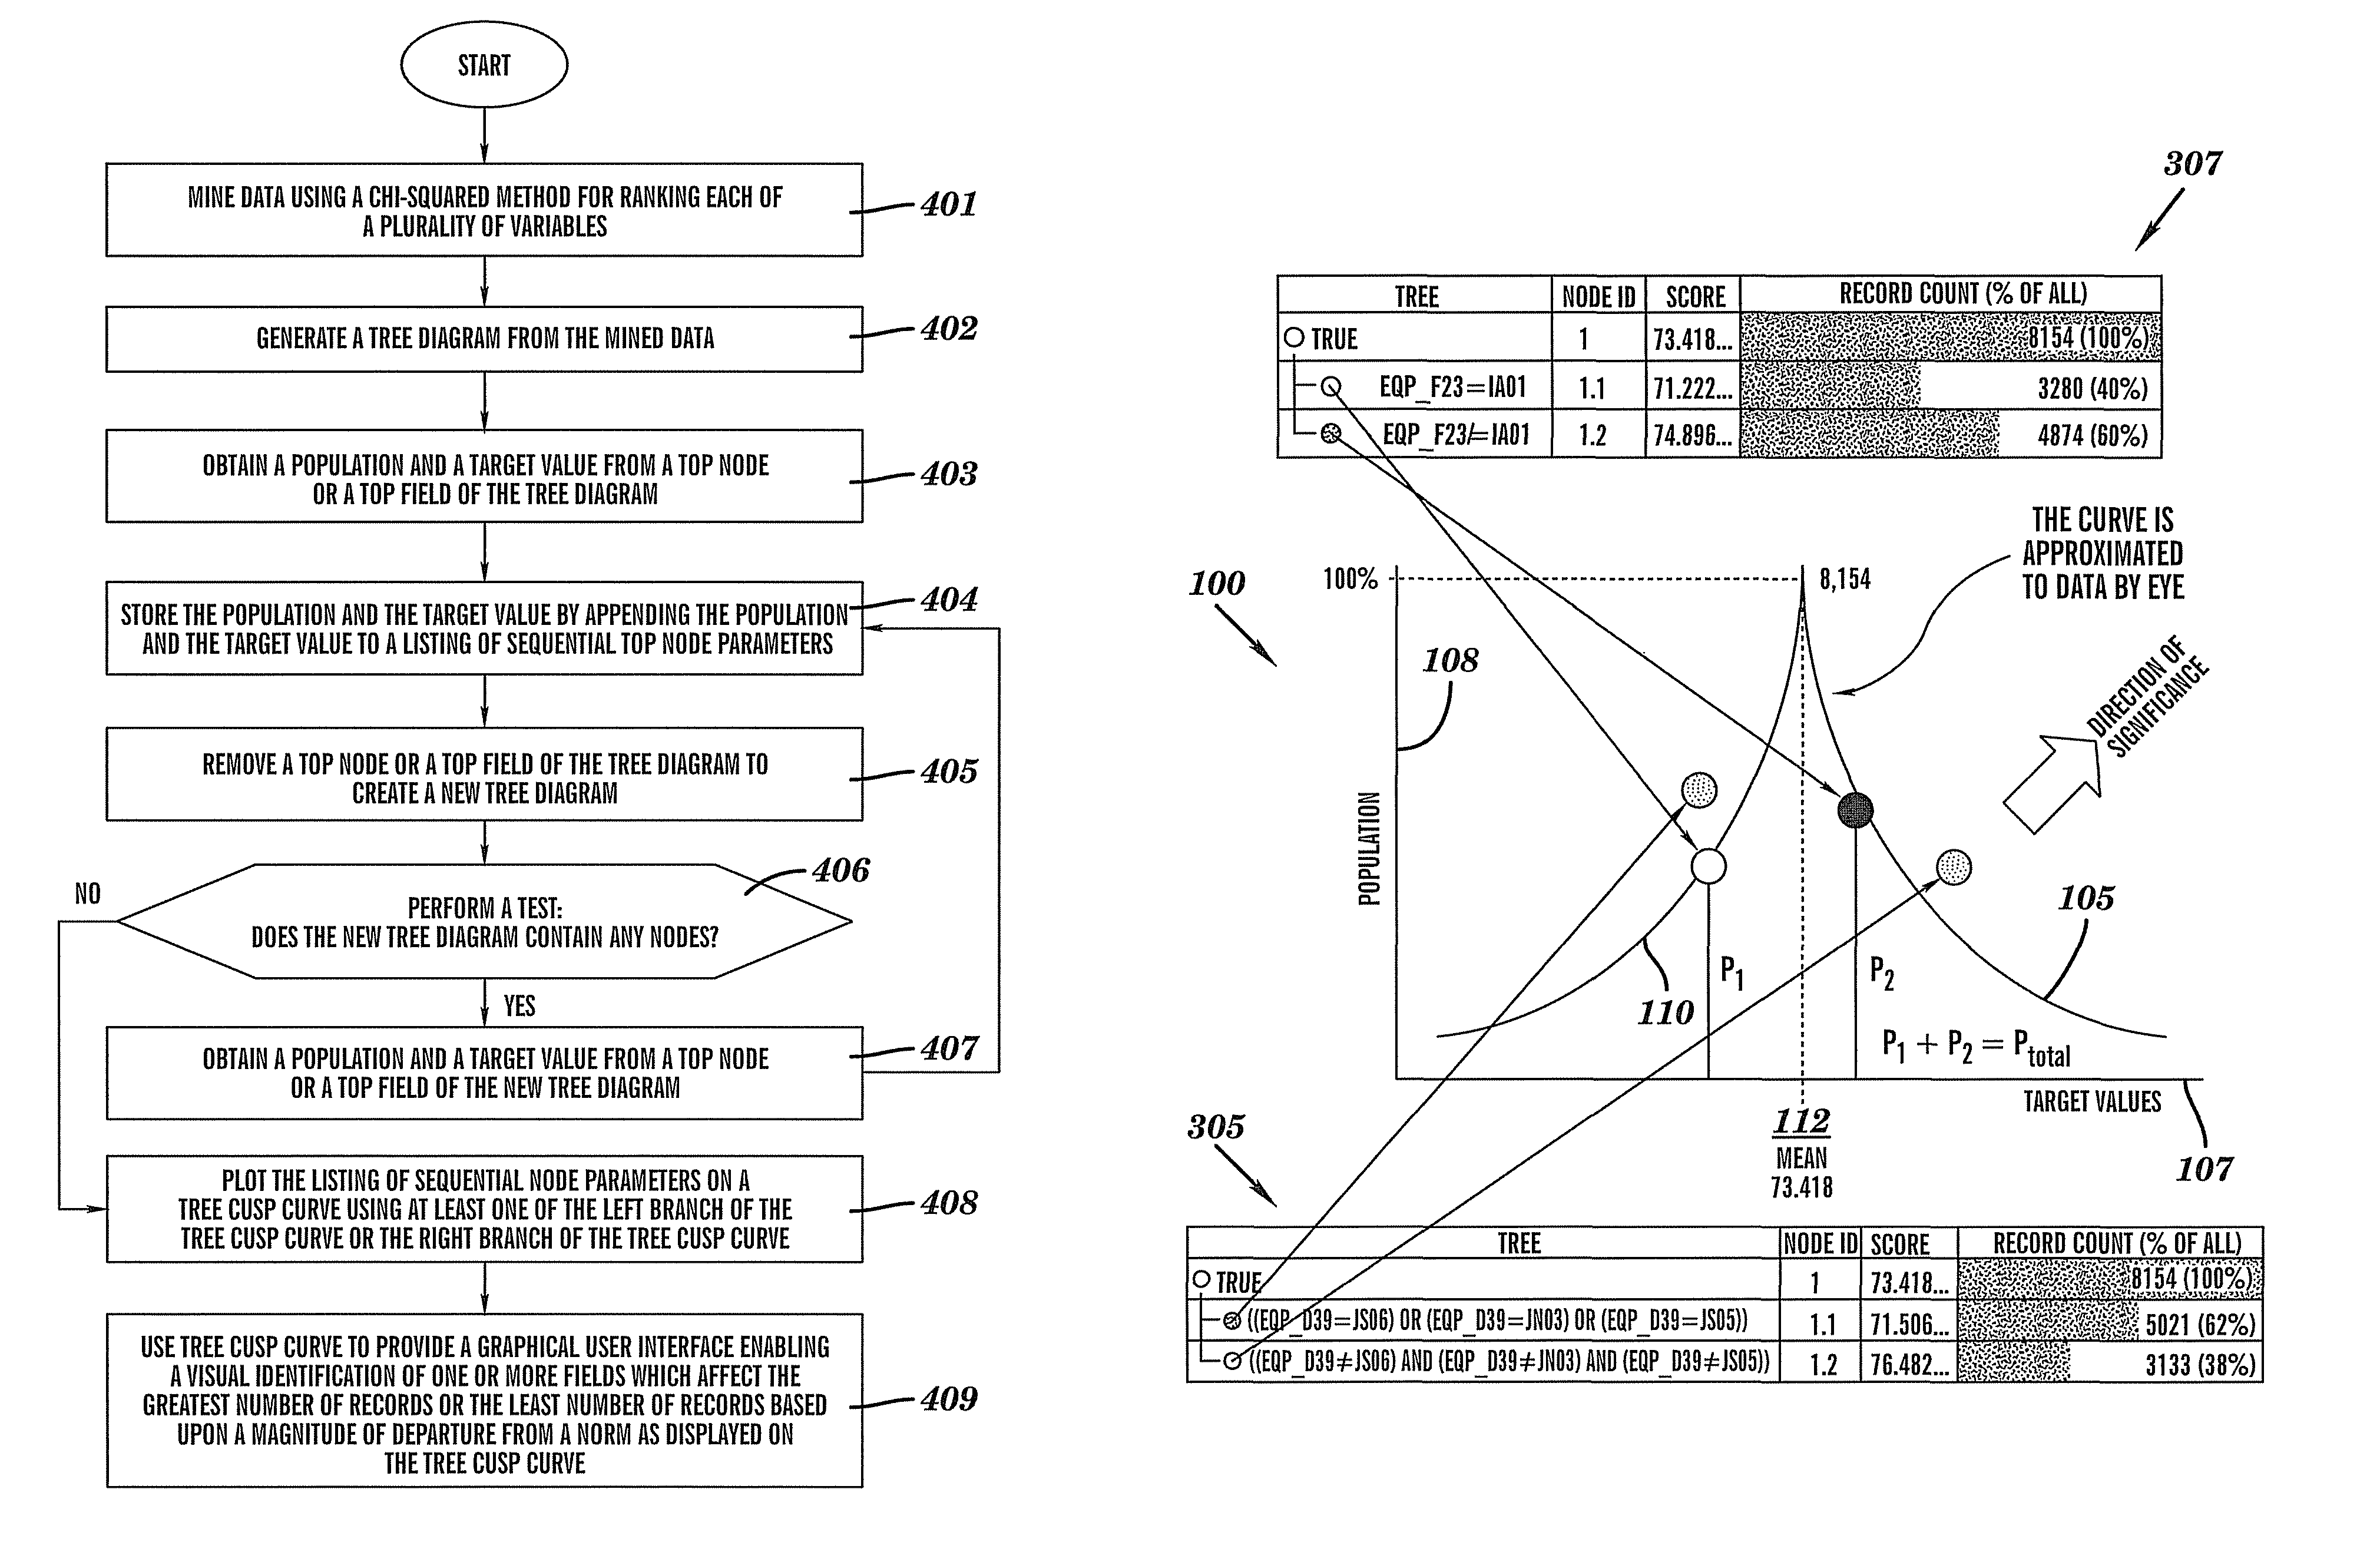
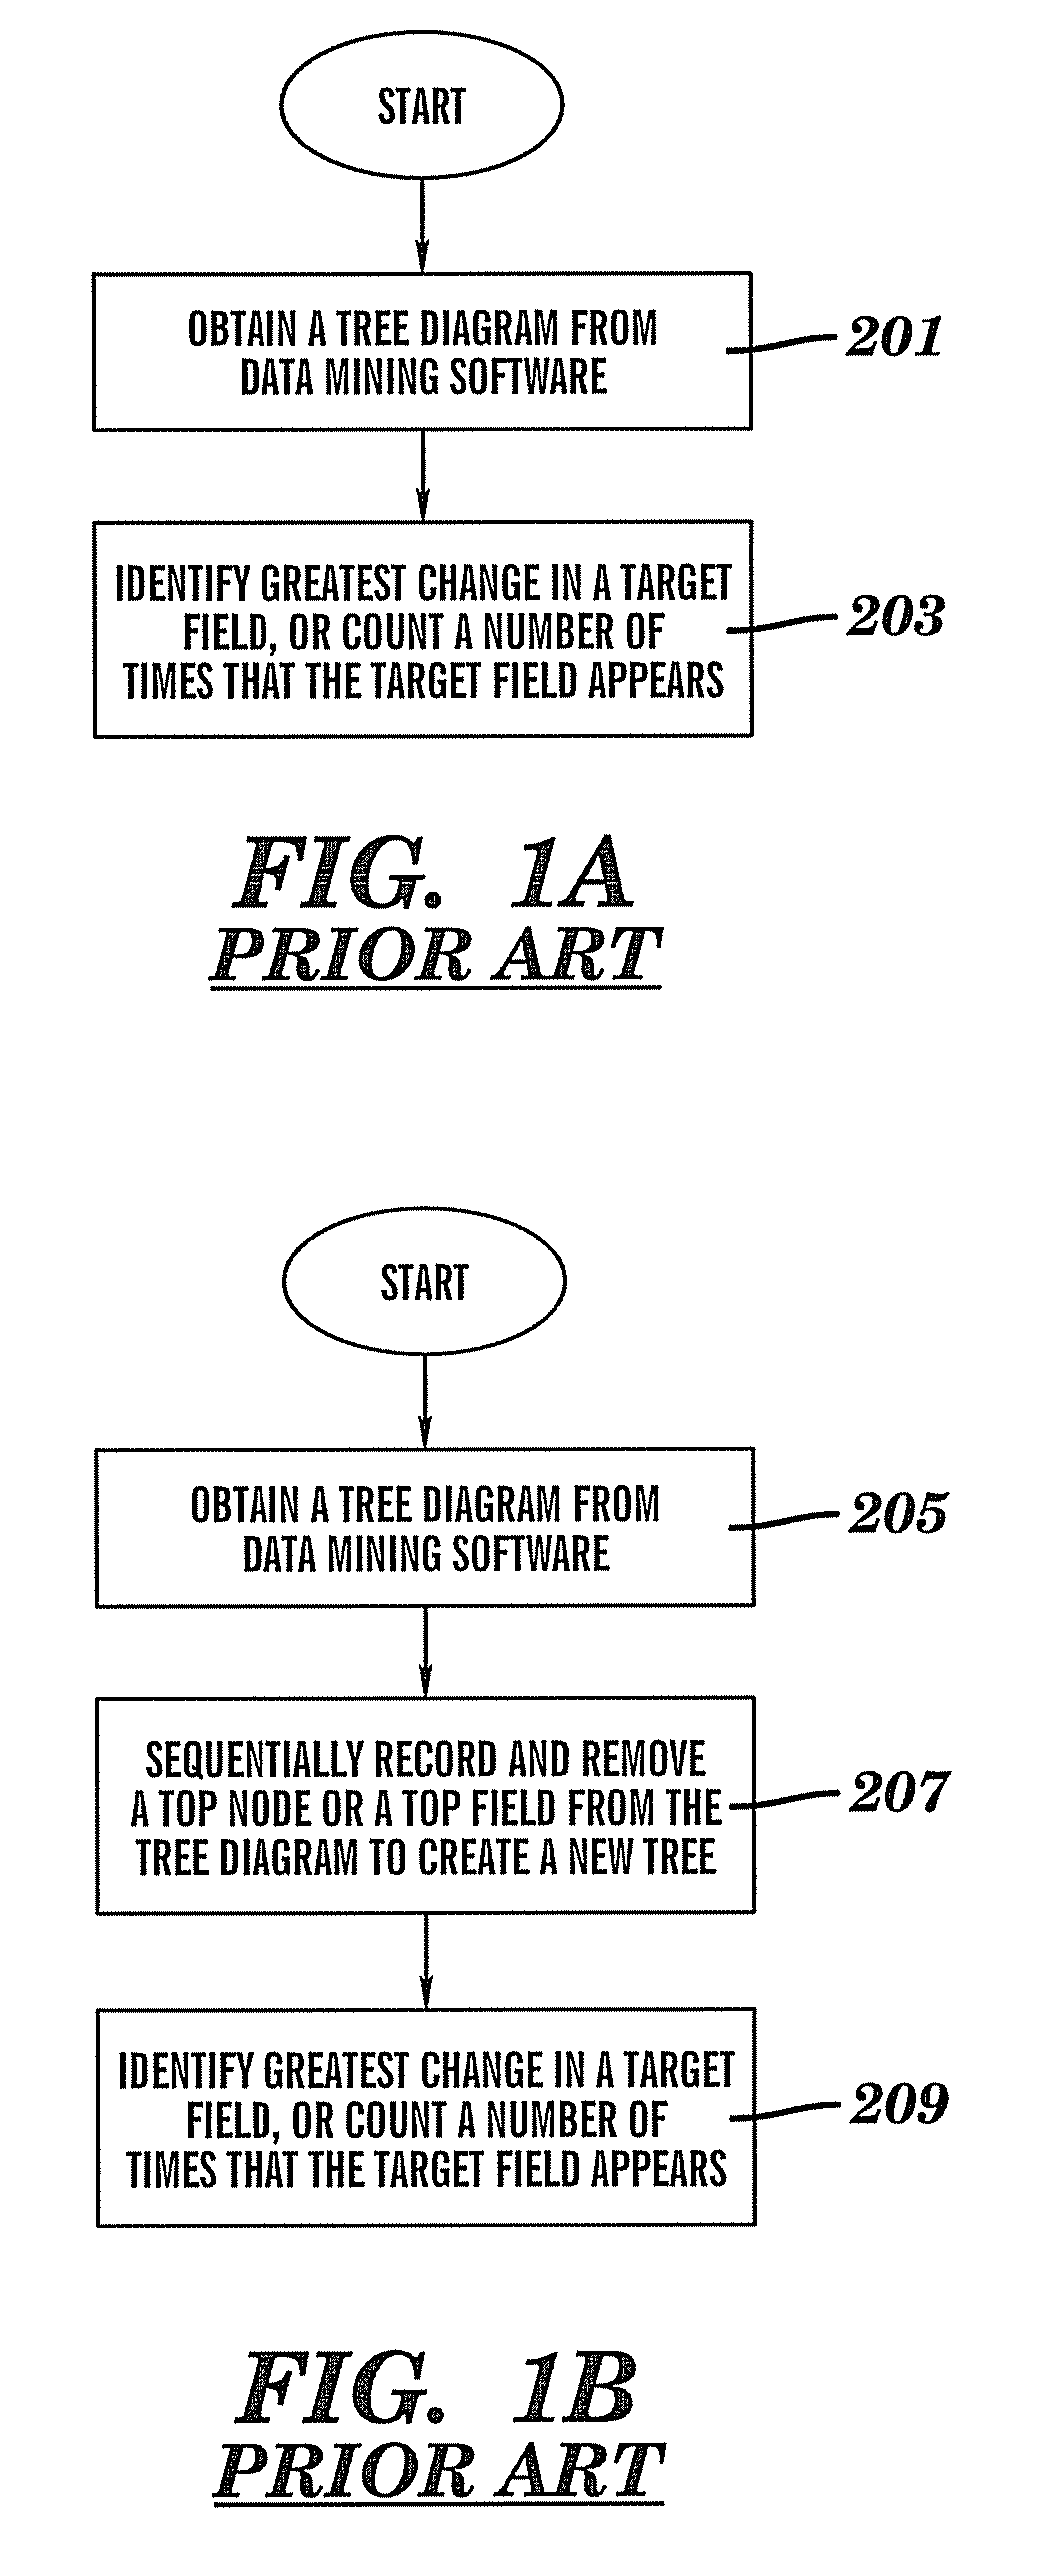
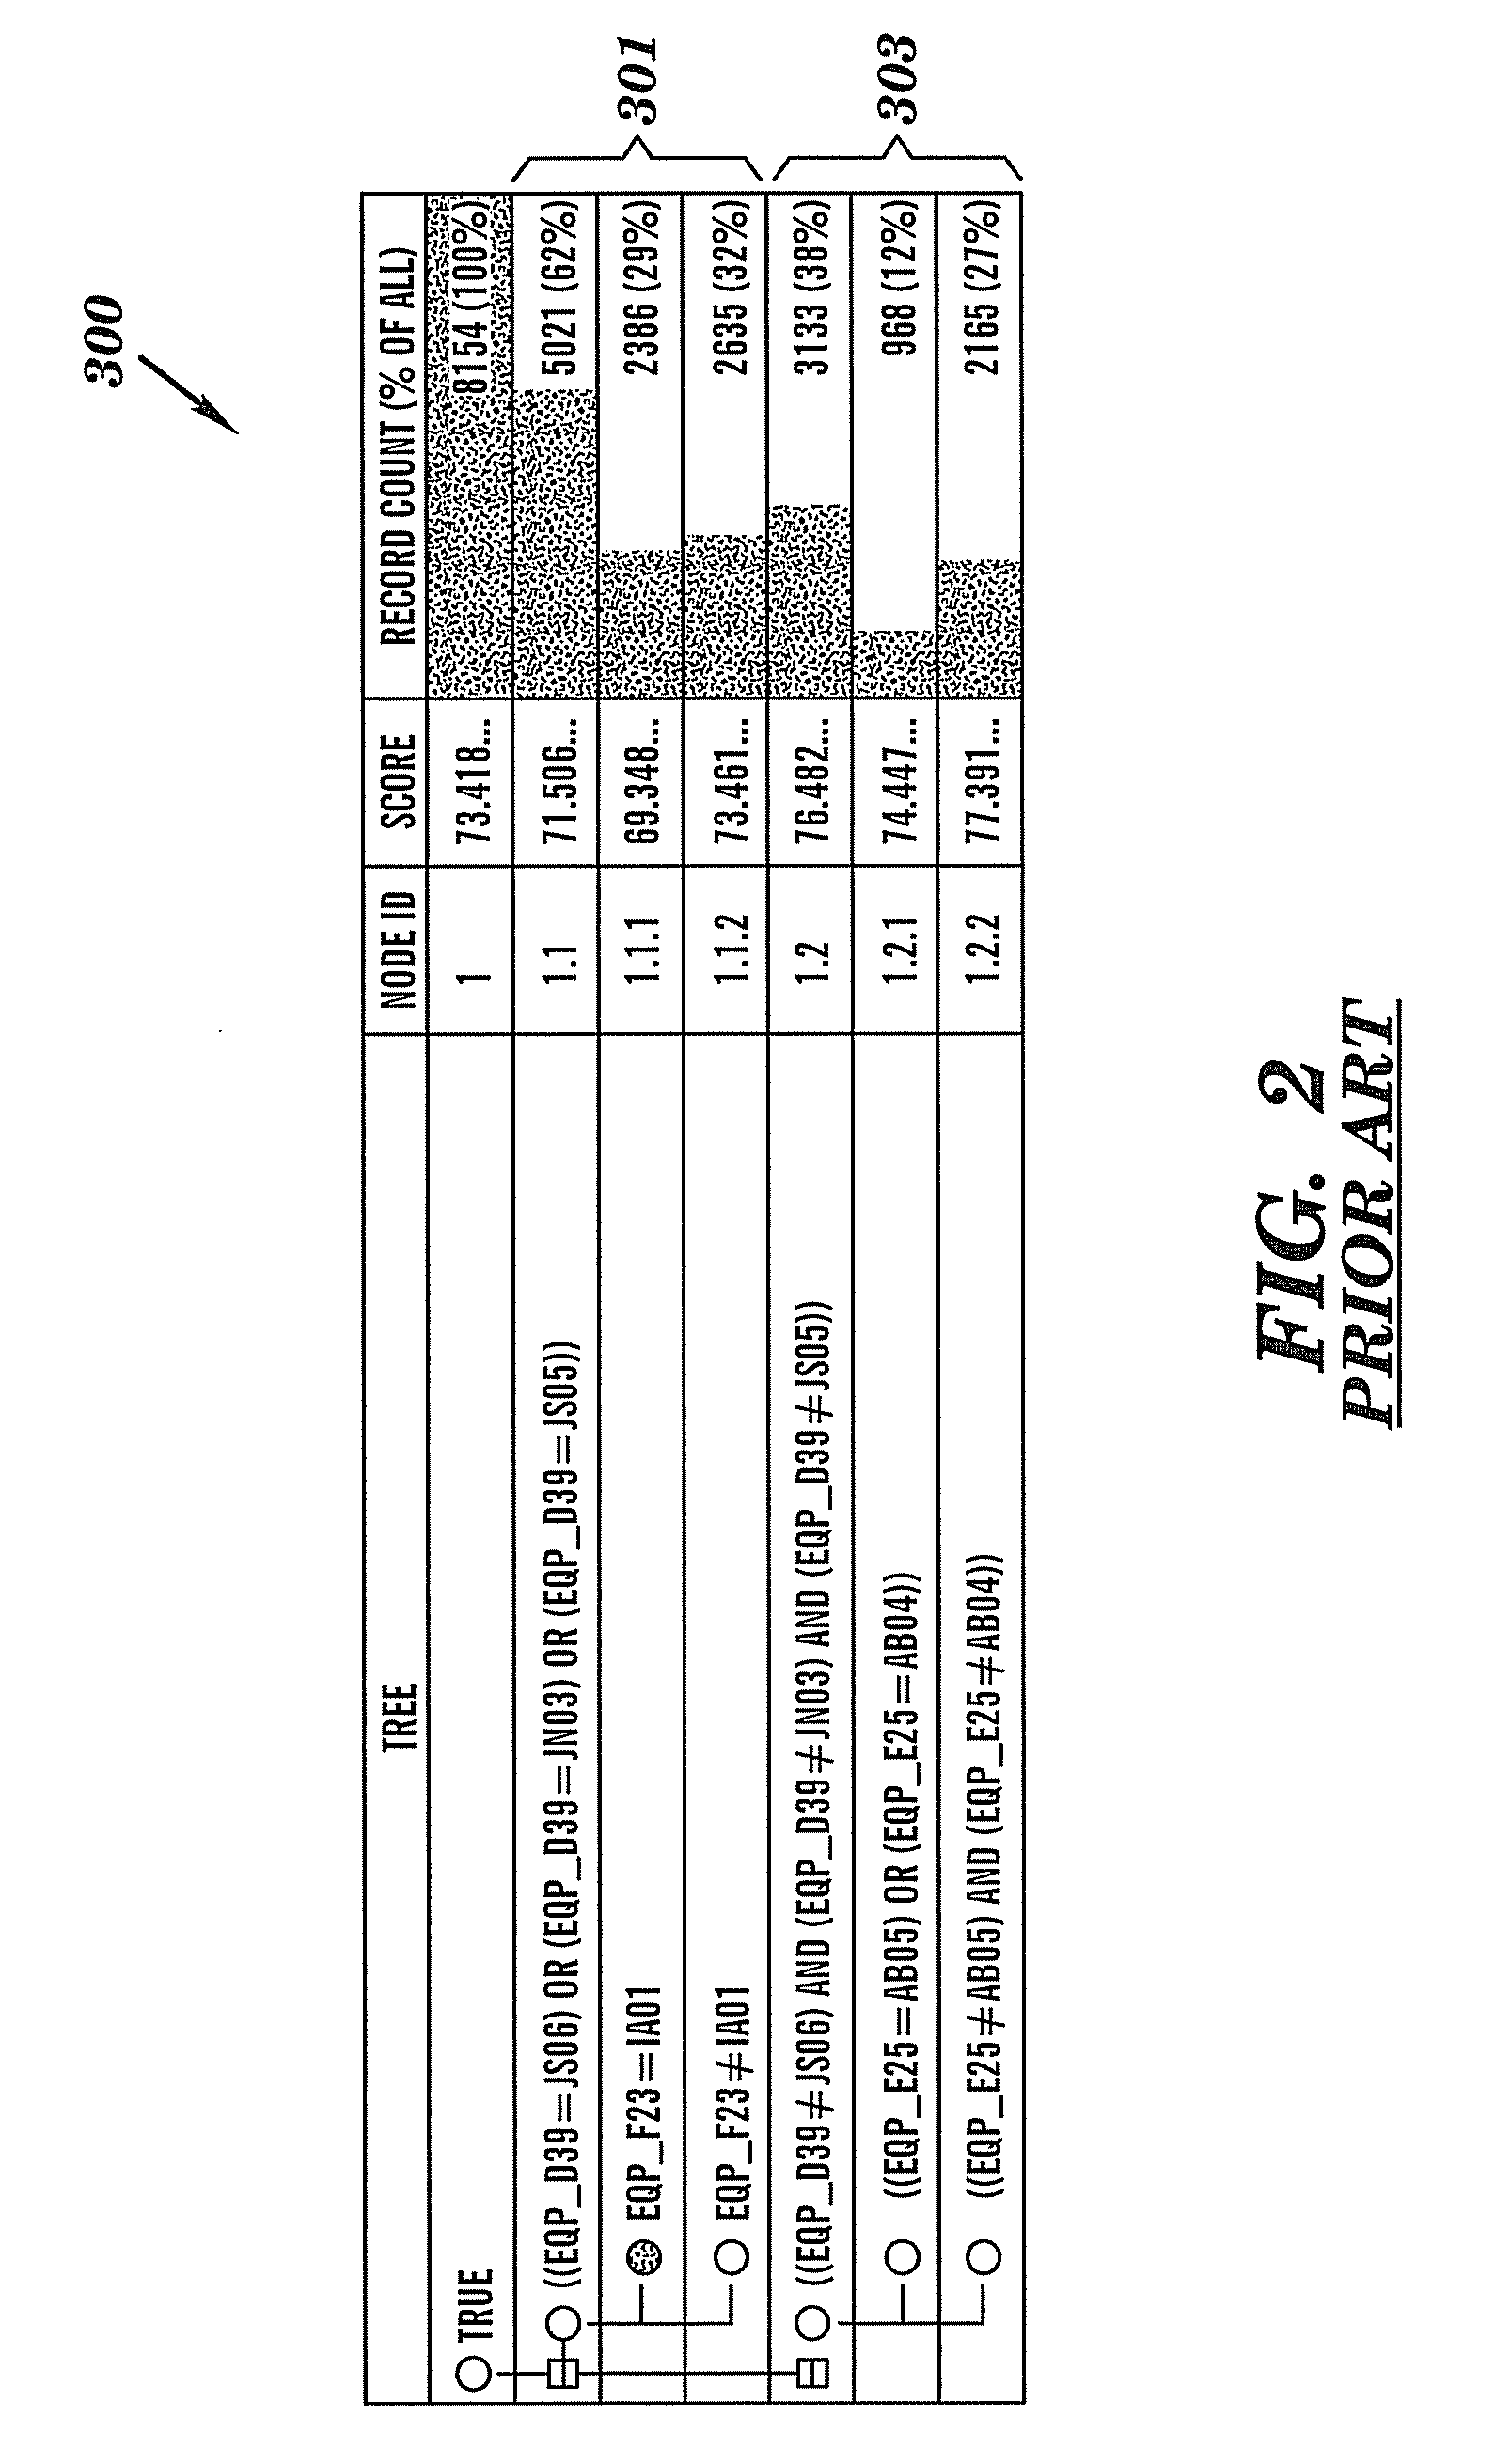
[0030]FIGS. 1A and 1B are flow diagrams describing prior art methods for performing data mining using tree diagrams. The procedure of FIG. 1A commences at block 201 where a tree diagram is obtained from data mining softwar...


PUM


Abstract

Dimensional data with attributed categorical variables is mined against a continuous target with any data mining method by ranking variables. The ranked variables are used to generate a tree. A population and a target value, obtained from a top node of the tree, are stored. The top node is removed from the tree to create a new tree with a next top node. Obtaining and storing a next population and a next target value for the next top node, and removing the top node or top field to create a new tree, are repeated. The listing of sequential top node parameters is plotted on a tree cusp curve that provides a graphical user interface enabling identification of a field which affect a greatest or a least number of records, based upon a magnitude of departure of the field from a norm.

Description

TRADEMARKS[0001]IBM® is a registered trademark of International Business Machines Corporation, Armonk, N.Y., U.S.A. Other names used herein may be registered trademarks, trademarks or product names of International Business Machines Corporation or other companies.BACKGROUND OF THE INVENTION[0002]1. Field of the Invention[0003]This invention relates generally to data mining and, more particularly, to exploratory data mining using chi-squared variable rankings and enhanced visualization methods.[0004]2. Description of Background[0005]A single data mining method that works best in all possible scenarios has yet to be discovered. In order to address a particular data mining problem, it may be necessary to select an appropriate data mining method from a myriad of available alternatives. Unfortunately, scientific approaches for selecting an appropriate method are lacking. Selections are typically based upon experience, familiarity, personal preference, or commercial availability. Whereas ...

Claims


Application Information

Patent Timeline
Patent Type & Authority Patents(United States)
IPC IPC(8): G06F17/00
CPCG06F17/30536G06F17/30705G06F2216/03G06F16/35G06F16/2462
Inventor BARBEE, STEVEN G.CHU, BENJAMIN R.HOPKINS, JOHN W.
Owner WRP IP MANAGEMENT LLC
Why Eureka
Try Eureka