Visualization of airline flight schedules

a flight schedule and airline technology, applied in the field of modeling the operations of commercial airlines, can solve the problems of limited value in analyzing process interactions, lack of detailed description of the routing and sequencing of information flows between the different functional groups, and inability to identify problem areas and assess, so as to reduce flight disruptions

Inactive Publication Date: 2011-03-22
THE BOEING CO
View PDF14 Cites 14 Cited by
  • Summary
  • Abstract
  • Description
  • Claims
  • Application Information

AI Technical Summary

Benefits of technology

[0011]An important advantage of the invention is that the impact of a product solution for reducing flight disruptions can be visually demonstrated over an entire flight schedule. “As is’ and “what if” scenarios are visually depicted in realistic 4-D, allowing a customer to see multiple downstream effects of an initial disruption on a flight schedule, and how those effects are reduced or eliminated through the use of a proposed product solution. Another feature of the invention is that the customer can also view graphical data representing airline operations for both “as is “and what if” cases, allowing a side-by-side comparison of the information.
[0012]Various additional objects, features and advantages of the present invention can be more fully appreciated with reference to the detailed description and accompanying drawings that follow.

Problems solved by technology

Although these methods may illustrate some functional relationships at a relatively high level, they are of limited value in analyzing process interactions because they typically lack detailed information about the various attributes (e.g., cost, time, etc.) associated with each process.
Further, these methods also tend to lack a detailed description of the routing and sequencing of information flows between the different functional groups.
As a result, such methods offer little assistance in identifying problem areas and assessing the impact of changes to a particular process.
One problem facing companies that produce and market such products and services is how to justify the investment in the product or service to the airline operator.
The downside of this approach, however, is that the fictitious model may or may not be a realistic simulation of the actual airline.
As a result, the airline operator may have a hard time visualizing and understanding the benefits of the product or service, and may remain unconvinced of the value to their airline.
Proving the value of goods and services is particularly difficult where the business case depends on assessing the impact of a product or service on airline flight schedules.
In the past, this demonstration has been limited to generating simple data showing how the product or service can reduce the impact of disruptions on a single facet of airline operations such as congestion at a particular airport during a specific time interval, or the availability of gates for a particular aircraft.
The value of such demonstration data is limited in its marketing impact since it does not give the customer a total view of the effect on all of the customer's flight operations and aircraft.
Complicating the problem of providing a complete overview of the impact of a product on disrupted flight schedules is the fact that a single initial disruption in an airline schedule can result in a delay which is propagated throughout the customer's flight schedule, resulting in numerous additional delays and related operations problems for multiple legs of the flight schedule.
Adding to the difficulty of predicting the effects of flight disruptions is the problem of predicting the severity of propagated flight disruptions.
Thus, without a method for providing the customer with a visualized demonstration of a proposed product showing overall impact on all aspects of flight operations, it is difficult to build an economic case to support use of the product.

Method used


Image

  • Visualization of airline flight schedules
  • Visualization of airline flight schedules
  • Visualization of airline flight schedules

Examples


Embodiment Construction

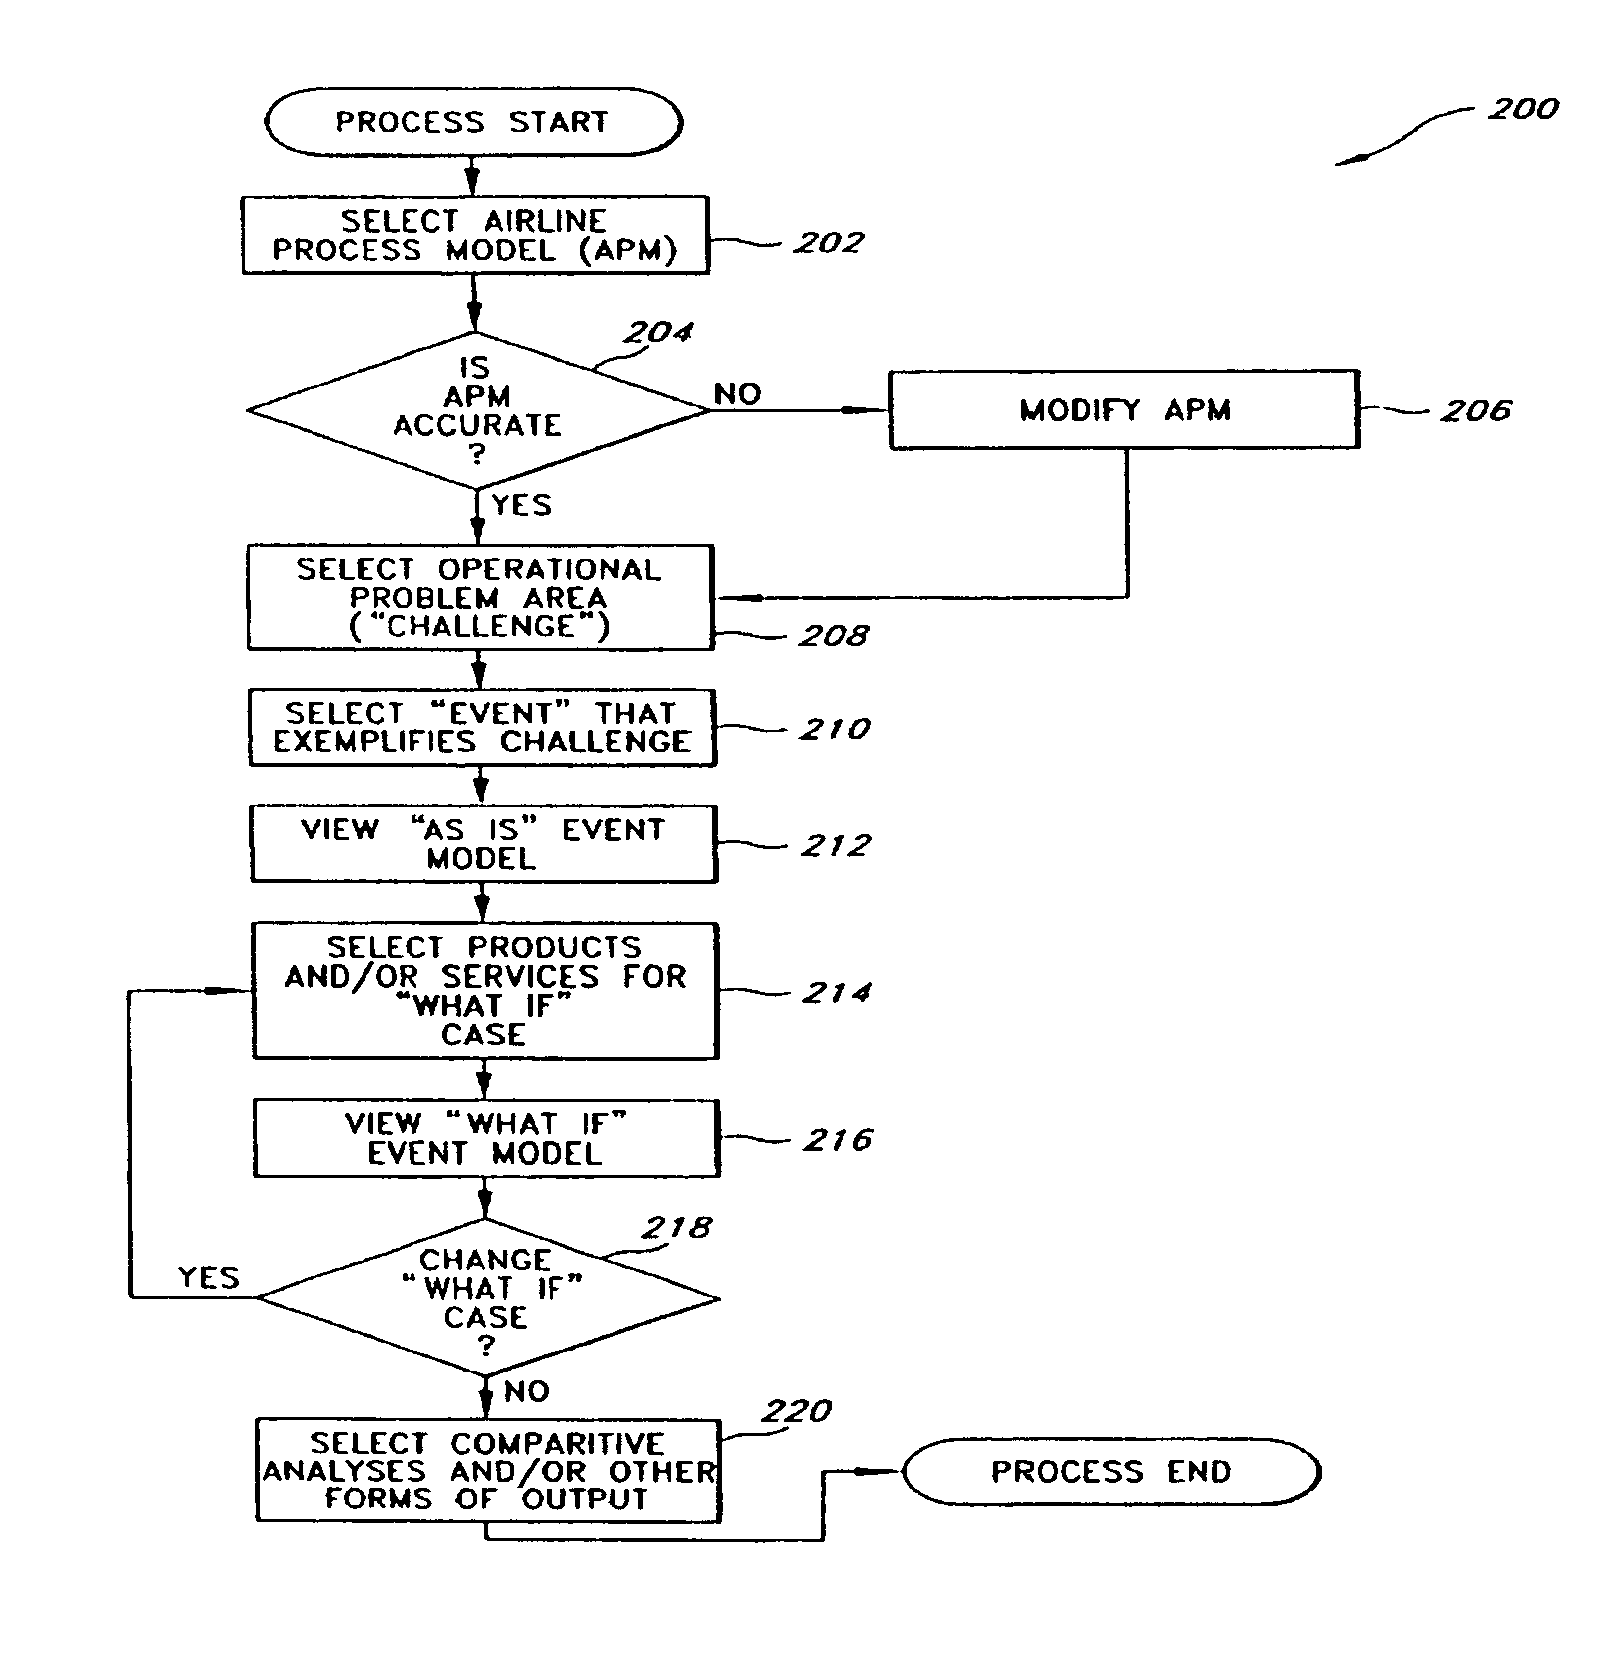
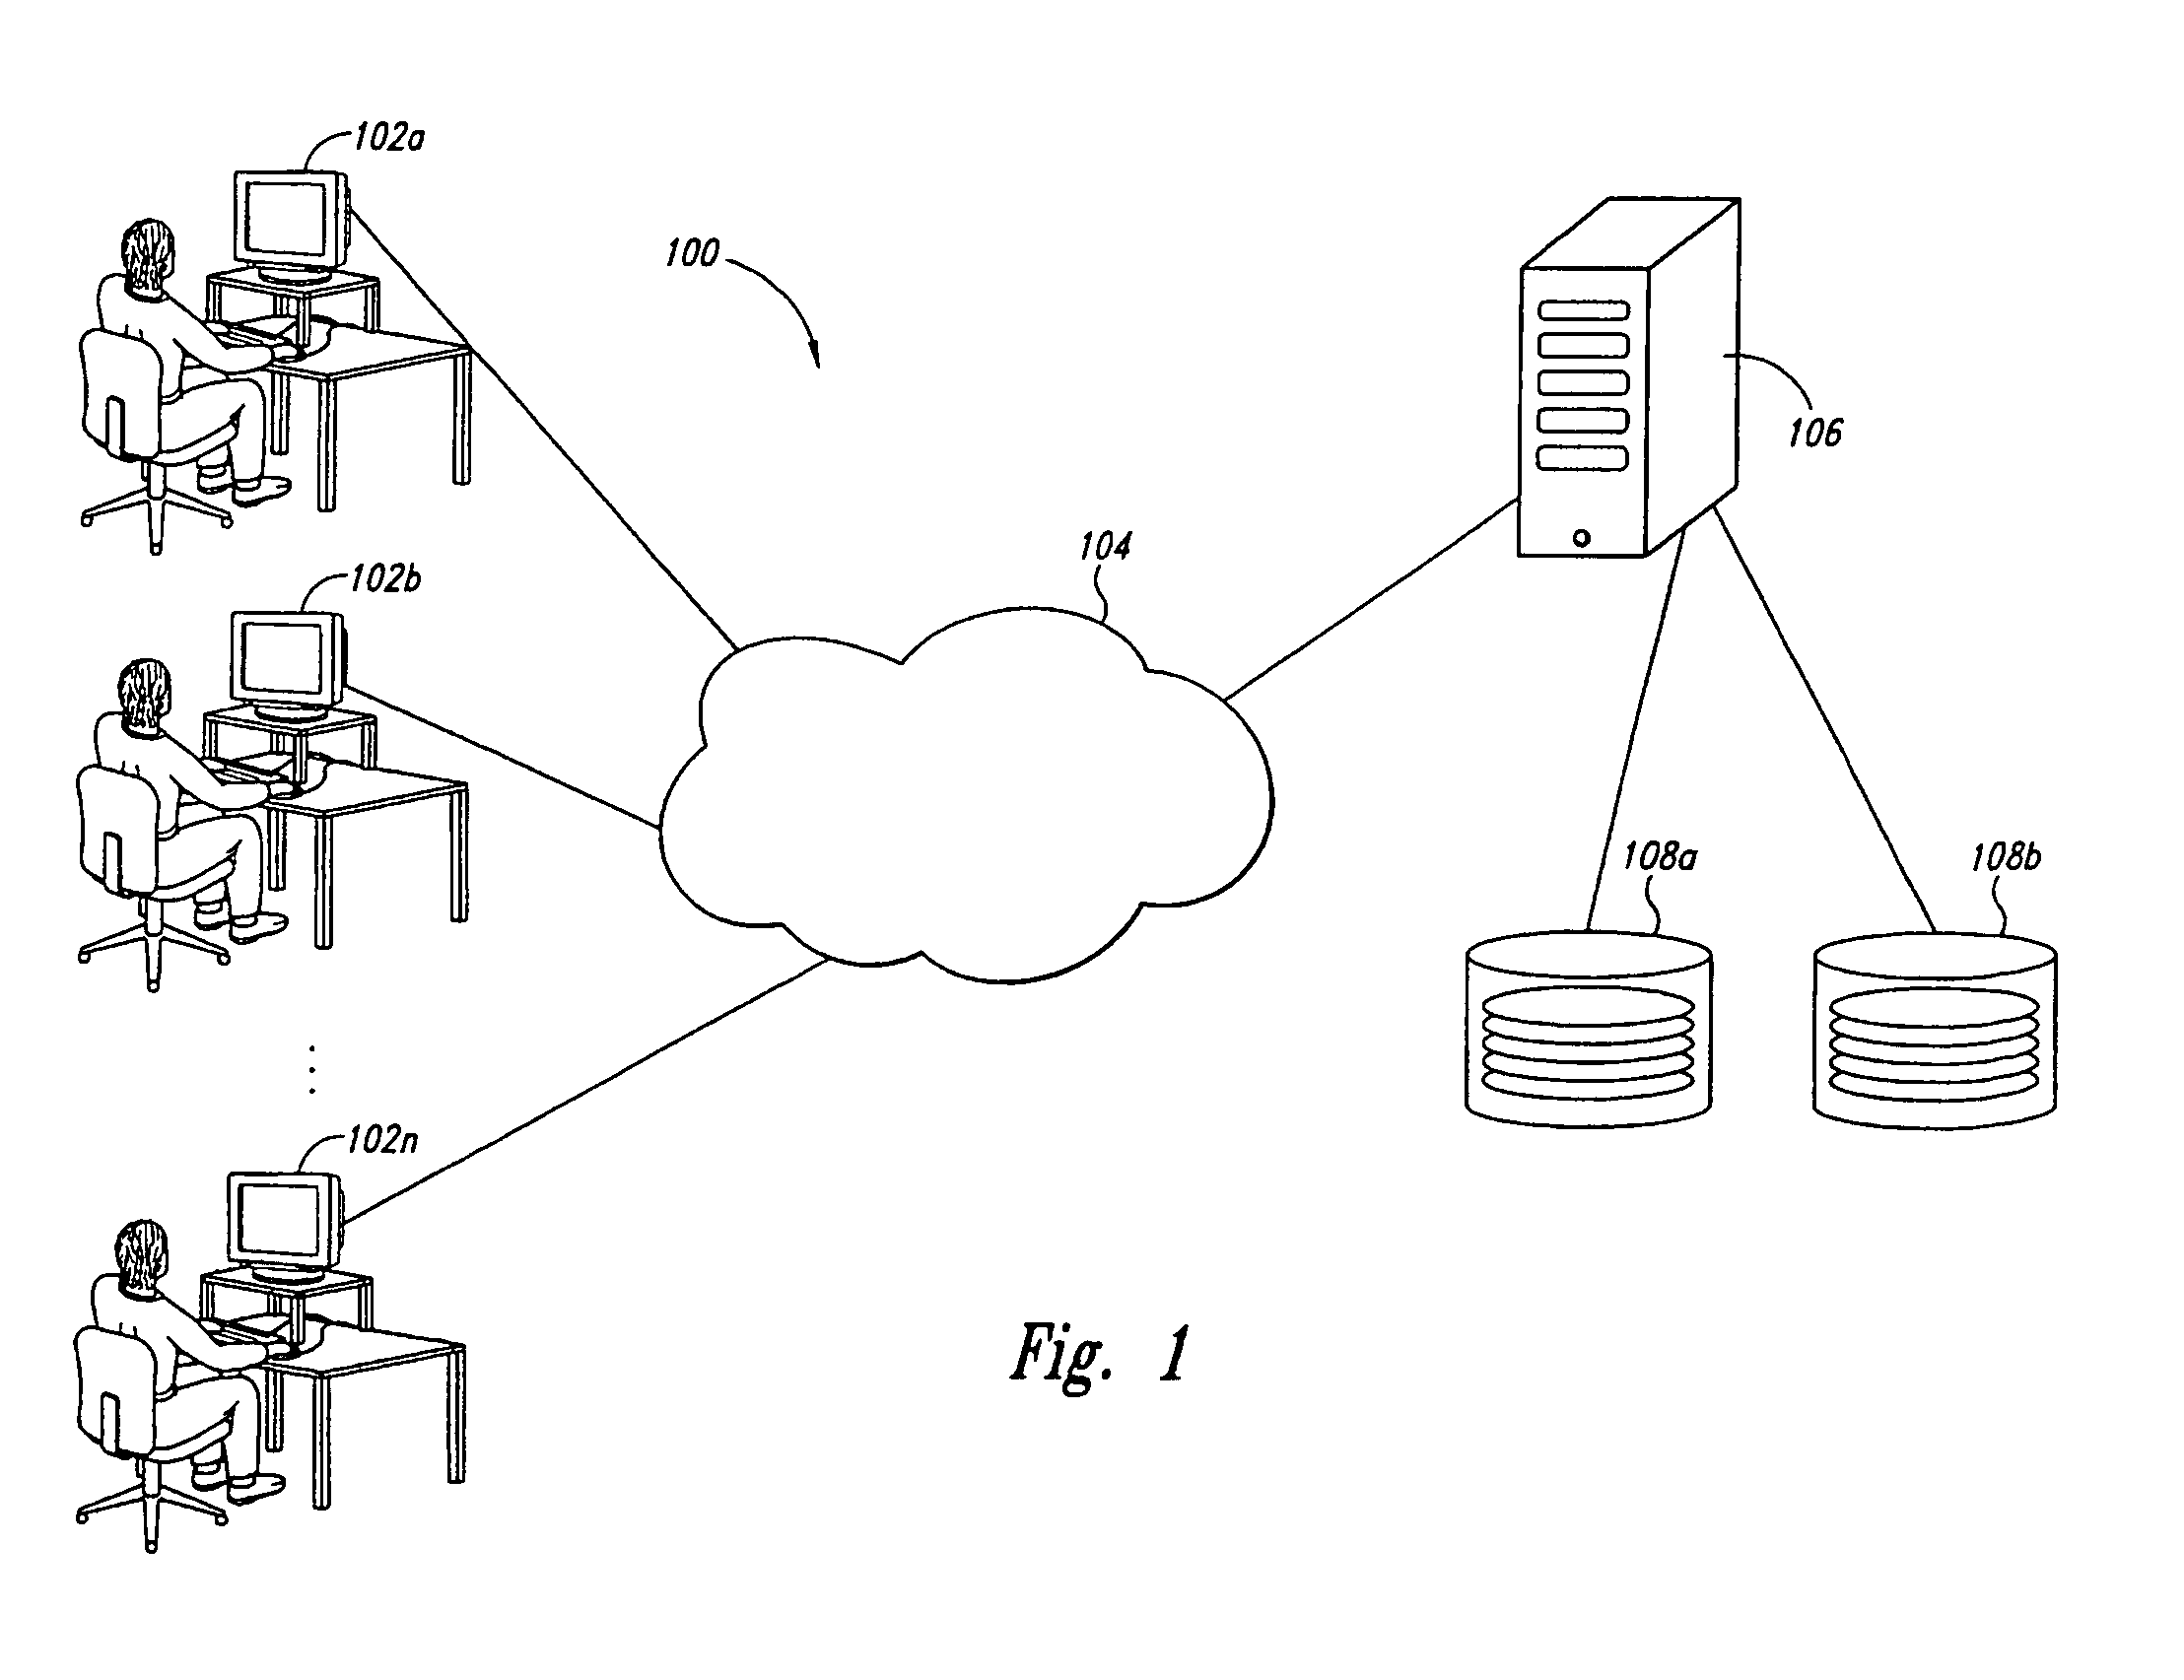
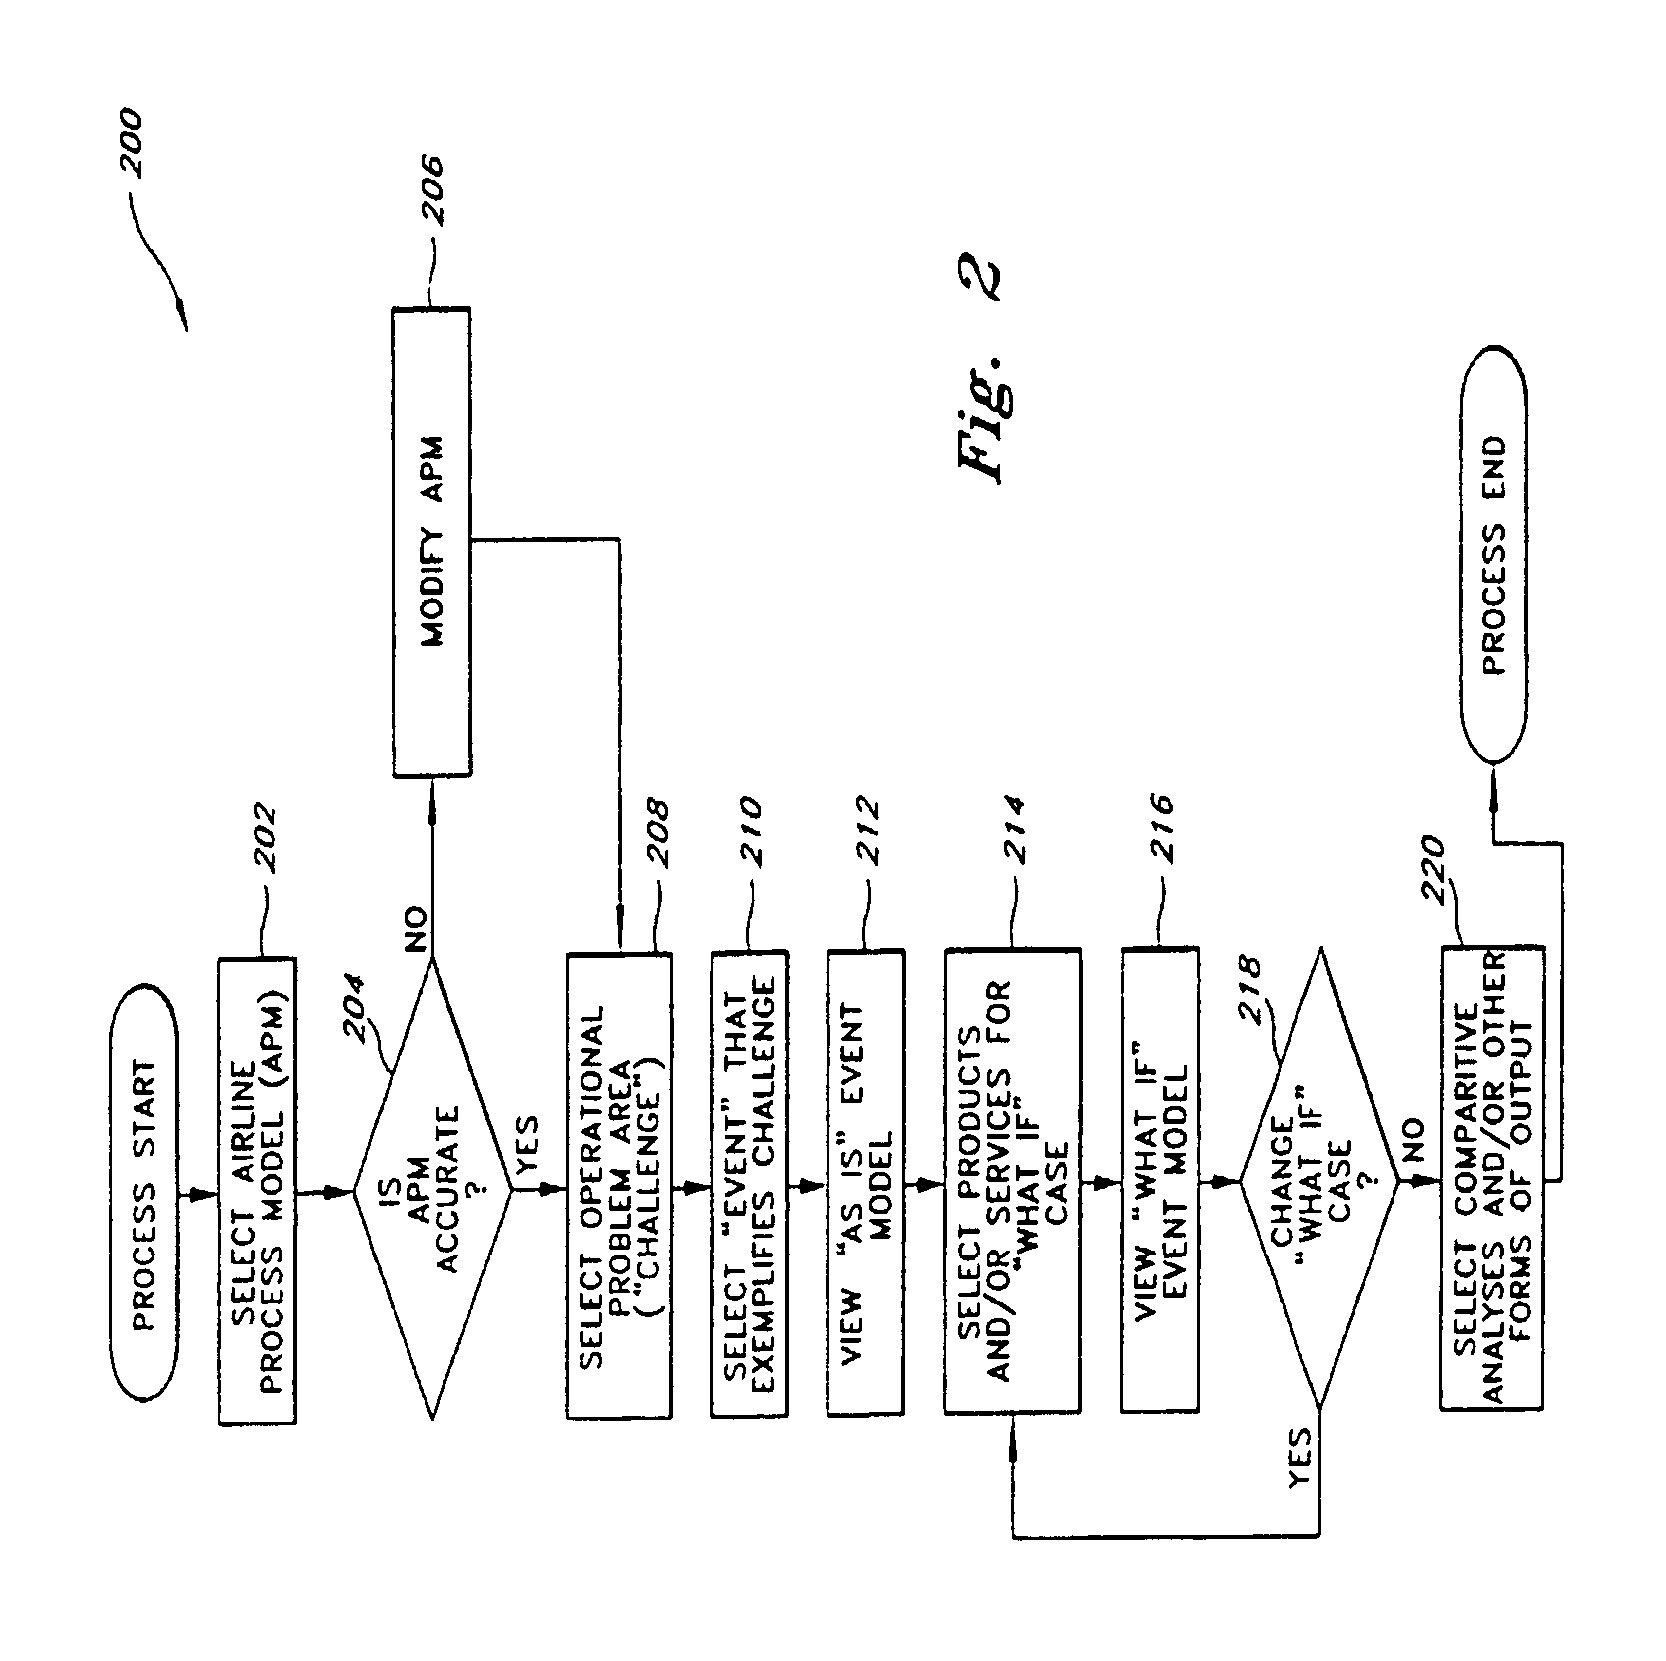
[0035]The following disclosure describes computer-implemented methods and systems for modeling the operations of airlines and other commercial and non-commercial industries, and for simulating and valuing the effects of different products and services on those operations, such as solutions for reducing service disruptions. Specific details of several embodiments of the invention are described below to provide a thorough understanding of the embodiments. Other details describing well-known aspects of airlines and airline operational systems are not set forth below, however, to avoid unnecessarily obscuring the description of the various embodiments. Furthermore, although various embodiments of the invention are described below, those of ordinary skill in the art will understand that the invention can have other embodiments in addition to those described below. Such embodiments may lack one or more of the elements described below or, conversely, they may include other elements in addi...


PUM


Abstract

A method for visualizing airline flight schedules graphically simulates the effect of a program implemented in airline flight operations to reduce the effect of disruptions in scheduled airline flights. One or more disruptions are introduced into a pre-selected airline flight schedule, using frequency distributions of disruptions and disruption severities, resulting in a disrupted flight schedule that reflects both initial and propagated delays. The disrupted flight schedule is used to visually simulate flight operations in 4-D, allowing comparisons of “as is” and “what if” scenarios.

Description

FIELD OF THE INVENTION[0001]This invention generally relates to modeling the operations of commercial airlines, and deals more particularly with a method for visualizing the effects of changes in airline flight schedules.BACKGROUND OF THE INVENTION[0002]An airline or other large commercial or non-commercial enterprise typically requires the coordinated efforts of many different functional groups. Generally, each of the different groups is responsible for managing a different part of the enterprise. A typical airline, for example, can include different functional groups for managing flight operations, aircraft maintenance, passenger services, and other aspects of the business necessary for day-to-day operations. The efficiency with which these different functional groups cooperate to run the airline can have a direct effect on the profitability and, ultimately, the success of the airline in a competitive marketplace.[0003]Conventional methods for modeling the complex operations of ai...

Claims


Application Information

Patent Timeline
Patent Type & Authority Patents(United States)
IPC IPC(8): G06Q10/00G01C21/34G06F9/44G05D1/08
CPCG06Q10/00G06Q10/02G06Q10/025G06Q10/063
Inventor TRAUTMAN, PHILIP L.
Owner THE BOEING CO
Why Eureka
Try Eureka