Attribute segments and data table bias reduction

a technology of attribute segments and data tables, applied in the field of methods and systems for analyzing data, can solve the problems of inability to provide on-demand flexible access, inconvenient use of data types, and significant bottlenecks in information systems, and achieve the effect of reducing bias

Active Publication Date: 2011-05-24
INFORMATION RESOURCES
View PDF48 Cites 105 Cited by
  • Summary
  • Abstract
  • Description
  • Claims
  • Application Information

AI Technical Summary

Benefits of technology

[0010]In embodiments, the present invention provides a method for updating data sources. The method may include identifying a plurality of data sources, identifying a plurality of overlapping attribute segments to use for comparing the data sources, calculating a factor as a function of each of the plurality of overlapping attribute segments, and using the factors to update a first group of values in the second data source to reduce bias. Further, at least a first data source may be more accurate than a second data source.

Problems solved by technology

While each data type may provide an opportunity to analyze a particular aspect of consumer behavior, the utility of any single data type has inherent limitations.
Information systems are a significant bottle neck for market analysis activities.
The architecture of information systems is often not designed to provide on-demand flexible access, integration at a very granular level, or many other critical capabilities necessary to support growth.
Thus, information systems are counter-productive to growth.
Hundreds of market and consumer databases make it very difficult to manage or integrate data.
Restatements of data hierarchies waste precious time and are very expensive.
Navigation from among views of data, such as from global views to regional to neighborhood to store views is virtually impossible, because there are different hierarchies used to store data from global to region to neighborhood to store-level data.
Analyses and insights often take weeks or months, or they are never produced.
Currently, market analysis, business intelligence, and the like often use rigid data cubes that may include hundreds of databases that are impossible to integrate.
This may make it almost impossible to navigate from global uses that are used, for example, to develop overall company strategy, down to specific program implementation or customer-driven uses.
These ad hoc analytic tools and infrastructure are fragmented and disconnected.

Method used


Image

  • Attribute segments and data table bias reduction
  • Attribute segments and data table bias reduction
  • Attribute segments and data table bias reduction

Examples


Embodiment Construction

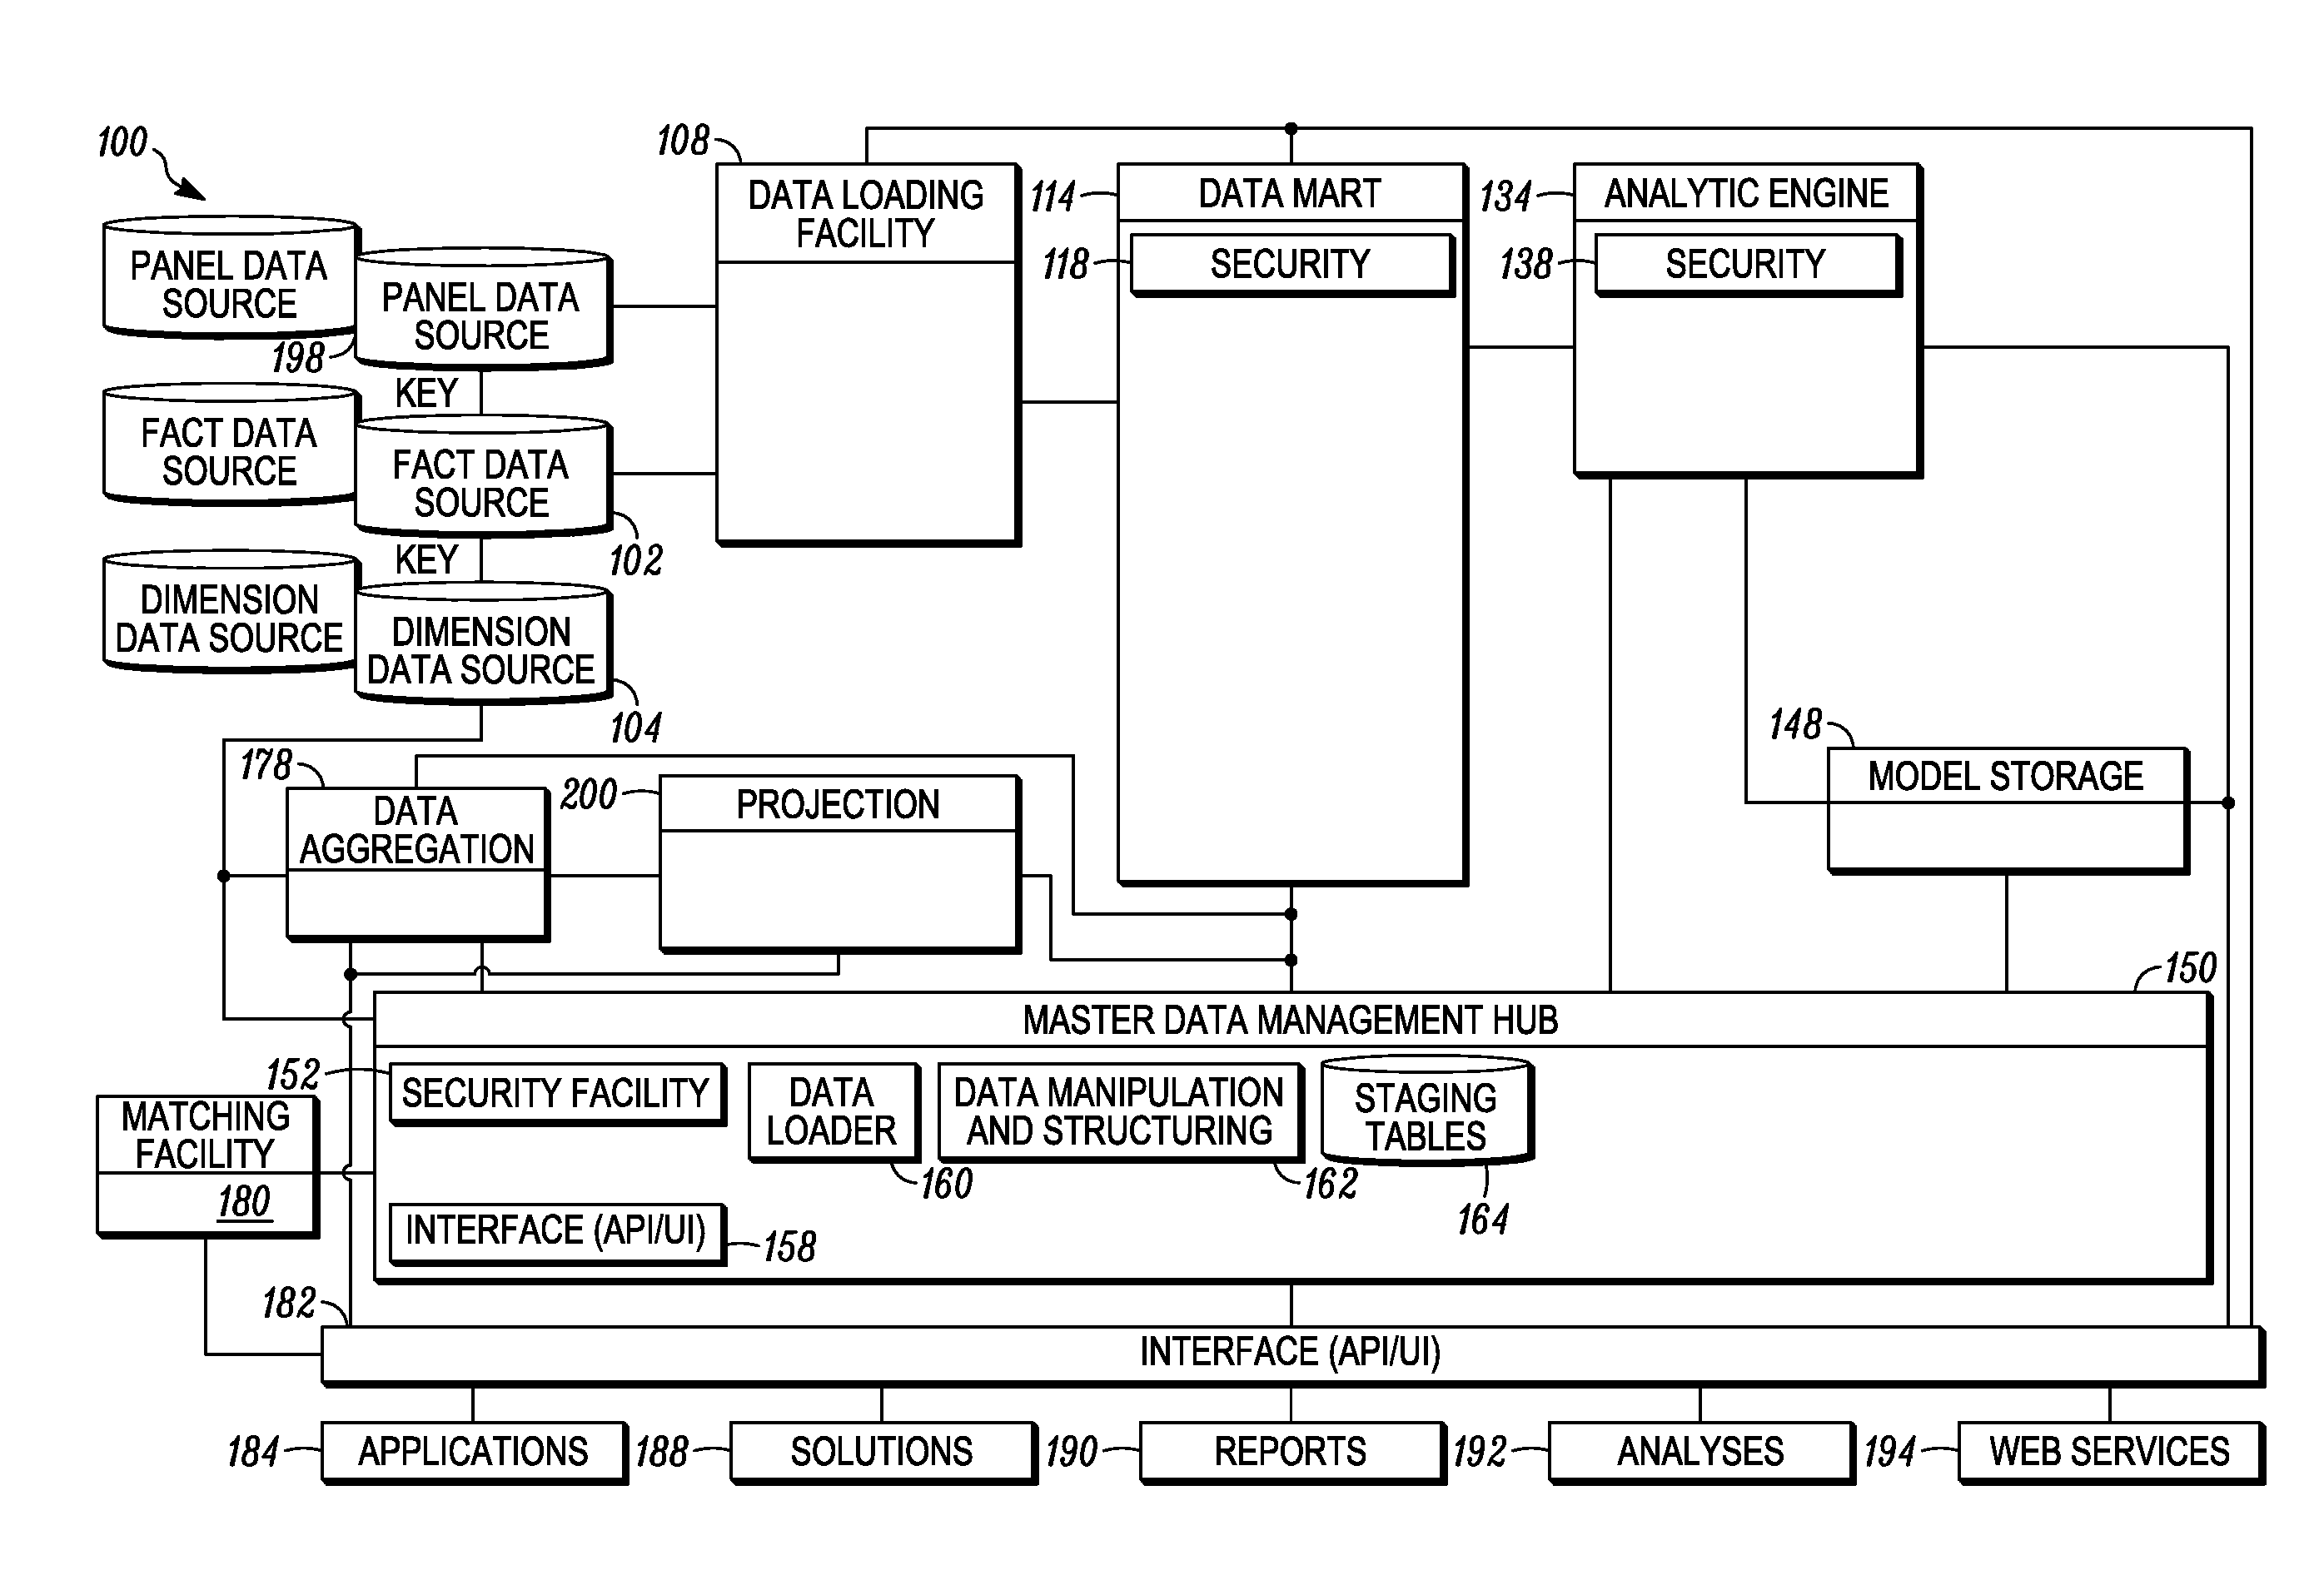
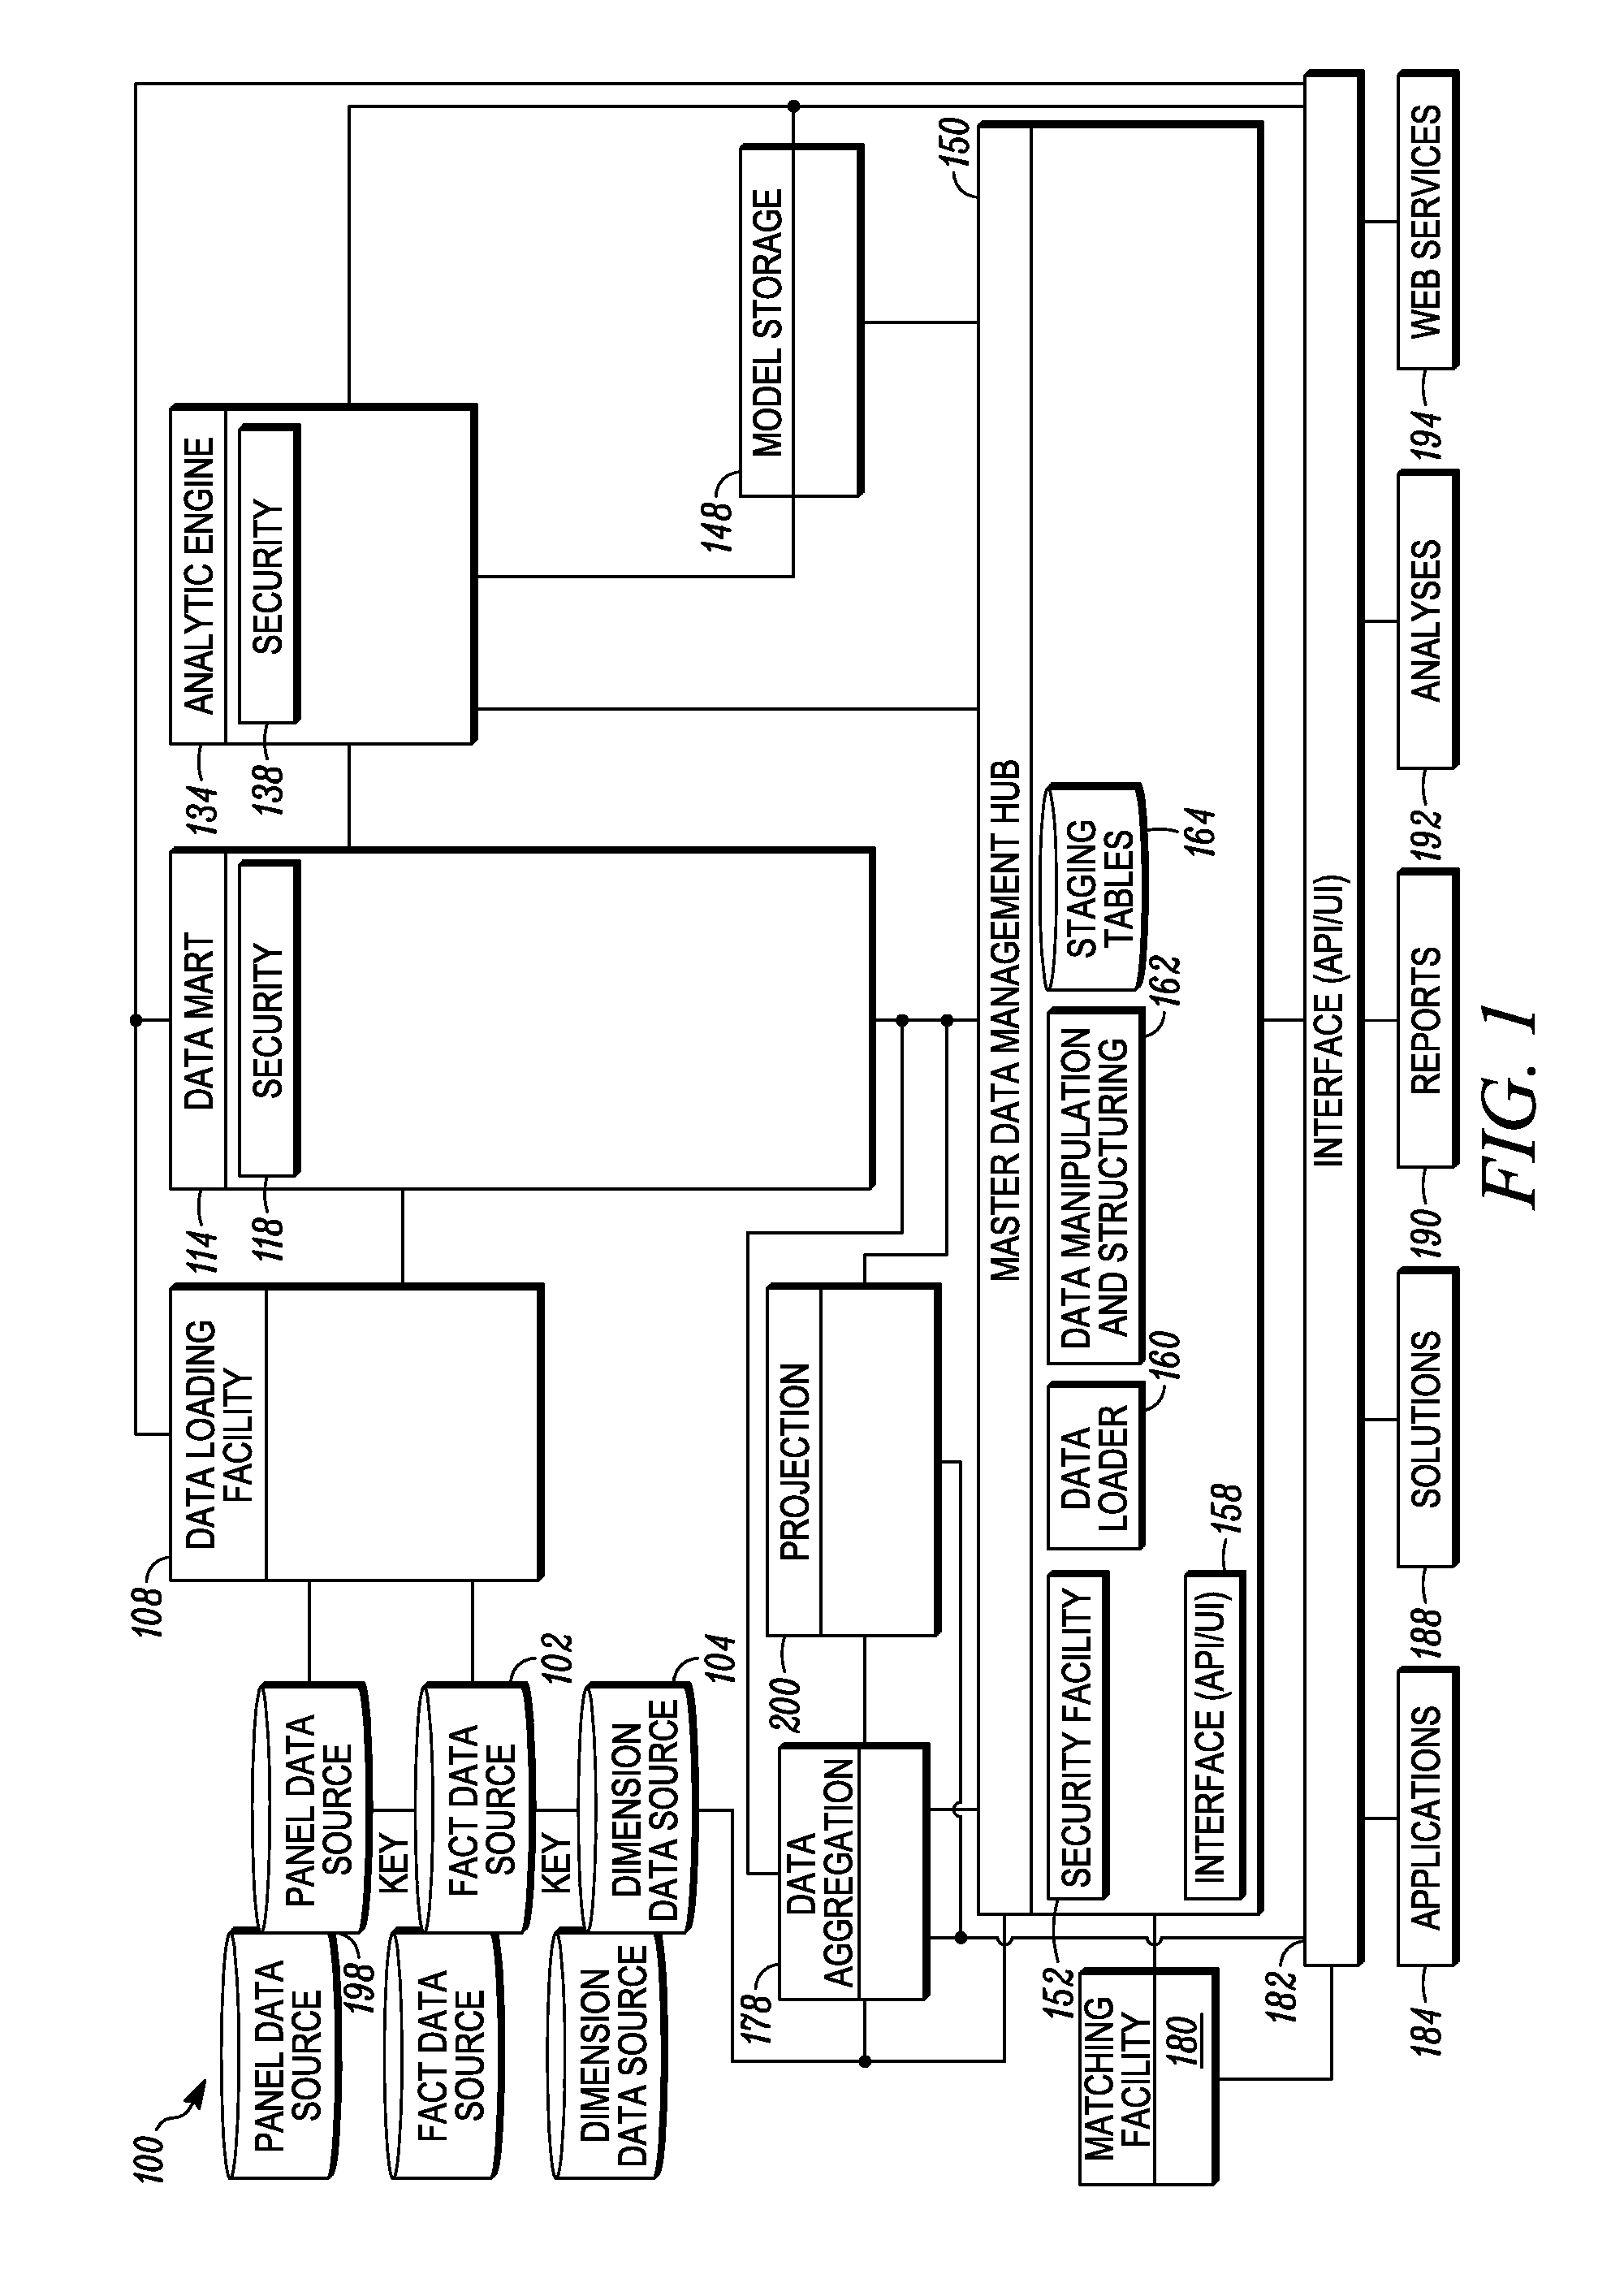
[0025]An aspect of the present invention includes an analytic platform 100 that may be used to create an integrated, actionable view of consumers, consumer behavior, commodity sales, and other commercial activities, such as the relationship between consumers and stores, and the like. Currently, there exists a large variety of data sources, such as panel data sources 198, fact data sources 102, and dimension data sources 104, from which commercial activities, such as consumer behaviors, may be analyzed, projected, and used to better understand and predict commercial behavior. Available datasets may include retailer point-of-sale data, loyalty data, panel data (e.g., consumer network panel data), custom research data, attitude data, usage data, permission-based marketing data, manufacturer data, third-party data, scan key, data, or some other type of data associated with consumer behaviors. Each data type may provide an opportunity to analyze a particular aspect of consumer behavior. ...


PUM


Abstract

The present invention provides a method for updating data sources. The method may include identifying a plurality of data sources, identifying a plurality of overlapping attribute segments to use for comparing the data sources, calculating a factor as a function of each of the plurality of overlapping attribute segments, and using the factors to update a first group of values in the second data source to reduce bias. Further, at least a first data source is more accurate than a second data source.

Description

CROSS-REFERENCE TO RELATED APPLICATIONS[0001]This application is a continuation-in-part of the following applications, each of which is hereby incorporated by reference in its entirety: U.S. patent application Ser. No. 12 / 021,263 filed Jan. 28, 2008, which claims the benefit of U.S. Prov. App. No. 60 / 886,798 filed on Jan. 26, 2007 and U.S. Prov. App. No. 60 / 886,801 filed Jan. 26, 2007; and U.S. patent application Ser. No. 10 / 783,323 filed Feb. 20, 2004 now U.S. Pat. No. 7,873,529.[0002]This application claims the benefit of the following provisional applications, each of which is hereby incorporated by reference in its entirety U.S. Prov. App. No. 60 / 887,122 filed Jan. 29, 2007; U.S. Prov. App. No. 60 / 891,933 filed Feb. 27, 2007; U.S. Prov. App. No. 60 / 979,305 filed Oct. 11, 2007; and U.S. Prov. App. No. 60 / 891,507 filed Feb. 24, 2007.[0003]This application is a continuation-in-part of the following U.S. patent application, which is incorporated by reference in its entirety: applica...

Claims


Application Information

Patent Timeline
Patent Type & Authority Patents(United States)
IPC IPC(8): G06F7/00
CPCG06Q30/02
Inventor HUNT, HERBERT DENNISWEST, JOHN RANDALLGIBBS, MARSHALL ASHBYGRIGLIONE, BRADLEY MICHAELHUDSON, GREGORY DAVID NEILBASILICO, ANDREAJOHNSON, ARVID C.BERGEON, CHERYL G.CHAPA, CRAIG JOSEPHAGOSTINELLI, ALBERTOYUSKO, JAY ALANMASON, TREVOR
Owner INFORMATION RESOURCES
Why Eureka
Try Eureka